Download presentation
Presentation is loading. Please wait.

1
CS1512 Foundations of Computing Science 2 Lecture 20 Probability and statistics (2)
© J R W Hunter, 2006

2
Ordinal data a1 ≤ a2 ≤ a3 ≤ ... ≤ ak ≤ ... ≤ aK
X is an ordinal variable with values: a1, a2, a3, ... ak, aK ‘ordinal’ means that: a1 ≤ a2 ≤ a3 ≤ ≤ ak ≤ ≤ aK cumulative frequency at level k: ck = sum of frequencies of values less than or equal to ak ck = f1 + f2 + f fk = (f1 + f2 + f fk-1 ) + fk = ck fk also (%) cumulative relative frequency
 + fk = ck-1 + fk. also (%) cumulative relative frequency.")
3
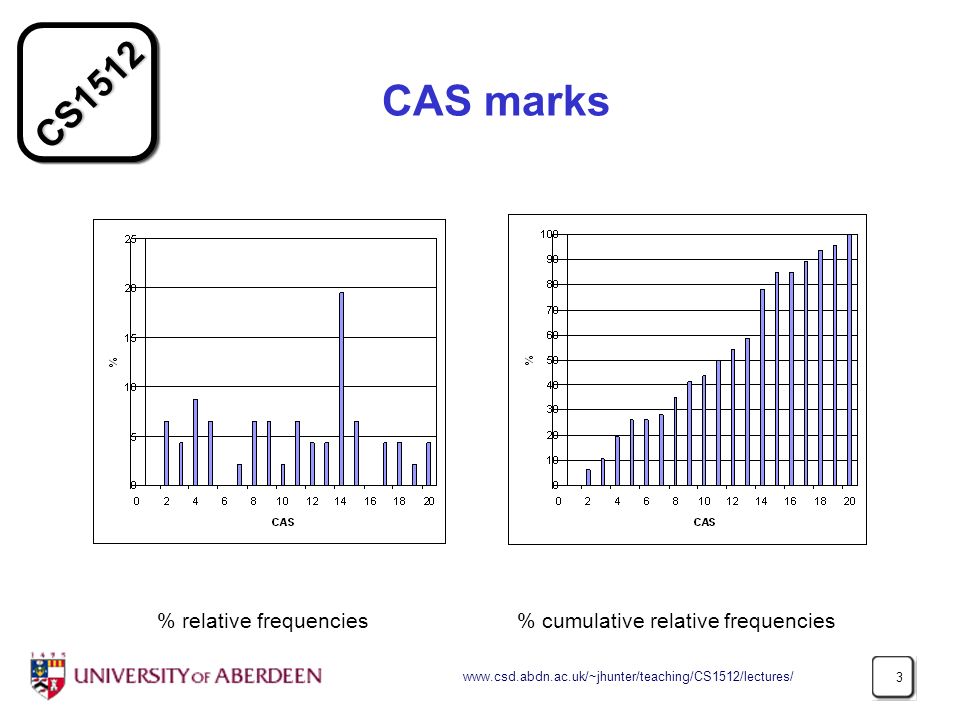
CAS marks % relative frequencies % cumulative relative frequencies
4
Enzyme concentrations
Concentration Freq Rel.Freq % Cum. Rel. Freq. ≤ c < % ≤ c < % ≤ c < % ≤ c < % ≤ c < % ≤ c < % ≤ c < % ≤ c < % ≤ c < % ≤ c < % Totals

5
Cumulative histogram

6
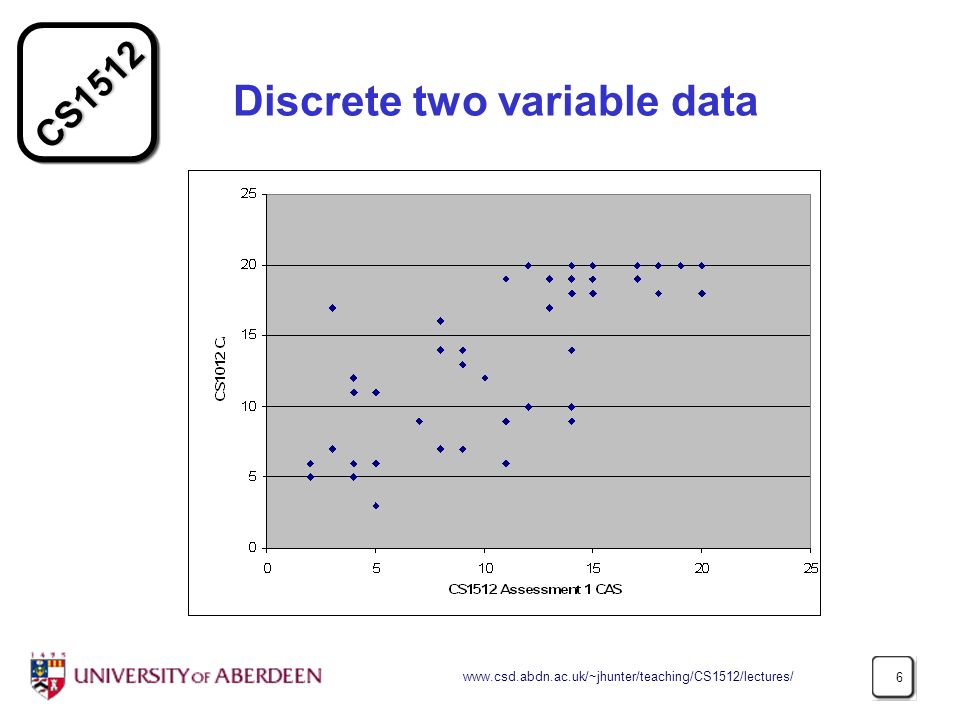
Discrete two variable data
7
Continuous two variable data
X Y

8
Time Series Time and space are fundamental (especially time)
Time series: variation of a particular variable with time

9
Summarising data by numerical means
Further summarisation (beyond frequencies) Measures of location (Where is the middle?) Mean Median Mode
 Measures of location (Where is the middle ) Mean. Median. Mode.")
10
Mean = n _ sum of observed values of X Sample Mean (X) =
number of observed values x = n use only for quantitative data

11
Sigma xi = x1 + x2 + ... + xi + ... + xn-1 + xn
Sum of n observations n xi = x1 + x xi xn xn i = 1 If it is clear that the sum is from 1 to n then: x = x1 + x xi xn xn Sum of squares x2 = x x xi xn xn2

12
x from frequencies If X is a categorical variable with values: a1, a2, a3, ... ak, aK x = x1 + x xi xn xn (order of summation isn’t important) (e.g. piglets: ) Group together those x’s which have value a1, those with value a2, ... x = x x x x’s which have value a1 - there are f1 of them x x x’s which have value a2 - there are f2 of them x x x’s which have value aK - there are fK of them = f1 * a f2 * a fk * ak fK * aK K = fk * ak k = 1
 (e.g. piglets: ) Group together those x’s which have value a1, those with value a2, ... x = x.. + x.. + x x’s which have value a1 - there are f1 of them. x.. + x x’s which have value a2 - there are f2 of them ... x.. + x.. x’s which have value aK - there are fK of them. = f1 * a1 + f2 * a fk * ak fK * aK. K. = fk * ak. k = 1.")
13
Mean Litter size Frequency Cum. Freq ak fk Total K x = fk * ak k = 1 = 1* * *7 + 3* * *10 + 8* *12 + 3*13 + 2*14 = 375 _ X = 375 / 36 = 10.42

14
Median Sample median of X = middle value when n sample observations
are ranked in increasing order = the ((n + 1)/2)th value n odd: values: , 163, 152, 157 and 157 rank order: 152, 157, 157, 163, 183 median: n even: values: , 173, 180, 164 rank order: 164, 165, 173, 180 median: ( )/2 = 169
/2)th value. n odd: values: 183, 163, 152, 157 and 157. rank order: 152, 157, 157, 163, 183. median: 157. n even: values: 165, 173, 180, 164. rank order: 164, 165, 173, 180. median: ( )/2 =")
15
Median Median = 10.5 Litter size Frequency Cum. Freq 5 1 1 6 0 1 7 2 3
Total Median = 10.5

16
Median from cumulative distribution
cumulative % frequency polygon

17
Mode Sample mode = value with highest frequency (may not be unique)
Litter size Frequency Cum. Freq Mode = 10

18
Skew left skewed symmetric right skewed
mean < mode mean mode mean > mode

19
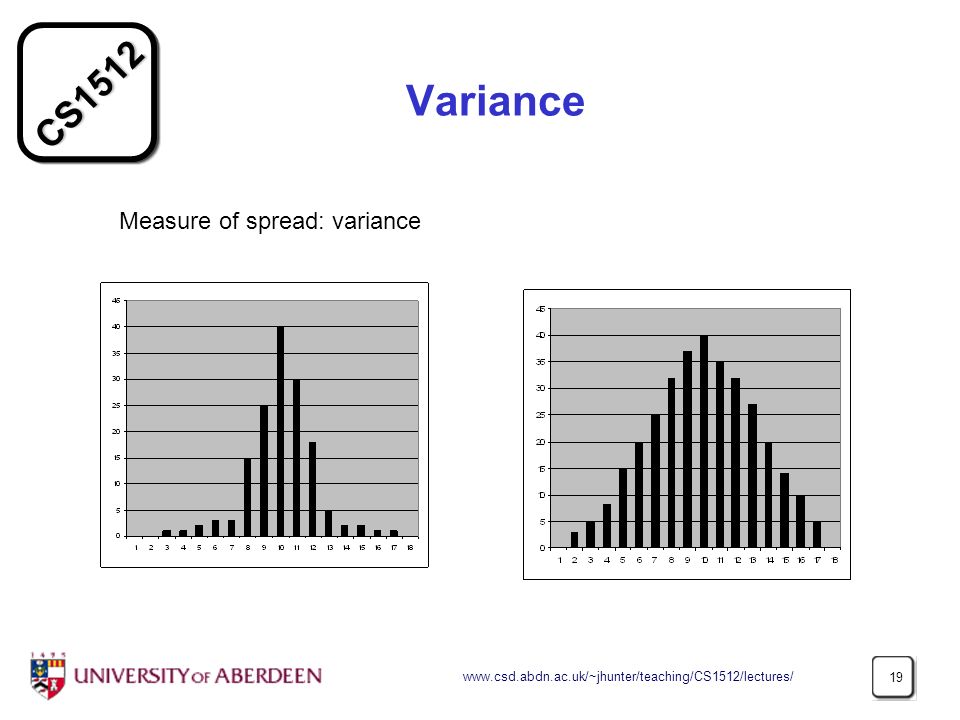
Variance Measure of spread: variance
20
Variance sample variance = s2
sample standard deviation = s = √ variance

21
Variance and standard deviation
K x2 = fk * ak2 k = 1 = 1* * * * * * * * *196 = 4145 x = 375 (x)2 / n = 375*375 / 36 = 3906 s2 = ( ) / (36-1) = 6.83 s = 2.6 Litter size Frequency Cum. Freq ak fk Total
2 / n = 375*375 / 36. = s2 = ( ) / (36-1) = s = 2.6. Litter size Frequency Cum. Freq. ak fk Total")
22
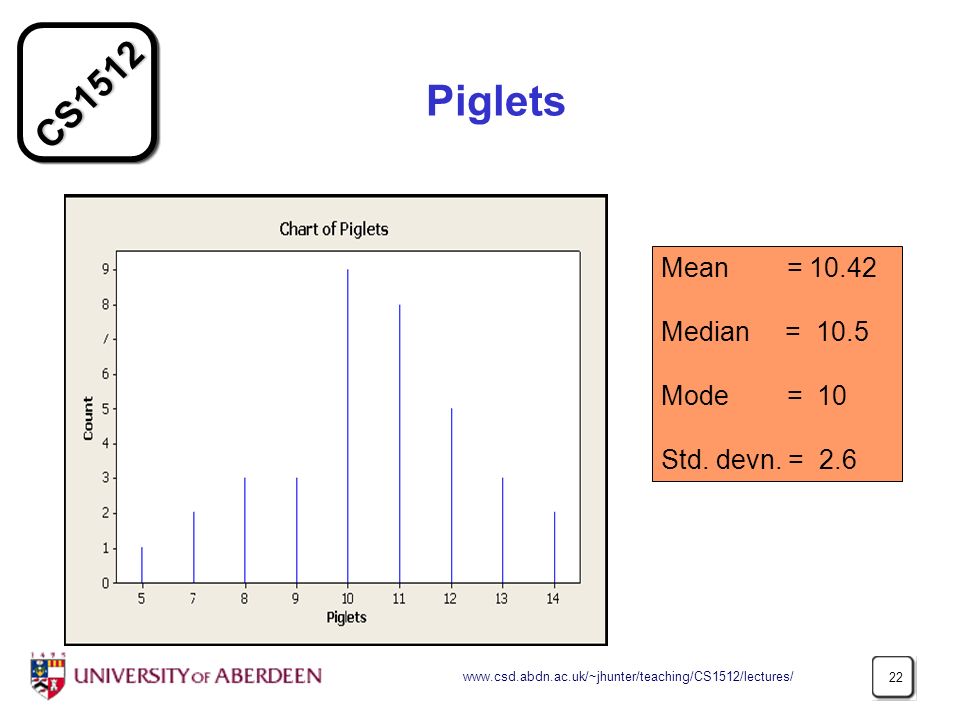
Piglets Mean = 10.42 Median = 10.5 Mode = 10 Std. devn. = 2.6
23
Quartiles and Range Lower quartile: value such that 25% of observations are below it (Q1). Median: value such that 50% of observations are below (above) it (Q2). Upper quartile: value such that 25% of observations are above it (Q3). Range: the minimum (m) and maximum (M) observations. Box and Whisker plot: m Q1 Q Q M
 it (Q2). Upper quartile: value such that 25% of observations are above it (Q3). Range: the minimum (m) and maximum (M) observations. Box and Whisker plot: m Q1 Q2 Q3 M.")
24
Estimating quartiles

25
Linear Regression y y = mc + c x
Calculate m and c so that (distance of point from line)2 is minimised y y = mc + c x
2 is minimised. y. y = mc + c. x.")
26
Time Series - Moving Average
Time Y point MA * * smoothing function can compute median, max, min, std. devn, etc. in window

Similar presentations


