Download presentation
Presentation is loading. Please wait.

1
“PREDICTIVE MODELING” CoSBBI, July 11 2013 Jennifer Hu

2
REVIEW: CONDITIONAL PROBABILITY The conditional probability of an event A given the knowledge that an event B has already occurred is denoted P(A|B). If P(B) > 0, Clearly, if events A and B are independent so that event B has no effect on the probability of event A, the conditional probability of event A given event B is simply the probability of event A, that is, P(A). Draw a Venn diagram of this to convince yourself if it is not clear.
 > 0, Clearly, if events A and B are independent so that event B has no effect on the probability of event A, the conditional probability of event A given event B is simply the probability of event A, that is, P(A). Draw a Venn diagram of this to convince yourself if it is not clear..")
3
Example Questions 1.Two fair dice are thrown. Given that the first shows 3, what is the probability that the total exceeds 6? 2.A family has two children. a)What is the probability that both are boys, given that at least one is a boy? b)What is the probability that both are boys, given that the older one is a boy? (For student) 3.A machine produces parts that are either good (80%), slightly defective (10%), or obviously defective (10%). Produced parts get passed through an automatic inspection machine, which is able to detect any part that is obviously defective and discard it. What is the probability that a part is good, given that it passed the machine? (For student)
What is the probability that both are boys, given that at least one is a boy. b)What is the probability that both are boys, given that the older one is a boy. (For student) 3.A machine produces parts that are either good (80%), slightly defective (10%), or obviously defective (10%). Produced parts get passed through an automatic inspection machine, which is able to detect any part that is obviously defective and discard it. What is the probability that a part is good, given that it passed the machine. (For student).")
4
A little bit more on conditional probabilities: Lemma: For any events A, B such that 0<P(B)<1, P(A) = P(A|B) P (B) + P(A|B c ) P(B c ) More generally, if B 1, B 2,…, B n is partition of the sample space S such that P(B i )>0, then
<1, P(A) = P(A|B) P (B) + P(A|B c ) P(B c ) More generally, if B 1, B 2,…, B n is partition of the sample space S such that P(B i )>0, then")
5
Illustrative question: The Superhero Elixir Only 2 pharmaceutical companies manufacture the Superhero Elixir ©. 20% of the elixir samples from company I and 5% from company II are defective and will turn you into a slobbering monster upon consumption. Company I produces 2x as much elixir as company II each week. a)Your friend presents you with a vial of Superhero Elixir ©, randomly chosen from 1 week’s production. You immediately take it. What is the probability that you become a superhero? b)Unfortunately, you draw the short end of the stick and turn into a slobbering monster instead. Is company I to blame? Compute the probability that your elixir was produced by company I.
Your friend presents you with a vial of Superhero Elixir ©, randomly chosen from 1 week’s production. You immediately take it. What is the probability that you become a superhero. b)Unfortunately, you draw the short end of the stick and turn into a slobbering monster instead. Is company I to blame. Compute the probability that your elixir was produced by company I..")
6
BAYES’ THEOREM Simple form: You should all be able to prove this in one line. (Hint: Recall the definition of conditional probability.) Now let’s talk a bit about diagnostic tests. Q1: What is sensitivity? Q2: What is specificity? Q3: What is positive predictive value? Q4: What is negative predictive value?
 Now let’s talk a bit about diagnostic tests. Q1: What is sensitivity. Q2: What is specificity. Q3: What is positive predictive value. Q4: What is negative predictive value .")
7
Definitions Sensitivity: true positive rate (e.g. the percentage of sick people who are correctly identified as having the condition) Specificity: true negative rate (e.g. the percentage of healthy people who are correctly identified as not having the condition) Positive predictive value: given that you test positive, the probability that you actually have the condition. Negative predictive value: given that you test negative, the probability that you actually do not have the condition.
 Specificity: true negative rate (e.g. the percentage of healthy people who are correctly identified as not having the condition) Positive predictive value: given that you test positive, the probability that you actually have the condition. Negative predictive value: given that you test negative, the probability that you actually do not have the condition..")
8
Example Questions 1.The prevalence of streptococcal pharyngeal infection in a small village with 500 people is 10%. A new test with sensitivity 90% and specificity 95% has been developed. a)What is the positive predictive value (PPV)? b)What is the negative predictive value (NPV)? c)There is another village with prevalence 20%. What is the PPV and NPV in this case? (For student) 2.Suppose that a drug test is 99% sensitive and 99% specific. 1% of people use the drug. You test positive. What is the probability that you use the drug? (For student) Remember the question you were asked on the pre-test? “The zombie apocalypse has come upon us in the form of a virus…” You should be able to answer it now.
What is the positive predictive value (PPV). b)What is the negative predictive value (NPV). c)There is another village with prevalence 20%. What is the PPV and NPV in this case. (For student) 2.Suppose that a drug test is 99% sensitive and 99% specific. 1% of people use the drug. You test positive. What is the probability that you use the drug. (For student) Remember the question you were asked on the pre-test. The zombie apocalypse has come upon us in the form of a virus… You should be able to answer it now..")
9
BAYESIAN INFERENCE Treat unknown quantities as random variables (so can assign probabilities). Use Bayes’ theorem to systematically update prior knowledge in the presence of observed data. Let’s now work out the example in chapter 2 of your reading. Assume organism has 20,000 genes. The gold standard is as follows (“positive example” = associated with disease, “negative example” = not associated with disease): Under condition A, gene i performs above the median. Given this observation, what is the probability that gene i is associated with the disease (is a “positive example”)?
: Under condition A, gene i performs above the median. Given this observation, what is the probability that gene i is associated with the disease (is a positive example ) .")
10
But we also have dataset we derived from condition B and C! What do we do with that? Assume that experimental results from different datasets are independent. Then, we can use the probability we just derived as the prior probability, and perform the same calculation for gene i in experimental condition B, and the calculation for condition C using the probability from condition B as the prior.

11
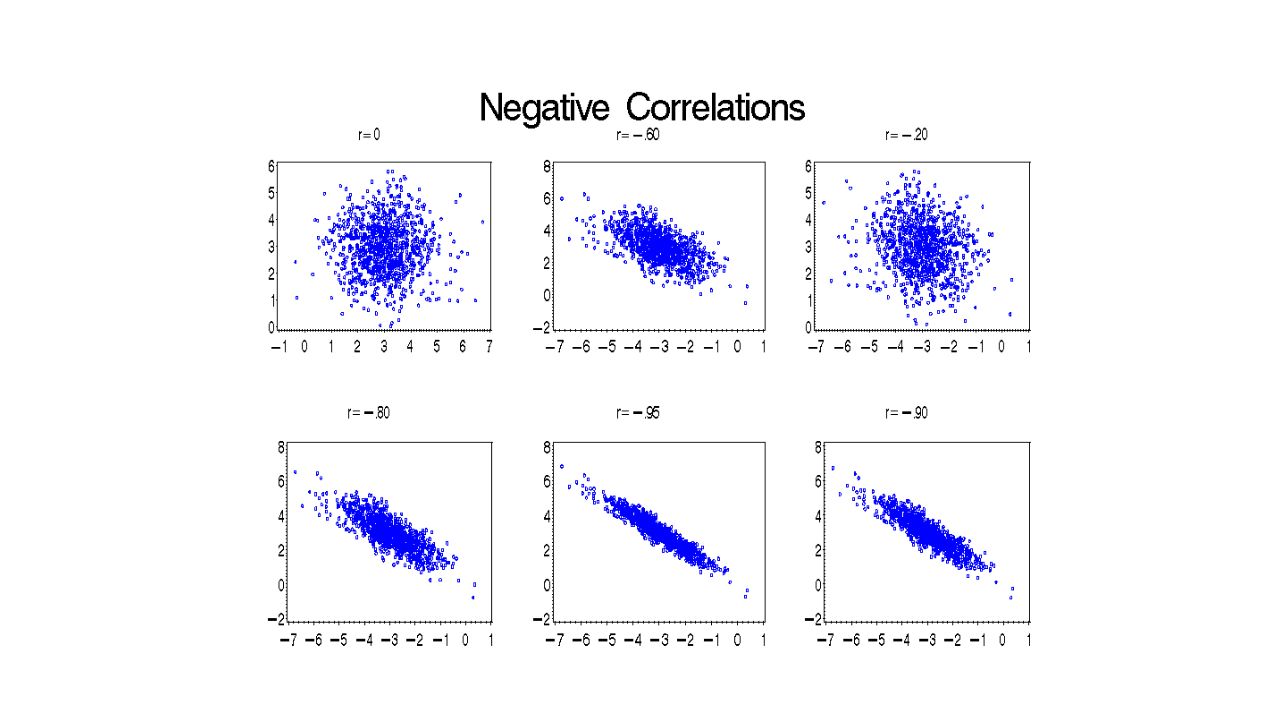
CORRELATION, PEARSON’S CORRELATION COEFFICIENT, AND FISCHER’S Z TRANSFORM When we say that two genes are correlated, we mean that they vary together. But how to quantify the degree of correlation? Pearson’s r measures the extent to which two random variables are linearly related. A value of 1 indicates a perfect positive correlation (that is, as one variable increases, the other increases proportionally in linear fashion). A value of -1 indicates a perfect negative correlation.
. A value of -1 indicates a perfect negative correlation..")
14
We don't usually know rho, the population correlation, so we use the statistic r to estimate rho and to carry out tests of hypotheses. The most common test is whether r = 0, that is whether the correlation is significantly different from zero. A sampling distribution is what you get if you take repeated samples from a population and compute a statistic each time you take a sample. In the case that rho is not 0, the sampling distribution is skewed (Oh no! This makes it difficult for hypothesis testing). Enter Fisher’s z transform…… z is approximately normal with mean and variance 1/(n-3)
. Enter Fisher’s z transform…… z is approximately normal with mean and variance 1/(n-3).")
15
ASSESSING QUALITY OF THE PREDICTIVE MODEL ROC-AUC The area under the curve is equal to the probability that a classifier will rank a randomly chosen positive instance higher than a randomly chosen negative one. Q: Why is the blue curve worthless? BUT, this approach to evaluating quality of the model is problematic, because it only tests the ability of the model to match the gold standard, and not its ability to make new predictions.

16
Method 1 (hold-out validation): divide gold standard into “training set” and “validation set”. Problem: when gold standards are small, too few known relationships for network assessment. Method 2 (k-fold cross validation): the original sample is randomly partitioned into k equal size subsamples. Of the k subsamples, a single subsample is retained as the validation data for testing the model, and the remaining k − 1 subsamples are used as training data. The cross- validation process is then repeated k times (the folds), with each of the k subsamples used exactly once as the validation data. The k results from the folds then can be averaged (or otherwise combined) to produce a single estimation. Method 3 (blind literature evaluation): Use existing literature. Select genes that are predicted with high probability for follow up. Also, combine with randomly selected gene to create gene list for evaluation. Assess literature evidence on genes on the list.
: the original sample is randomly partitioned into k equal size subsamples. Of the k subsamples, a single subsample is retained as the validation data for testing the model, and the remaining k − 1 subsamples are used as training data. The cross- validation process is then repeated k times (the folds), with each of the k subsamples used exactly once as the validation data. The k results from the folds then can be averaged (or otherwise combined) to produce a single estimation. Method 3 (blind literature evaluation): Use existing literature. Select genes that are predicted with high probability for follow up. Also, combine with randomly selected gene to create gene list for evaluation. Assess literature evidence on genes on the list..")
Similar presentations


. 2 Predicting performance Assume the estimated error rate is 25%. How close is this to the true error rate? Depends on the amount.>")


