Download presentation
Presentation is loading. Please wait.

1
Land Development Transport Investment Accessibili ty The Role of Transportation Investments in Shaping Land Development Robert Cervero UC Berkeley

2
Five Points (“Truths”?) 1) 1)Regionally, impacts are mainly Redistributive. Highways: California County Investments (Boarnet) Beltway Studies
 Beltway Studies.")
3
Highway Investments & Economic Productivity: Output in California Counties: 1969-1988

4
Beltways: Intra-Metropolitan Impacts Regional: The Beltway Study (Payne-Maxie, 1980) – –No effect on regional growth rates – –Modest effect on retail sales differentials between CBDs and suburbs Hartgen (1999): Hartgen (1999): Non beltway cities (Charlotte, Nashville) have economically performed as well as beltway cities Economic Development Research Group (1999): Economic Development Research Group (1999): Review of bypasses in small & medium size cities: net effect is relatively small (neither devastating or savior of area)
 – –No effect on regional growth rates – –Modest effect on retail sales differentials between CBDs and suburbs Hartgen (1999): Hartgen (1999): Non beltway cities (Charlotte, Nashville) have economically performed as well as beltway cities Economic Development Research Group (1999): Economic Development Research Group (1999): Review of bypasses in small & medium size cities: net effect is relatively small (neither devastating or savior of area)")
5
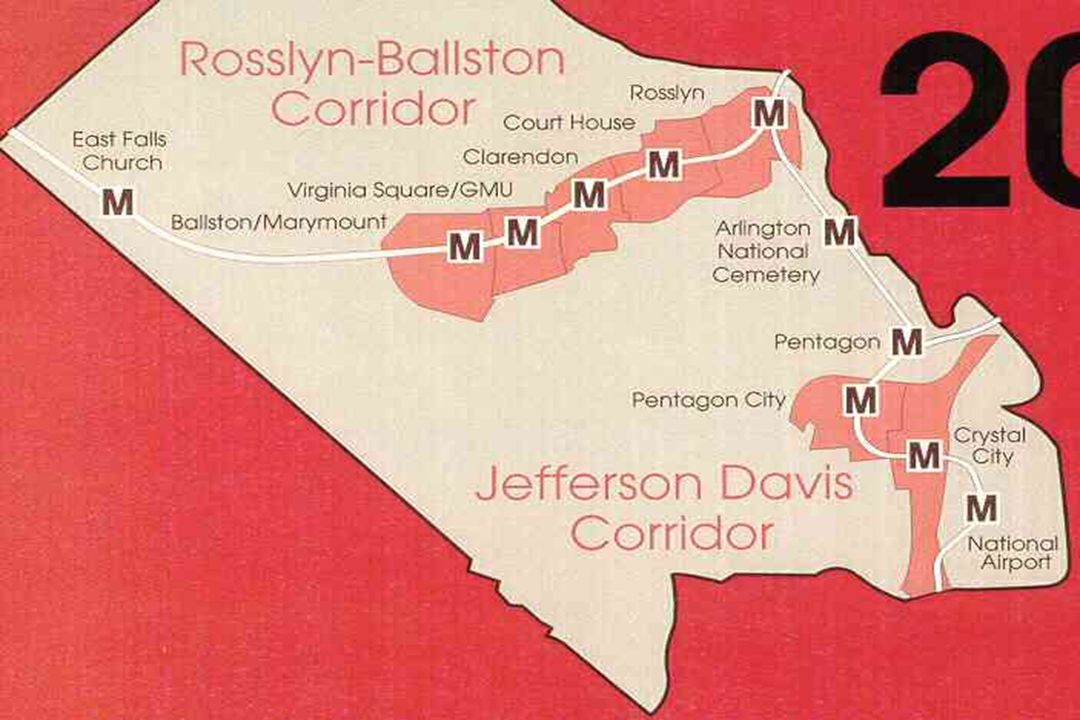
2 nd Point 2) 2)Growth is a Prerequisite for “Big” Land Use Changes (i.e., has to be something to redistribute). Transit (New Growth Nodes): Transit (New Growth Nodes): Arlington County’s Metrorail Transit (Redevelopment): Transit (Redevelopment): New Jersey (Jersey City; Commuter Rail Towns)
: Transit (New Growth Nodes): Arlington County’s Metrorail Transit (Redevelopment): Transit (Redevelopment): New Jersey (Jersey City; Commuter Rail Towns).")
7
Arlington County Office-Retail Development Trends 1960-2000: 1960-2000: 26,550 housing units/25.5 million sq. ft. commercial space added Corridors:Corridors: 52% of County tax base on 11% of land area Density: Density: Suburban standards would require 7 times area

8
The Ridership Payoff 39% of employed-residents rail-commute 39% of employed-residents rail-commute 37% of office workers rail-commute 37% of office workers rail-commute Balanced Development = Balanced Flows Balanced Development = Balanced Flows ~ 2/3 access by “non-motorized transport” ~ 2/3 access by “non-motorized transport”

9
LRT Redevelopment: Jersey City’s Hudson-Bergen Line

10
3 rd Point 3) 3)Timing/Congestion Levels Matter Transit: Transit: Santa Clara County’s Land-Value Premiuims Highways: California: Freeway Expansions Induce Big Land Use Changes Ohio: Road investment have little impact
 3)Timing/Congestion Levels Matter Transit: Transit: Santa Clara County’s Land-Value Premiuims Highways: California: Freeway Expansions Induce Big Land Use Changes Ohio: Road investment have little impact")
11
2000 Expanded, mature system Economic Boom/Congestion 1996-2000 TOD: 1996-2000 4,500 Housing Units 9+ million sq. ft. of commercial space Cervero Study: Appreciable Capitalization benefits Santa Clara County LRT 1991 New, minimal system Recession/Little Congestion Landis Study: No capitalization benefit for housing

12
Transit Proximity & Value-Added: Santa Clara Valley, 1999-2000 (24 % ) (103 % ) (28 % ) (17 % ) COMMERCIAL PARCELS RESIDENTIAL PARCELS
 (103 % ) (28 % ) (17 % ) COMMERCIAL PARCELS RESIDENTIAL PARCELS")
13
Land Use: Elasticities Elasticities No. Years Lagged Coefficient Residential Single- Family 2 1.31 Multi- Family 41.25 Non- Residential Office 30.66 Retail-- Industrial 3 0.41 Other 4 0.58 % in Share of County Building Permits % in Share of County Building Permits ---------------------------------------------------- - ---------------------------------------------------- - % in Freeway Lane-Mile Capacity % in Freeway Lane-Mile Capacity Building Activity – Freeway Expansion Elasticities 24 California Freeway Segments: 1980-1996

14
Land-Use Shifts Behavioral Shifts Absorbed:InducedDemand Preserved Absorbed: External Factors What Happens to Added Road Capacity in 5-8 Years? California’s Experiences

15
Road improvements weakly correlated with growth Road projects generally follow growth Akron Ohio: Changes in Population & Road Improvements, 1990- 2000 Major Growth Areas

16
4 th Point 4) 4)Given Growth, Proactive Planning is Key to Leveraging “Smart Growth” Outcomes Transit: San Diego “Tiajuana Corridor”: No Growth, Little Planning, No Impacts Mission Valley Corridor: Substantial Growth, Proactivism, Big Impacts
 4)Given Growth, Proactive Planning is Key to Leveraging Smart Growth Outcomes Transit: San Diego Tiajuana Corridor : No Growth, Little Planning, No Impacts Mission Valley Corridor: Substantial Growth, Proactivism, Big Impacts")
17
San Diego Rail Stations MF Housing Commercial SAN DIEGO TROLLEY & COASTER’s VALUE-ADDED

18
5 th Point 5) 5)Finance Connection: Value Capture – Makes Sense in Theory, Hard in Practice Happens: Indirectly: Property Tax Intake More directly: Joint Development Most directly: Benefit Assessment
 5)Finance Connection: Value Capture – Makes Sense in Theory, Hard in Practice Happens: Indirectly: Property Tax Intake More directly: Joint Development Most directly: Benefit Assessment")
19
Los Angeles: Mixed Experiences Multi-Family Housing Premium/Discount Benefit Assessment Benefit Assessment 9% of funds to retire Red Line Capital Bonds

20
Fiscal Policy Lessons? fiscal consequence – smart growth (e.g., TOD) reduce costly sprawlTransport investments, under the right conditions, are potentially powerful tools to shape growth: fiscal consequence – smart growth (e.g., TOD) reduce costly sprawl congested urban settings, commercial usesGovernments can and should participate in the value-added by transportation infrastructure, under right conditions – congested urban settings, commercial uses Benefit Assessment Joint Development Land-Banking/Co-Development
 reduce costly sprawlTransport investments, under the right conditions, are potentially powerful tools to shape growth: fiscal consequence – smart growth (e.g., TOD) reduce costly sprawl congested urban settings, commercial usesGovernments can and should participate in the value-added by transportation infrastructure, under right conditions – congested urban settings, commercial uses Benefit Assessment Joint Development Land-Banking/Co-Development.")
Similar presentations


 Wednesday. Extra Credit.>")


