Download presentation
Presentation is loading. Please wait.

1
Mass Spectrometry

2
Atom or molecule is hit by high-energy electron Principles of Electron-Impact Mass Spectrometry e–e–e–e–

3
Atom or molecule is hit by high-energy electron electron is deflected but transfers much of its energy to the molecule e–e–e–e– Principles of Electron-Impact Mass Spectrometry

4
Atom or molecule is hit by high-energy electron electron is deflected but transfers much of its energy to the molecule e–e–e–e– Principles of Electron-Impact Mass Spectrometry

5
This energy-rich species ejects an electron. Principles of Electron-Impact Mass Spectrometry

6
This energy-rich species ejects an electron. Principles of Electron-Impact Mass Spectrometry forming a positively charged, odd-electron species called the molecular ion e–e–e–e– +

7
Molecular ion passes between poles of a magnet and is deflected by magnetic field amount of deflection depends on mass-to-charge ratio highest m/z deflected least lowest m/z deflected most Principles of Electron-Impact Mass Spectrometry +

8
If the only ion that is present is the molecular ion, mass spectrometry provides a way to measure the molecular weight of a compound and is often used for this purpose. However, the molecular ion often fragments to a mixture of species of lower m/z.

9
The molecular ion dissociates to a cation and a radical. Principles of Electron-Impact Mass Spectrometry +

10
The molecular ion dissociates to a cation and a radical. Principles of Electron-Impact Mass Spectrometry + Usually several fragmentation pathways are available and a mixture of ions is produced.

11
mixture of ions of different mass gives separate peak for each m/z intensity of peak proportional to percentage of each ion of different mass in mixture separation of peaks depends on relative mass Principles of Electron-Impact Mass Spectrometry + + + + + +

12
mixture of ions of different mass gives separate peak for each m/z intensity of peak proportional to percentage of each atom of different mass in mixture separation of peaks depends on relative mass ++++ ++ Principles of Electron-Impact Mass Spectrometry

14
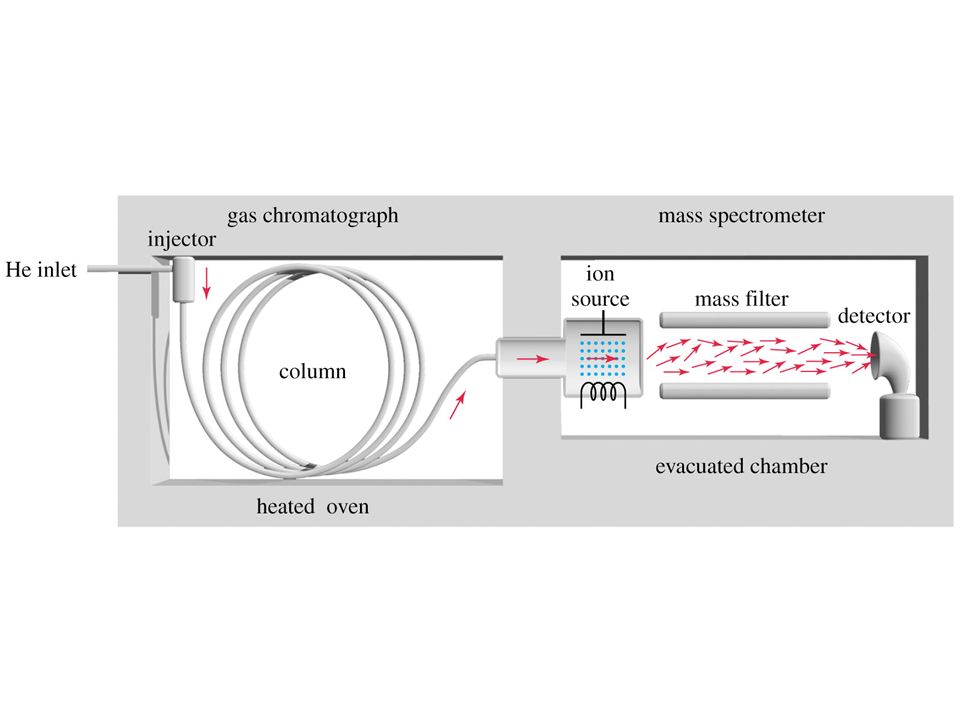
A Mass Spectrometer The mass spectrometer records a mass spectrum

17
A mass spectrum records only positively charged fragments m/z = mass to charge ratio of the fragment

18
Nominal molecular mass: the molecular mass to the nearest whole number The peak with the highest m/z value usually represents the molecular ion (M) Each m/z value is the nominal molecular mass of the fragment
 Each m/z value is the nominal molecular mass of the fragment")
19
Molecular Formula as a Clue to Structure

20
Molecular Weights CH 3 (CH 2 ) 5 CH 3 Heptane CH 3 CO O Cyclopropyl acetate Molecular formula Molecular weight C 7 H 16 C5H8O2C5H8O2C5H8O2C5H8O2 100100 Exact mass 100.1253100.0524 Mass spectrometry can measure exact masses. Therefore, mass spectrometry can give molecular formulas.

21
Molecular Formulas Knowing that the molecular formula of a substance is C 7 H 16 tells us immediately that is an alkane because it corresponds to C n H 2n+2 C 7 H 14 lacks two hydrogens of an alkane, therefore contains either a ring or a double bond

22
Index of Hydrogen Deficiency relates molecular formulas to multiple bonds and rings index of hydrogen deficiency = 1 2 (molecular formula of alkane – molecular formula of compound)
")
23
Example 1 index of hydrogen deficiency 12 (molecular formula of alkane – molecular formula of compound) C 7 H 14 12 (C 7 H 16 – C 7 H 14 ) = =12 (2) = 1 = Therefore, one ring or one double bond.
 C 7 H (C 7 H 16 – C 7 H 14 ) = =12 (2) = 1 = Therefore, one ring or one double bond.")
24
Example 2 C 7 H 12 12 (C 7 H 16 – C 7 H 12 ) =12 (4) = 2 = Therefore, two rings, one triple bond, two double bonds, or one double bond + one ring.
 =12 (4) = 2 = Therefore, two rings, one triple bond, two double bonds, or one double bond + one ring.")
25
Oxygen has no effect CH 3 (CH 2 ) 5 CH 2 OH (1-heptanol, C 7 H 16 O) has same number of H atoms as heptane index of hydrogen deficiency = 1 2 (C 7 H 16 – C 7 H 16 O) = 0 = 0 no rings or double bonds
 5 CH 2 OH (1-heptanol, C 7 H 16 O) has same number of H atoms as heptane index of hydrogen deficiency = 1 2 (C 7 H 16 – C 7 H 16 O) = 0 = 0 no rings or double bonds")
26
Oxygen has no effect index of hydrogen deficiency = 1 2 (C 5 H 12 – C 5 H 8 O 2 ) = 2 = 2 one ring plus one double bond CH 3 CO O Cyclopropyl acetate
 = 2 = 2 one ring plus one double bond CH 3 CO O Cyclopropyl acetate")
27
If halogen is present Treat a halogen as if it were hydrogen. C C CH 3 Cl H H C 3 H 5 Cl same index of hydrogen deficiency as for C 3 H 6

28
Rings versus Multiple Bonds Index of hydrogen deficiency tells us the sum of rings plus multiple bonds. Catalytic hydrogenation tells us how many multiple bonds there are.

29
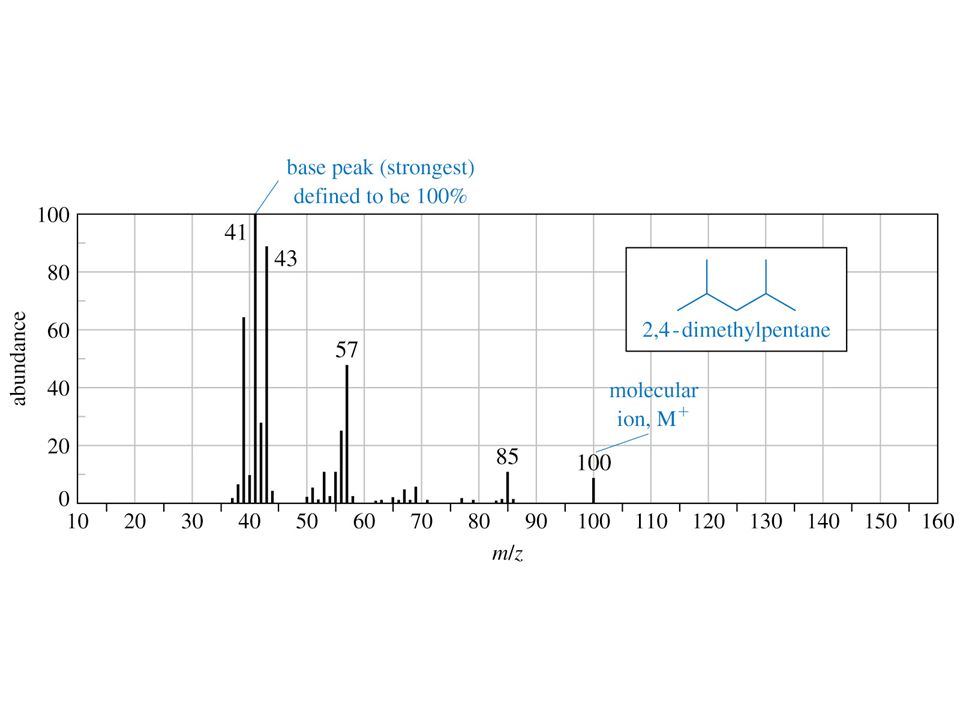
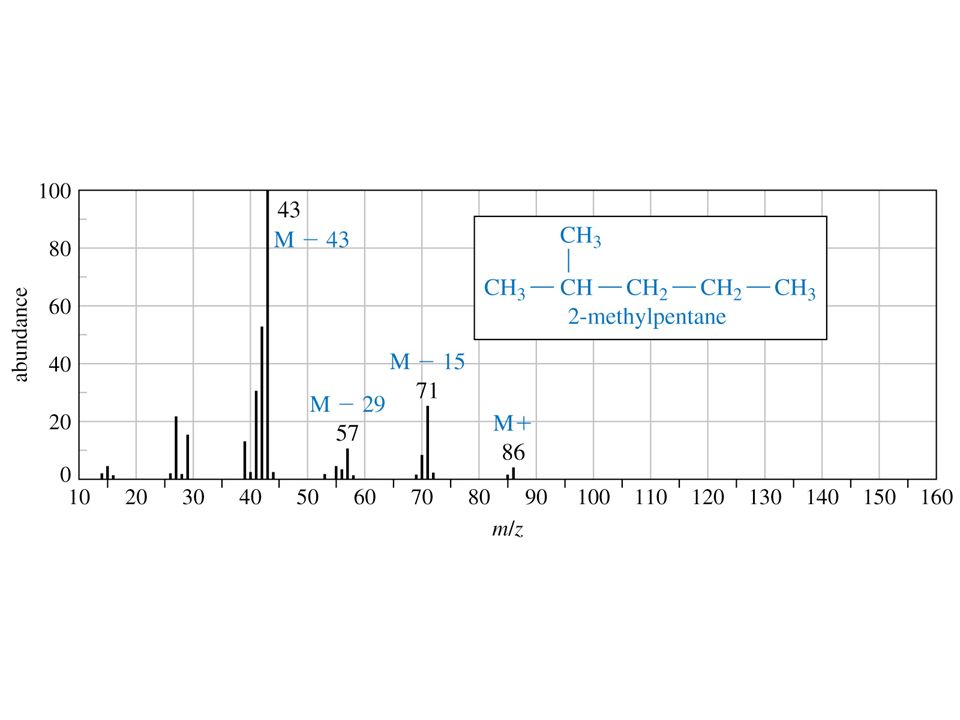
The base peak is the peak with the greatest intensity, due to its having the greatest abundance Weak bonds break in preference to strong bonds Bonds that break to form more stable fragments break in preference to those that form less stable fragments Peaks other than the molecular ion have smaller m/z values __ called fragment ion peaks __ represent positively charged fragments of the molecule

30
The base peak of 43 in the mass spectrum of pentane indicates the preference for C-2 to C-3 fragmentation To identify fragment ions in a spectrum, determine the difference between the m/z value of a given fragment ion and that of the molecular ion

31
Carbocations can undergo further fragmentation

32
2-methylbutane has the same m/z as pentane but the peak at m/z = 57 (M – 15) is more intense
 is more intense")
33
Alkanes undergo extensive fragmentation m/z Decane 142 43 57 71 85 99 CH 3 —CH 2 —CH 2 —CH 2 —CH 2 —CH 2 —CH 2 —CH 2 —CH 2 —CH 3 Relative intensity 10080 60 40 20 0 20406080100 120

36
m/z m/z = 78 10080 60 40 20 0 Relative intensity Some molecules undergo very little fragmentation Benzene is an example. The major peak corresponds to the molecular ion.

37
Propylbenzene fragments mostly at the benzylic position 20406080100 120 m/z Relative intensity 120 91 CH 2 —CH 2 CH 3 10080 60 40 20 0

38
HHH HH H HHH HH H HHH HH H all H are 1 H and all C are 12 C one C is 13 C one H is 2 H Isotopic Clusters 78 7979 93.4%6.5%0.1%

39
Isotopes in Mass Spectrometry peaks that are attributable to isotopes can help identify the compound responsible for a mass spectrum M + 2 peak: a contribution from 18 O or from two heavy isotopes in the same molecule a large M + 2 peak suggests a compound containing either chlorine or bromine: a Cl if M + 2 is 1/3 the height of M; a Br if M + 2 is the same height as M In calculating the molecular masses of molecular ions and fragments, the atom mass of a single isotope of an atom must be used

40
The Mass Spectrum of Bromopropane

41
The weakest bond is the C–Br bond The base peak is at m/z = 43 [M – 79, or (M + 2) – 81] The propyl cation has the same fragmentation pattern it exhibited when it was formed in the cleavage of pentane
![The weakest bond is the C–Br bond The base peak is at m/z = 43 [M – 79, or (M + 2) – 81] The propyl cation has the same fragmentation pattern it exhibited when it was formed in the cleavage of pentane](http://images.slideplayer.com/25/7783795/slides/slide_41.jpg "The weakest bond is the C–Br bond The base peak is at m/z = 43 [M – 79, or (M + 2) – 81] The propyl cation has the same fragmentation pattern it exhibited when it was formed in the cleavage of pentane")
42
The Mass Spectrum of 2-Chloropropane

44
The compound contains a chlorine, because M + 2 peak is 1/3 the height of the molecular ion peak The base peak at m/z = 43 results from heterolytic cleavage of the C–Cl bond The peaks at m/z = 63 and m/z = 65 have a 3:1 ratio, indicating the presence of a chlorine atom

45
cleavage results from the homolytic cleavage of a C–C bond at the carbon

48
20406080100 120 m/z10080 60 40 20 0 Relative intensity 112 114 Isotopic Clusters in Chlorobenzene visible in peaks for molecular ion 35 Cl 37 Cl

49
20406080100 120 m/z Relative intensity 77 Isotopic Clusters in Chlorobenzene no m/z 77, 79 pair; therefore ion responsible for m/z 77 peak does not contain Cl H H H H H+ 10080 60 40 20 0

50
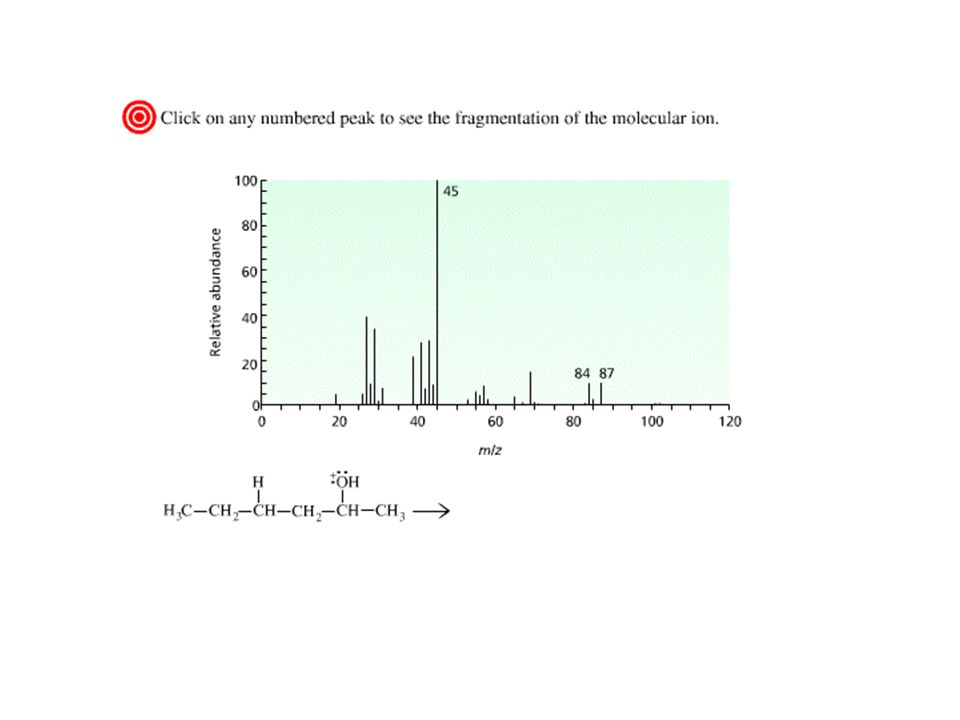
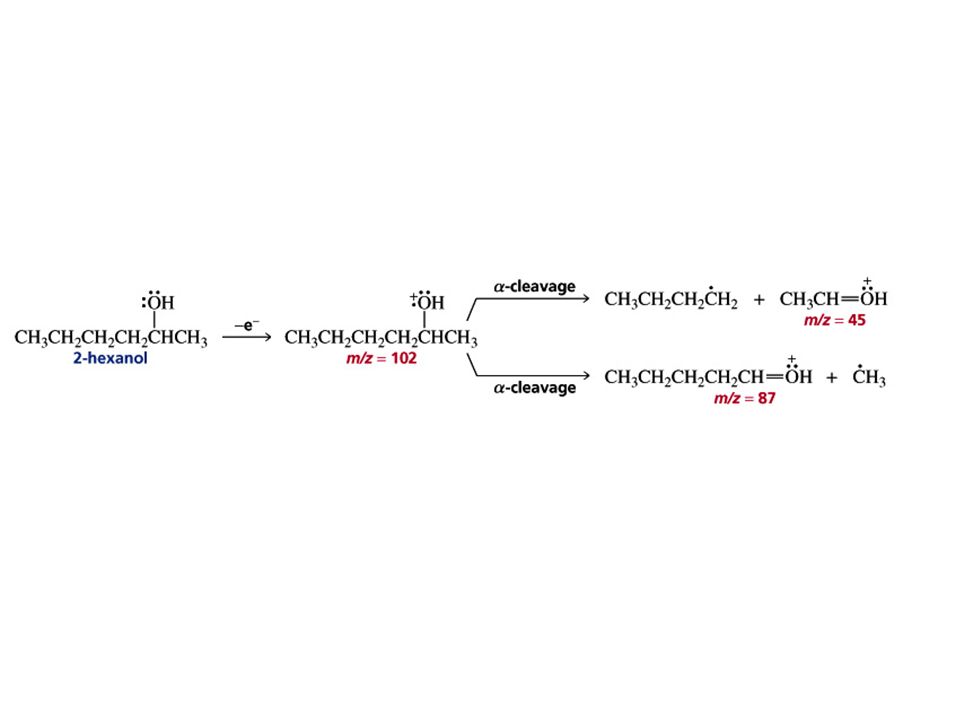
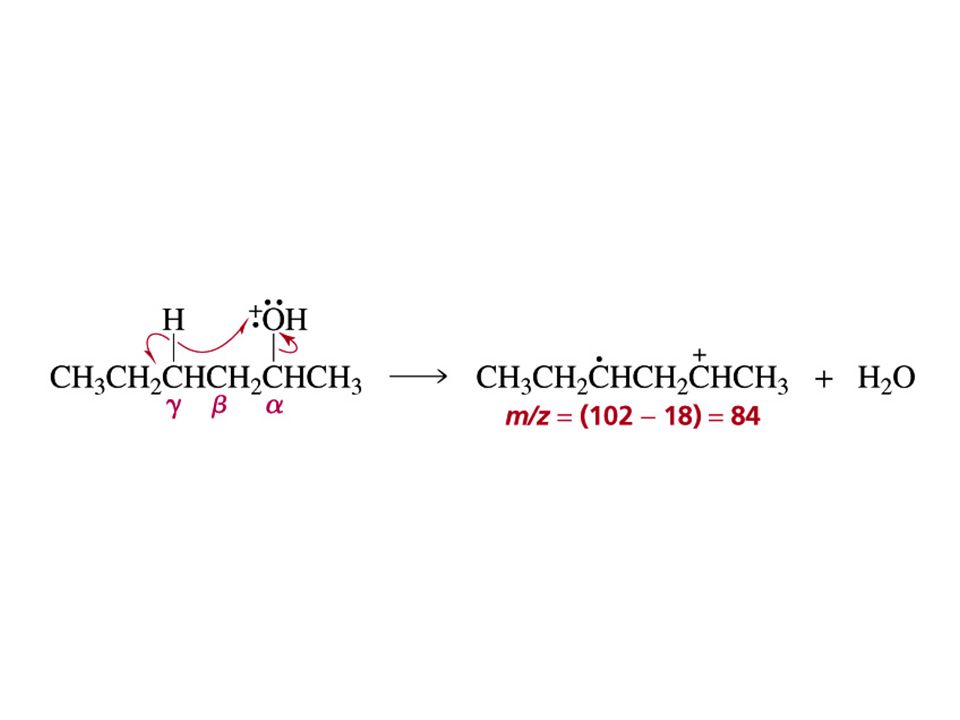
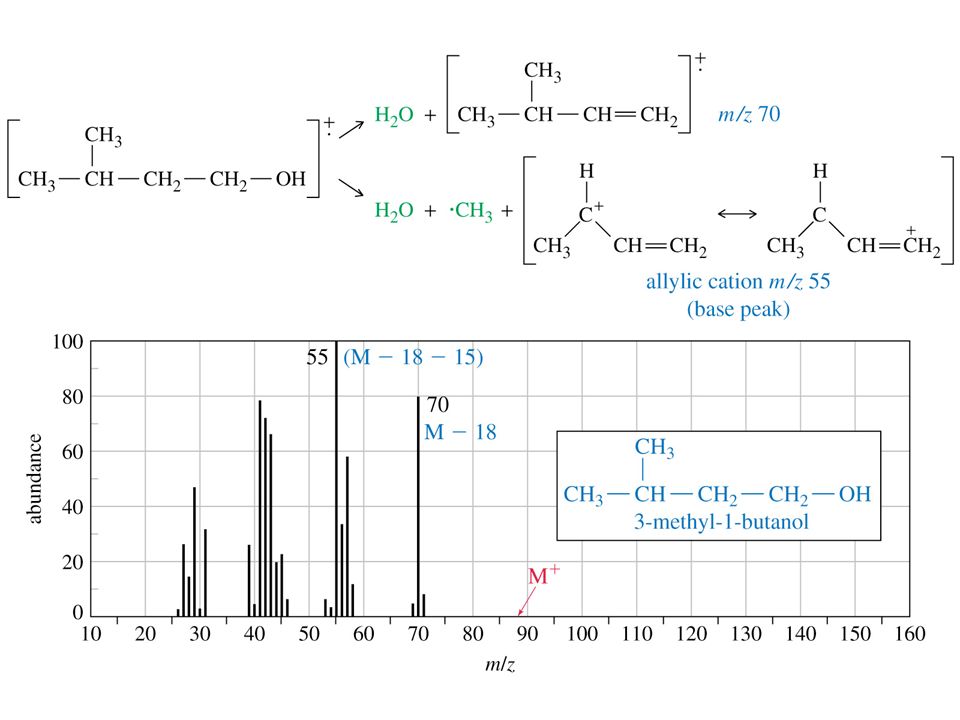
The Fragmentation of Alcohols

55
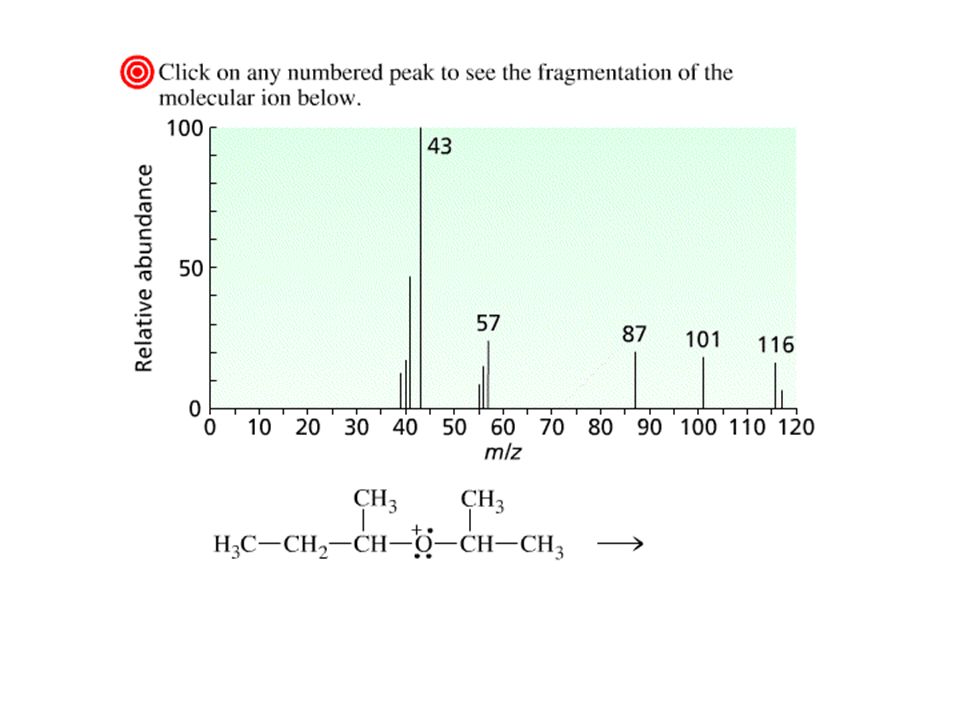
The Fragmentation Pattern of Ethers

59
Fragmentation Pattern of Ketones An intense molecular ion peak

60
McLafferty rearrangement may occur

Similar presentations


 is injected into the mass spectrometer and vaporized at elevated temperature and reduced.>")


 is not true “spectroscopy” because it does not involve the absorption of electromagnetic radiation to form an.>")
>")


>")
>")