Download presentation
Presentation is loading. Please wait.

1
Wisconsin Department of Public Instruction Addressing Disproportionality in Special Education— A Wisconsin Perspective

2
Overview Wisconsin Statewide Data Wisconsin Statewide Data Wisconsin’s Action Plan for Addressing Disproportionality Wisconsin’s Action Plan for Addressing Disproportionality Wisconsin’s Approach to Addressing Challenges: Next Steps Wisconsin’s Approach to Addressing Challenges: Next Steps

3
Wisconsin’s Demographic Profile

4
Risk Ratio Formula Risk ---A racial/ethnic group’s probability or risk of having a particular disability Risk ---A racial/ethnic group’s probability or risk of having a particular disability Risk Ratio---Compares the risk for one racial/ethnic group to the risk for all other groups Risk Ratio---Compares the risk for one racial/ethnic group to the risk for all other groups If there were no differences between racial/ethnic groups, the risk ratio would be 1.0 (everybody would have equal risk) If there were no differences between racial/ethnic groups, the risk ratio would be 1.0 (everybody would have equal risk)
 If there were no differences between racial/ethnic groups, the risk ratio would be 1.0 (everybody would have equal risk)")
5
Statewide data for all disability groups

6
Statewide Data: EBD

7
Statewide Data: Cognitive Disability

8
Statewide Data: OHI

9
Statewide Data: Educational Environment

10
Section II: Wisconsin’s Action Plan For Addressing Disproportionality

11
Workgroup Members Deborah Bilzing Deborah Bilzing Janice Duff Janice Duff Nancy Fuhrman Nancy Fuhrman Debbie Gaffney-Dilley Debbie Gaffney-Dilley Donna Hart-Tervalon Donna Hart-Tervalon Anita Heisig Anita Heisig John Humphries Courtney Reed Jenkins Jack Marker Brent Odell Patricia Williams

12
Goals of Workgroup Improve the quality of education statewide for all students, including students with disabilities, students of color and students living in poverty Improve the quality of education statewide for all students, including students with disabilities, students of color and students living in poverty Increase our internal capacity to address statewide concerns relative to the disproportionate number of students of color referred and placed in special education Increase our internal capacity to address statewide concerns relative to the disproportionate number of students of color referred and placed in special education Address disproportionality as an educational issue, not just as a special education issue Address disproportionality as an educational issue, not just as a special education issue

13
Workgroup Objectives Determine the appropriateness of referrals of students of color Determine the appropriateness of referrals of students of color Determine the appropriateness of placements of students of color Determine the appropriateness of placements of students of color Determine the educational benefit students are receiving as a result of special education and related services Determine the educational benefit students are receiving as a result of special education and related services

14
Activities of Workgroup Developed an action plan Developed an action plan Developed and piloted a Disproportionality Focused Monitoring Model Developed and piloted a Disproportionality Focused Monitoring Model Contracted with the University of Wisconsin—Madison to review and summarize research Contracted with the University of Wisconsin—Madison to review and summarize research Employed a summer intern to develop a resource library Employed a summer intern to develop a resource library

15
Workgroup Activities Continued Attended conferences, workshops, teleconferences related to addressing disproportionality Attended conferences, workshops, teleconferences related to addressing disproportionality Established formal partnership with NCSEAM Established formal partnership with NCSEAM Established formal partnership with NCCRESt Established formal partnership with NCCRESt Contracted with Daniel Losen, Legal and Policy Senior Associate, Harvard Civil Rights Project Contracted with Daniel Losen, Legal and Policy Senior Associate, Harvard Civil Rights Project Developed a relationship with NCRRC (North Central Regional Resource Center Developed a relationship with NCRRC (North Central Regional Resource Center

16
Planned Activities of Workgroup Revising action plan Revising action plan Expanding workgroup Expanding workgroup Employing an intern to develop a website Employing an intern to develop a website Developing a Summer Institute: Addressing Disproportionality Developing a Summer Institute: Addressing Disproportionality Training on disproportionality data analysis Reviewing and analyzing state and district policies and practices Continuing the development of the focused monitoring model

17
Section III Wisconsin’s Approach to Addressing Challenges Next Steps

18
Significant Challenges in Addressing Disproportionality Understanding and addressing the new provisions in IDEA 2004 Understanding and addressing the new provisions in IDEA 2004 Refining criteria for determining significant disproportionality Refining criteria for determining significant disproportionality Identifying rigorous, measurable targets Identifying rigorous, measurable targets Continuing development of focused monitoring process Continuing development of focused monitoring process Developing a process and technical assistance plan for interpreting district-level disproportionality data Developing a process and technical assistance plan for interpreting district-level disproportionality data

19
Racial Inequity in Special Education By Daniel J. Losen ©

20
Part B IDEA (ages 3-5 and 6-21) Pub. L. 108-446; 20 U.S.C. Sec. 1400 et. seq. Section 612 NEW: (a)(24) state plan has to include policies and procedures “designed to prevent the inappropriate overidentification or disproportionality…”
(24) state plan has to include policies and procedures designed to prevent the inappropriate overidentification or disproportionality… .")
21
Evaluation, Eligibility Determinations, IEPs Placements and Bias: 614 1.Evaluation procedures (614)(b)(2)(A) The district shall use a variety of assessment tools… 2.Each district shall ensure that assessments and other evaluation tools …(3) are selected and administered so as not to be discriminatory on a racial or cultural basis: The IDEA references unintended bias here. 3.What IDEA is calling for is for states to look at the racially disparate effects of tool selection and administration.

22
Beyond Biased Tests Tools themselves need not be biased to be discriminatory. Look at what measures are used, and not used, and the weight attributed to scores. Non-compliance can result if the administration or evaluation procedure has a discriminatory effect.

23
614: Exposure to Poor Instruction or LEP (b)(5) Rule out, as the determinant factor: The need for services that arise from bad instruction in: –Reading –or Math –or because of LEP status. Was in 1997 Act, but can expect renewed attention to this provision.

24
Considerations could include… Is the referring teacher highly qualified? Experienced with diverse learners? Adequately trained to teach reading and math? Having classroom management problems?

25
LRE and Minority Exclusion Right to special education and related services in the least restrictive environment to the maximum extent appropriate. Calls for an individualized determination – the category of disability should not drive the placement. Increased risk for being labeled MR or ED should not mean greater exclusion from the regular education setting.

26
Revised 618 New Data (618)(a) Racial and ethnic disparities in the incidence and duration of discipline including suspensions of one day or more. Gender and English Language Learners added for collection and reporting. Annual public reporting of data at the state level.

27
Revised 618 (d) New Requirements (618)(d): analyze district level data for significant disparities by race and ethnicity in identification, placement, and incidence and duration of discipline. Intervention required where problems are evident (similar to 1997 Act language). Public reporting of interventions at the district level. Finding of significant disproportionality in identification or placement triggers 15% spending (the maximum) on early intervention services under 613(f). The funds are triggered by significant disproportionality, independent of a finding of non-compliance.
. Public reporting of interventions at the district level. Finding of significant disproportionality in identification or placement triggers 15% spending (the maximum) on early intervention services under 613(f). The funds are triggered by significant disproportionality, independent of a finding of non-compliance..")
28
613 (f) Early Intervention Services Up to 15% of Part B funds on students who are at risk but not deemed eligible under IDEA 613(f) spending for regular education triggered by significant disproportionality: Further evidence that “inappropriate” encompasses far more than a specific finding of non-compliance with IDEA.
 Early Intervention Services Up to 15% of Part B funds on students who are at risk but not deemed eligible under IDEA 613(f) spending for regular education triggered by significant disproportionality: Further evidence that inappropriate encompasses far more than a specific finding of non-compliance with IDEA.")
29
Monitoring and Enforcement Priority Area in New Law 612 and 616 (July 2005) 616(a)(1)(C): The Secretary monitors the states and ensures that the States monitor the districts. 616: (a)(3) Monitoring Priorities: “Disproportionate representation of racial and ethnic groups in special education and related services, to the extent the representation is the result of inappropriate identification - in identification” is one of three priority areas for the U.S. Secretary of Education. States must develop a plan of district oversight and action with rigorous measurement and set targets Required state intervention where inappropriate identification is a recurring problem. 612: State plan covers all of 618(d) – must show that state has policies and procedures in place to address disproportionality.
(3) Monitoring Priorities: Disproportionate representation of racial and ethnic groups in special education and related services, to the extent the representation is the result of inappropriate identification - in identification is one of three priority areas for the U.S. Secretary of Education. States must develop a plan of district oversight and action with rigorous measurement and set targets Required state intervention where inappropriate identification is a recurring problem. 612: State plan covers all of 618(d) – must show that state has policies and procedures in place to address disproportionality..")
30
What Does The New IDEA Accomplish? The investigation isn’t limited to the question of compliance with IDEA 616: Targets racial/ethnic disparities result of inappropriate identification. Permits state to address unconscious bias, which is certainly “inappropriate” under IDEA. Many other practices and deficiencies in regular education can result in “inappropriate identification.”

31
What does Idea Accomplish… State Plan: 612 (a)(24) - has to include policies and procedures “designed to prevent the inappropriate overidentification or disproportionality…” References 618 (d) (not a subpart) 616 should mean developing rigorous targets with measurable benchmarks to address the problem…. Secretary’s monitoring of states includes how well are states monitoring the districts in the priority areas.

32
Legal and Policy Challenges Problem with focus on special education compliance when changing regular education may be the solution…. Section 613(f) – and limited resources How do limits on numeric racial goals – square with NCLB? With desegregation requirements? With remediation of racial bias?
 – and limited resources How do limits on numeric racial goals – square with NCLB. With desegregation requirements. With remediation of racial bias .")
33
What Should States Do? Transparency is the best policy: Report publicly on the State and Districts with regard to each area of data collection in section 618. Significant racial or ethnic disparity in identification or placement, including disciplinary placements, triggers 15% Early Intervening Services expenditures. Look for inappropriate identification due to factors in regular education that are not specifically delineated in IDEA, including unconscious bias.

34
Non Compliance and Other Factors Discriminatory effect of method or administration of evaluation. Inappropriate identification due to shortcomings of regular education classroom, including instruction in reading and math, and poor classroom management. Consideration of LEP status Examination of subtle and unconscious forms of bias Inadequate resources, overcrowded classrooms, etc.

35
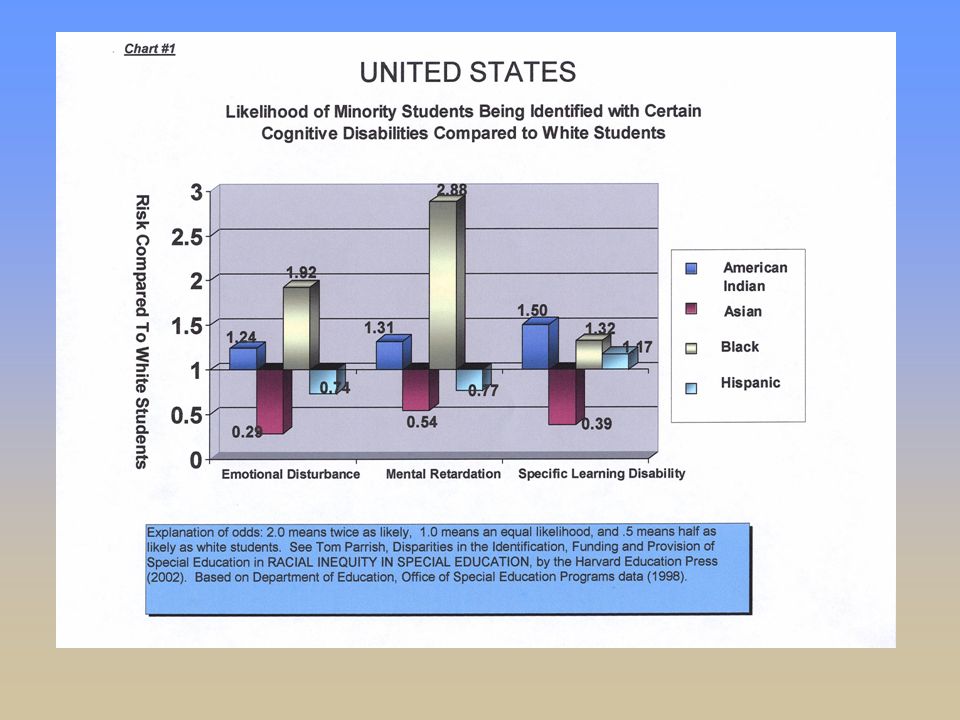
Risk Ratios First calculate the risk for each racial group of having a particular disability. For example, “What percent of all the enrolled Black students have mental retardation?” Compare to another racial group: 1.0 means the same risk 2.0 means twice as likely.5 means half as likely

37
Subjectivity of Evaluation and Identification Myth of objectivity – who is being referred? Most referred students are identified as eligible Controversy due to misdiagnosis: 10 out of 55 LD misdiagnosed – and that was the most favorable study Who to test, what test to use, how to weigh the results, how to interpret the score IDEA provision bars discriminatory methods – is there much training in culturally sensitive measures?

38
Overidentification and IQ Construction of difference: the cut score: Does having an IQ cut score of 85 make sense? Risk of misdiagnosis is high. The IQ/ achievement differential – problems: –IQ is just another achievement test –IQ measures poverty and other environmental factors –IQ is fungible

39
IEP Process and Politics: Qualitative Research Indicates Parents voices are often ignored – especially poor and minority parents High degree of deference to the “experts” and their tests so that the conclusions of specialists are rarely doubted by parents or educators. Teachers are often reluctant to contradict team members (especially superiors). Behavioral issues in the general classroom may drive referral rates higher.
. Behavioral issues in the general classroom may drive referral rates higher..")
40
Are Significant Racial Disparities Explained Away by Poverty? Regression analysis says no. Blacks and Latinos have divergent patterns for MR, ED and SLD identification, yet similar poverty and reading achievement profiles. Gender differences for risk for MR among Blacks are far greater than among Whites

41
States With Extraordinarily High Percentages of Students with Mental Retardation (MR) are Mostly in the South OSEP 2000-2001 DATA available at www.ideadata.org. The states are: Alabama, Arkansas, Florida, Georgia, Indiana, Iowa, Kentucky, Montana, Nebraska, North Carolina, Ohio, South Carolina, West Virginia (8 of 13 are southern). Iowa does not use the IQ discrepancy test.
. Iowa does not use the IQ discrepancy test..")
42
Black Males In the most profound example, contrary to expectations, as factors associated with wealth and better schooling increase, Black males are at greater risk of being disproportionately labeled “mentally retarded.” (See Oswald, Coutinho and Best, “Community and School Predictors of Over Representation of Minority Children in Special Education” in Racial Inequity in Special Education)
")
43
Black Males In the most profound example, contrary to expectations, as factors associated with wealth and better schooling increase, Black males are at greater risk of being disproportionately labeled “mentally retarded.” (See Oswald, Coutinho and Best, “Community and School Predictors of Over Representation of Minority Children in Special Education” in Racial Inequity in Special Education)
")
44
Risk Ratios of “Mental Retardation” and “Hard” Disability Categories for Blacks Compared to Whites Data from Tom Parrish - 1998/1999 school year - OSEP data.

45
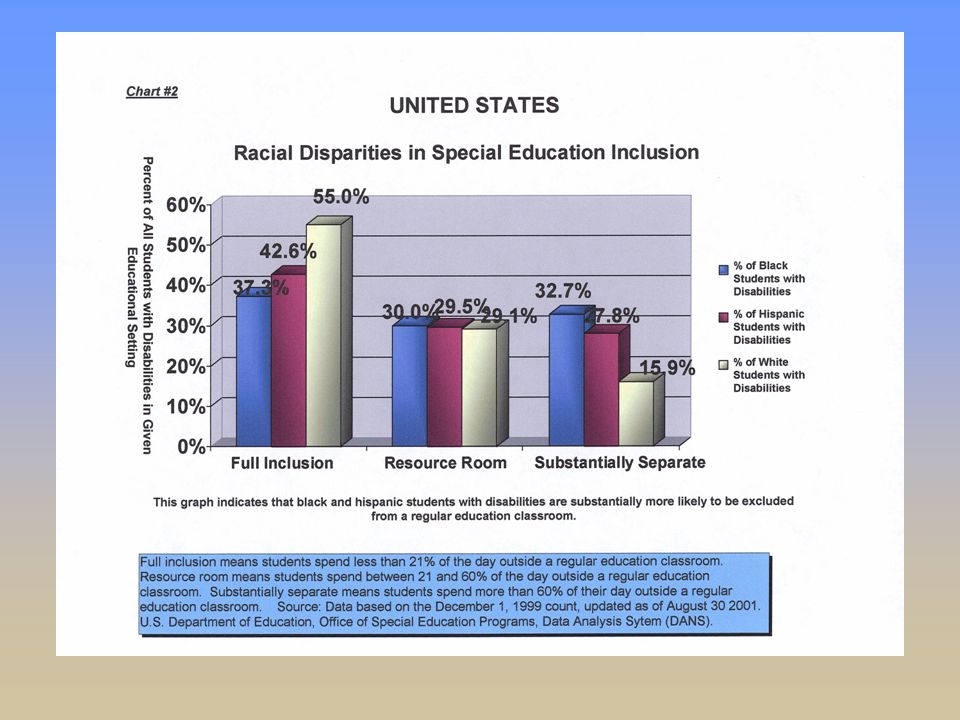
Restriction Risk by Disability Category 80-90 percent of students with MR, and over 70 percent with ED are educated in resource rooms or substantially separate settings. Approximately 56 percent of students with specific learning disabilities are in full inclusion placements (pulled out less than 21 percent of the school day) Overrepresentation for ED and MR significantly increases the risk for blacks of being educated in a substantially separate program
 Overrepresentation for ED and MR significantly increases the risk for blacks of being educated in a substantially separate program.")
47
Similarly Situated? Few states report data on racial disparities for inclusion within a disability category. Can the greater risk for segregation be explained by the greater risk for MR and SED alone? Data from CT suggests the answer is no.

50
The Civil Rights Project and The National Research Council Say… School policies and decisions are contributing factors - Accountability efforts should ensure that minority students are making meaningful academic progress, while reducing racial disparities in special education. Inadequate teacher training and support for classroom and behavior management likely contributes to the problem of racial disproportionality.

51
Areas of Agreement Continued… To focus on reducing numeric disparities alone, without ensuring that minority students are making meaningful academic progress, is ill advised.

52
What Should the Remedy Look Like? Change the numbers: Reduce the differential? The risk? The risk ratio? When are racial goals be permissible? Desirable? Should the goals be driven by the context? Early Intervention Services? Improve the quality of regular education? Assuming institutional racism contributes – how can you change that?

Similar presentations


 Stakeholder Input November 6, 2014.>")


 April.>")


