Download presentation
Presentation is loading. Please wait.

1
Using Health Care Indicators to Improve Individual and Systemic Health Care Outcomes National Core Indicators (NCI) Cross-State Data & Additional Health Indicators from North Carolina and West Virginia Sarah Taub, HSRI NASDDDS Annual Meeting November 18, 2004
 Cross-State Data & Additional Health Indicators from North Carolina and West Virginia Sarah Taub, HSRI NASDDDS Annual Meeting November 18, 2004")
2
Health & DD Research suggests prevalence of health conditions is the same or higher in the DD population Communication difficulties, behavioral issues and functional limitations present challenges to healthcare access & delivery DD health tends to be overlooked by public health systems Healthcare access is a particular concern for people living in community settings

3
NCI Health Indicators National Core Indicators are used for Quality Management in 22+ DD service delivery systems Sponsored by NASDDDS, coordinated nationally by Human Services Research Institute (HSRI) Standard Consumer Survey instrument, interviewer training, and methodology Three sources of information: self-report, proxy (informant), and case manager (file) Two states – WV and NC – have augmented survey with additional interviews on health status and access 2003-2004 Total sample: 9,192 individuals with cognitive/developmental disabilities across 17 states
 Standard Consumer Survey instrument, interviewer training, and methodology Three sources of information: self-report, proxy (informant), and case manager (file) Two states – WV and NC – have augmented survey with additional interviews on health status and access Total sample: 9,192 individuals with cognitive/developmental disabilities across 17 states")
4
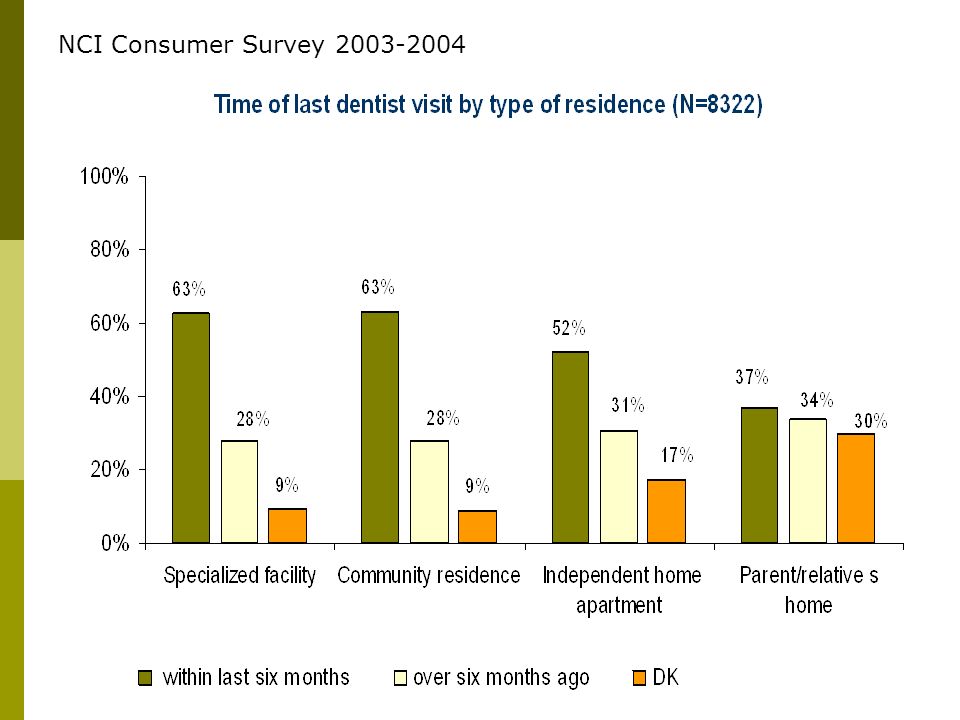
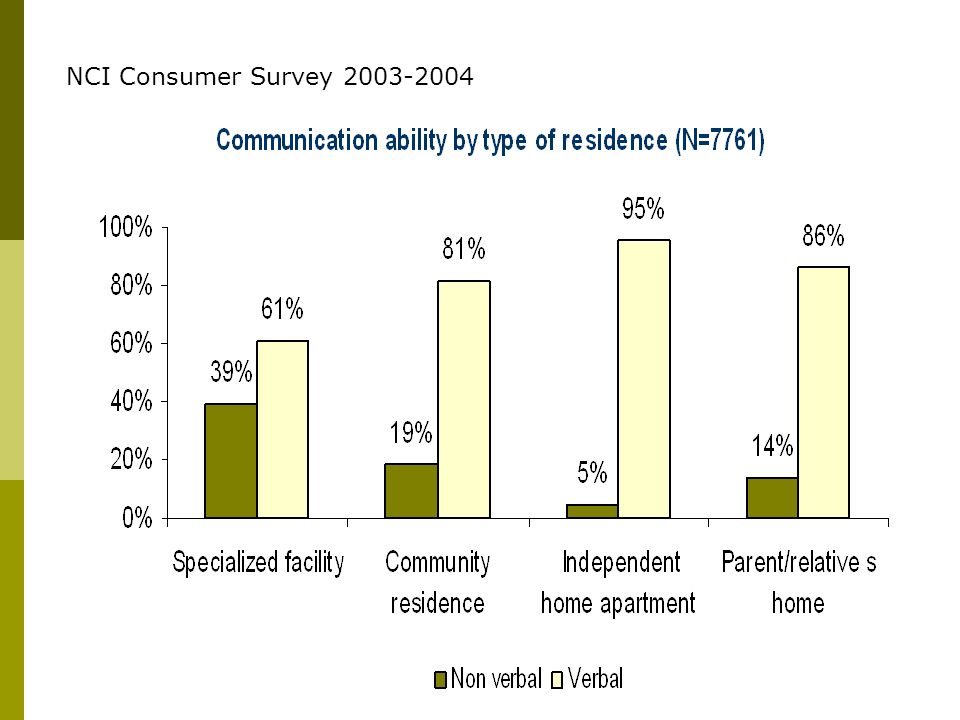
NCI Consumer Survey 2003-2004

9
Comparison with US Population Source of US data: National Health Interview Survey (2002)
")
10
Comparison with US Population Source of US data: Joint Canada/United States Survey of Health (2002-2003)
")
11
Comparison with US population Source of US data: Behavioral Risk Factor Surveillance System survey (2002)
")
12
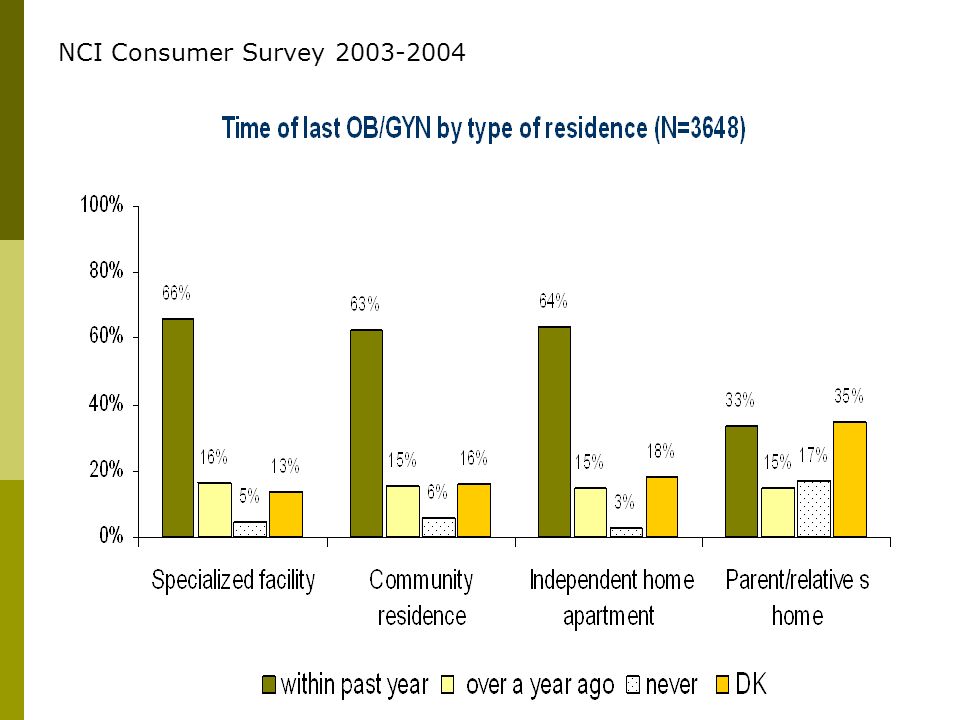
NCI Consumer Survey 2003-2004

15
Use of NCI Data to Improve Health Massachusetts DMR Health Promotion & Coordination Initiative Tools to measure health status, manage risk Enable DSPs to be better health advocates Rhode Island Quality Consortium Health and Safety committee reviews data and makes recommendations to state Results used in staff training and development Arizona focused on improving women’s health results rate of GYN exams has increased from 70%

16
For More Information NCI Website: www.hsri.org/nciwww.hsri.org/nci Email: staub@hsri.orgstaub@hsri.org Related articles published in Public Health Reports July-August 2004 (special issue on MR population health issues) Freedman & Chassler Havercamp et al.
 Freedman & Chassler Havercamp et al.")
17
Study of Health Indicators in West Virginia Madeleine Kimmich Human Services Research Institute 2004

18
Goals of this Study 1.To assess the health care needs of West Virginians with developmental disabilities and the extent to which currently available medical and health-related services meet those needs. 2.To compare the availability of health care services for people with developmental disabilities to the larger population. 3.To expand the utility of the National Core Indicators (NCI) project for policy making in West Virginia and nationally.
 project for policy making in West Virginia and nationally..")
19
Health Interview Guide NCI interviewers were trained to administer the health interview The interview was conducted in conjunction with the NCI Consumer Survey The interview contained questions relating to health care access, quality of care, complaints and emergency services

20
Study Sample Completed NCI surveys=8724 (2002) Completed WV NCI surveys=232 Number of counties represented=45 Completed health interviews=110 Number of counties represented=42
 Completed WV NCI surveys=232 Number of counties represented=45 Completed health interviews=110 Number of counties represented=42")
21
Topics Examined Healthy Lifestyles Health Care Access Quality of Care Complaints Provider and Case Manager Surveys

22
Healthy Lifestyles 5 questions added to West Virginia NCI Consumer Survey Exercise, tobacco use and weight issues Contrasted with similar national figures for the entire U.S. population

23
Percent of Persons Who Have Not Participated in Physical Activity in the Past Month GroupPercent Persons with Developmental Disabilities in West Virginia 34% Total West Virginia Population 29% Total US Population 24% Exercise/Physical Activity

24
Percent of Persons Who Smoke GroupPercent Persons with Developmental Disabilities in West Virginia 12%* Total West Virginia Population 28% Total US Population 23% Tobacco Use *This included persons who smoke or chew tobacco

25
Results from Provider and Case Manager Surveys Similar results on two key measures: Dental care, eye care and therapy identified as the most difficult services to access Geography and unwillingness to serve people with Medicaid identified as the most important factors limiting health care choice

26
Conclusions: Good access to basic medical care Insufficient awareness of dental needs Poor access to OB/GYN services Recommendations: Continue to track health access issues Educate consumers regarding health service needs

27
Study of Health Indicators in North Carolina Susan M. Havercamp, Ph.D. University of North Carolina Chapel Hill, NC 27599-7255

28
Health Outcomes for 3 Groups: Adults with Developmental Disabilities in community 2000-2001 NCNCI Other Disabilities 2001 BRFSS No Disability 2001 BRFSS

29
Health Risk Behaviors

30
Overall Health Status

31
Chronic Health Conditions

32
Conclusions Adults with DD have the same or greater health risks as general population They were more likely to report a sedentary lifestyle with more than ⅓ reporting no exercise in past month Alarmingly high rate of inadequate emotional support (relative risk 7.9) and mental health problems (35%)
 and mental health problems (35%)")
33
Adults with DD have the same or greater risk of chronic health conditions as general population Access to health care services is a challenge in the community Dental services and reproductive health services for women are particularly neglected Behavioral interventions could improve the health status of adults with DD People living with their families have lower utilization rates of basic health care Conclusions

Similar presentations


 Health Survey.>")