Download presentation
Presentation is loading. Please wait.

1
PROJECT ON STATISTICS Srikanth A Srikanth A

2
STATISTICS PROJECT REPORT STATISTICS PROJECT REPORT Goal The goal of doing this project was to empower ourselves and to get familiarized with the various statistical techniques used in data analysis. Thereby helping us to do various computations on a given set of data and to reach on various meaningful conclusions, so as to show an understanding in the basic concepts of statistics. In this project we have made an attempt to understand how different cars in the global market produced by various different auto makers vary from each other with respect to their engine capacity, horse power, mileage, transmission etc.

3
Data collection The database used for this project contains data of forty three cars. Totally we considered seven attributes for the forty three cars. All the data for the attributes has been collected from the net using three portals they are, www.automotoportal.com www.carfolio.com www.autocarindia.com While collecting the information regarding the cars, in order to get a diversified data it was kept in mind to collect data of cars manufactured by different manufacturers. Hence our data set contains cars brought out by eleven major auto manufactures through out the world. And from each manufacturer we took four sample cars. The manufacturers we considered were BMW VOLVO GENERAL MOTORS- CHEVEROLET MERCEDES NISSAN HONDA SUZUKI TOYOTA HYUNDAI FORD LEXUS

4
Out of the seven attributes chosen- four was quantitative attributes and 3 were qualitative attributes. Quantitave Attributes Chosen. Quantitave Attributes Chosen. 1. Engine Capacity (cc) 2. Brake Horse power (BHP) 3. Mileage (kilo meter/liter of fuel) 4. Top Speed (Kilometer/hour) Qualitative Attributes Chosen. Qualitative Attributes Chosen. 1.Gear Transmission (Automatic/ Manual/Both) 2. Segment (Sedan/SUV/MUV) 3. Fuel Type (Petrol/Diesel/Both )
 2. Brake Horse power (BHP) 3. Mileage (kilo meter/liter of fuel) 4. Top Speed (Kilometer/hour) Qualitative Attributes Chosen. Qualitative Attributes Chosen. 1.Gear Transmission (Automatic/ Manual/Both) 2. Segment (Sedan/SUV/MUV) 3. Fuel Type (Petrol/Diesel/Both ).")
5
Explanation Regarding The Attributes Chosen Engine Cylinder Capacity Engine cylinder is the central working part of an automobile engine, the space in which a piston travels. The capacity or the entire volume of the cylinder is given by the engine cylinder capacity. It’s measured in terms of liters or cubic capacity (cc). Here in this data set the cylinder capacity is expressed in terms of cc. Brake Horse Power Is the measure of an engine's horsepower without the loss in power caused by the gearbox and other auxiliary components. Thus the prefix "brake" refers to where the power is measured: at the engine's output shaft. The actual horsepower delivered to the driving wheels is less.
. Here in this data set the cylinder capacity is expressed in terms of cc. Brake Horse Power Is the measure of an engine s horsepower without the loss in power caused by the gearbox and other auxiliary components. Thus the prefix brake refers to where the power is measured: at the engine s output shaft. The actual horsepower delivered to the driving wheels is less..")
6
contd: contd: Mileage Mileage Is the amount of fuel required to move the automobile over a given distance. The two most common ways to measure automobile fuel economy are: The amount of fuel used per unit distance; most commonly, liters per 100 kilometers (L/(100 km)). The amount of fuel used per unit distance; most commonly, liters per 100 kilometers (L/(100 km)). Lower values mean better fuel economy: you use less fuel to travel the same distance. Lower values mean better fuel economy: you use less fuel to travel the same distance. The distance traveled per unit of fuel used; The distance traveled per unit of fuel used; most commonly, kilometers per liter (km/L). Higher values mean better fuel economy: most commonly, kilometers per liter (km/L). Higher values mean better fuel economy: you can travel farther for the same amount of fuel. you can travel farther for the same amount of fuel. Here in our data set the mileage is expressed in terms of kilometer traveled per unit liter of the fuel used. Top Speed Top Speed Is the measure of the speed at which a particular vehicle can travel. It can be measured in terms of the kilometer/ Miles covered per hour by traveling at that particular speed. Her in our data set we measure the top speed at kilometers traveled per hour.
). The amount of fuel used per unit distance; most commonly, liters per 100 kilometers (L/(100 km)). Lower values mean better fuel economy: you use less fuel to travel the same distance. Lower values mean better fuel economy: you use less fuel to travel the same distance. The distance traveled per unit of fuel used; The distance traveled per unit of fuel used; most commonly, kilometers per liter (km/L). Higher values mean better fuel economy: most commonly, kilometers per liter (km/L). Higher values mean better fuel economy: you can travel farther for the same amount of fuel. you can travel farther for the same amount of fuel. Here in our data set the mileage is expressed in terms of kilometer traveled per unit liter of the fuel used. Top Speed Top Speed Is the measure of the speed at which a particular vehicle can travel. It can be measured in terms of the kilometer/ Miles covered per hour by traveling at that particular speed. Her in our data set we measure the top speed at kilometers traveled per hour..")
7
Gear Transmission Gear Transmission In order for the engine to transmit the power produced by it to the tyres, gear transmissions provide a speed-power conversion from a higher speed motor to a slower but more forceful output. In vehicles the gear transmission can be done manually by the driver, Or automatically by using modern electronic chip technology. Both these technologies are available n vehicles and are made available to the customers on their request. Segment Segment Cars are basically classified into three depending on their usefulness They are 1. SUV- Sports Utility Vehicles 2. MUV- Multiple Utility Vehicles 3. SEDANS- Normal sized cars used basically to travel on normal terrains Fuel Type Fuel Type Automobiles need fuel so as to combust it and derive power from it so that it can move.Automobiles uses mainly Petrol or Diesel as their fuel. And each car is available in various variants depending upon the fuel type used by it. For a particular type of car there might be two variants available, one which use petrol and other which uses diesel while some cars will be available in one form only, with either petrol or diesel

8
ORGANIZED DATA Company/ Car Name Engine Capacity Horse Power Mileage Top Speed TransmissionSegment Fuel Type BMW 1. BMW 3 Series 300023010.2236BothSEDANPetrol 2. BMW 5 Series 480036013.1250BothSEDANPetrol 3. BMW 7 Series 600043813.8250AutomaticSEDANpetrol 4. BMW X5 4.8i 480035513.1246AutomaticSUVPetrol Volvo 1. Volvo V50 T5 25002189.2240AutomaticMUVPetrol 2. Volvo XC70 250020811.2230BothSUVBoth 3. Volvo S40 T5 25002189.8240ManualSEDANpetrol 4. Volvo XC90 440031113.8210AutomaticSUVBoth Chevrolet 1. Aveo 14009410170ManualSEDANPetrol 2. Aveo U-VA 12007612140ManualSEDANPetrol 3. Tavera 25008014.3160ManualMUVBoth 4. Optra 16001049165ManualSEDANBoth Mercedes Mercedes Benz E 350026812.4236AutomaticSEDANDiesel Mercedes Benz SL Mercedes Benz SL500030214.7240AutomaticSEDANPetrol Mercedes Benz E 500030214.7240AutomaticWAGONPetrol Mercedes Benz SLK 550035515246AutomaticSEDANPetrol

9
Nissan Nissan Xterra SE 400026114.7230AutomaticSUVPetrol Nissan Sentra 2.0 20001408.4140ManualSUVBoth Nissan Quest 3.5 350023513.1220AutomaticSEDANBoth Nissan Pathfinder 400026614.7230AutomaticMUVBoth Honda Honda Civic Si 200019710.2160ManualSEDANPetrol Honda CR-V 240016610.2180AutomaticSUVPetrol Honda Element LX 240016611.2180ManualSUVDiesel Honda Pilot EX 350024413.8200AutomaticMUVPetrol Suzuki Suzuki SX4 200014310.2160manualSUVPetrol Suzuki XL7 360025213.8220automaticSUVPetrol Suzuki Aerio 23001559.4150manualSEDANPetrol Suzuki Grand Vitara 270018512.4200automaticSEDANPetrol

10
Toyota Toyota Highlander 330021512.4200AutomaticSUVPetrol Toyota Camry 24001589.8160ManualSEDANDiesel Toyota Corolla 18001267.4140ManualSEDANPetrol Toyota Land Cruiser 470027518.1300AutomaticSUVPetrol Hyundai Hyundai Accent 13991107.4177ManualSEDANBoth Hyundai Elantra 15991388.4182ManualSEDANBoth Hyundai Sonata 235923411.8203ManualSEDANBoth Hyundai Sante Fe 199124212.4166ManualSEDANBoth Ford Ford Fiesta 129716010.2160ManualSEDANBoth Ford Mustang 460130013.8230AutomaticSEDANBoth Ford Fusion 226116010.2180ManualSUVBoth Lexus Lexus IS 350 345630611.2229AutomaticSEDANPetrol Lexus LS 430 429328812.4211AutomaticSUVPetrol Lexus ES 330 331421811.2230AutomaticSEDANPetrol Lexus SC 430 429328812.4250AutomaticSEDANPetrol

11
DATA ANALYSIS *Classes in 100's MidpointFrequency Cumulative freq <120060000 1200-1800150044 1800-24002100711 2400-300027001122 3000-36003300224 3600-42003900630 4200-48004500535 4800-54005100641 5400-60005700142 6000-66006300143 43 The above given table represents the frequency distribution of Engine Capacity measured in cubic capacity. Here the classes are chosen with class width of 600 units. With the first class starting from 0 to 1200 and going up to 6600 units The frequency distributions of the cars are done in respect to the above taken classes. Frequency Distribution of engine capacity

12
Measures of Central tendencies Mean3383.721 Median2972.727 Mode2584.615 Standard Deviation 859.2587 Mean = Σfx/Σf, where f is the frequency and x is the midpoint of the class intervals. where: L = lower limit of the interval containing the median I = width of the interval containing the median N = total number of respondents F = cumulative frequency corresponding to the lower limit f = number of cases in the interval containing the median Mode = Lmo +(d1/(d1+d2))*w Where: LmoLower limit of the modal class d1frequency of the modal class minus the frequency of the class directly below it d2frequency of the modal class minus the frequency of the class directly above it wwidth of the modal class interval
)*w Where: LmoLower limit of the modal class d1frequency of the modal class minus the frequency of the class directly below it d2frequency of the modal class minus the frequency of the class directly above it wwidth of the modal class interval.")
13
Histogram From the histogram we can infer that the maximum number of cars in the data collected belong to the 4 th class i.e. with an engine capacity ranging between 2400 cc to 3000cc

14
The frequency polygon constructed helps us to sketch the distribution of the engine capacities of the cars much more clearly.

15
The ogive shown is constructed using the cumulative frequency. Here we are showing a less than ogive curve.If we take a point on the curve and connect it to the x- axis and then to the corresponding point on the y- axis. It helps us to infer the total number of cars that would lie below the corresponding class of engine capacity given in the x-axis.

16
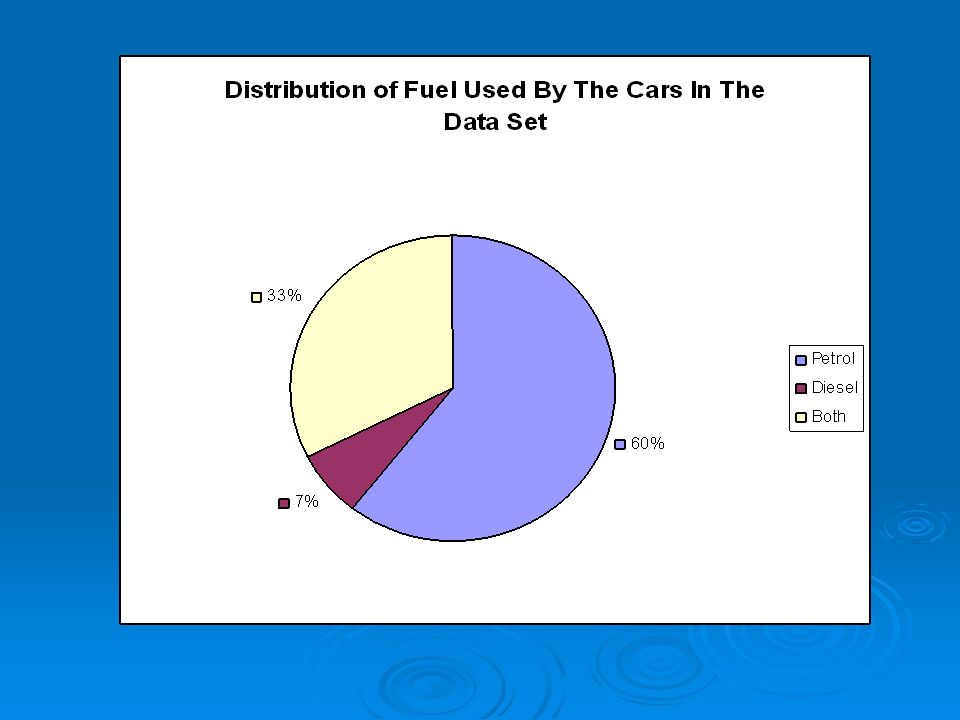
Representation Of Frequency Distribution Of Qualitative Data Qualitative data if it has to be represented graphically, doing it on a pie- chart is the best way to do it. As this kind of representation clearly gives the reader an idea about what percentage of the data under study belongs to which category. Here in our data set we have taken totally three attributes which are qualitative. Out of which we have chosen the Fuel Type to be represented graphically. Fuel Type Frequency Petrol26 Diesel3 Both14

18
Probability Distribution of Transmission with respect to the Horse power Class of Horse power AutomaticManualBothtotal 0 - 50 0000 50 - 100 0303 100 - 150 0606 150 - 200 2608 200 - 250 53210 250 - 300 7007 300 - 350 5005 350 - 400 2013 400 - 450 1001 450 - 500 0000 total2218343 The above given table contains a distribution of the Horse power in respect to the Transmission systems used in cars. Since the cars in the data set have automatic/manual/ or both type of variants available for a single type of car. It’s represented as mentioned. With the help of the table we are trying to find the probability occurrence in various ways.

19
Find the probability that the selected car has an automatic gear system? Total number of cars with automatic gear system is =22 Total number of cars =43 Therefore, probability that a selected car has a gear system in it is =0.511627907 So there is a 51.16 % chance that the selected car has an automatic gear system in it. Find the probality that a selected car with a manual gear system has a horse power of 175 bhp. Total number of cars with manual gear system = 18 Cars falling in the class with horse power of 175 bhp = 6 Hence probability that a selected car with a manual gear has a horse power Of 175= 0.333333333 33.33% chances are there that a selected car would have a manual gear system with 175 bhp.

20
Binomial Distribution Binomial Distribution Success defined as picking a car which has mileage above 13 km/l. From the data set we can find the values of the following. Success event: p = 0.348837209 Failure event: q = 0.651162791 Probability of picking up 6 cars with mileage more than 13 kmpl in 10 trails from the data set. No of trials: n = 10 Random variable x = 6 Probability of (X = x) = nCx * px * q (n-x ) Therefore, P(X=6) = 0.068032185 We can say that 6.8% of the time the selected random experiment is true.
 = nCx * px * q (n-x ) Therefore, P(X=6) = We can say that 6.8% of the time the selected random experiment is true..")
21
Normal Distribution Normal Distribution Probability that a randomly selected car from the data set will have a top speed less than 220 Mean of Top speed =204.3488 Standard Deviation =38.7039 x=220 μ =204.3488 σ =38.7039 P (x <= 220) = 0.6570 65.70 % of the times a randomly selected car from the data will have a top speed less than 220. 65.70 % of the times a randomly selected car from the data will have a top speed less than 220.

22
APLICATION OF CORRELATION To apply the concept of correlation in the given data set we have decided to correlate engine capacity and horse power. By the help of scatter diagram we were able to find the degree of correlation between the two attributes graphically.

23
From the graph it is observable that there is a high degree of positive correlation between the two attributes. The correlation coefficient was found out to be 0.91526 The calculated correlation coefficient shows that there is a high level of positive correlation between the two attributes. Which means that as the engine capacity increases the horse power also increases. This conclusion led us to apply the concept of regression in the current aspect. As a result of which we were able to get the regression equation- Y=13.927X + 16.285 Here Y represents engine capacity and X represents the horse power. Now using this equation we can predict what the engine capacity will be for a given value of horse power. Eg:- What will the engine capacity be for a car with an horse power of 600 BHP Y=13.927X+16.285 Here X=600 Therefore Y= 13.927*600+ 16.285 Hence the engine capacity=Y=8372.485 cc In turn the coefficient of determination was found to be R2 =0.8377

Similar presentations