Download presentation
Presentation is loading. Please wait.

1
Check-In/Check-Out (CICO) Data Analysis
Using the CICO Excel Database

2
3-Tiered System of Support Teams Secondary Systems Team
Universal Team Secondary Systems Team Problem Solving Team Tertiary Systems Team Uses Process data; determines overall intervention effectiveness Uses Process data; determines overall intervention effectiveness Plans SW & Class-wide supports Standing team; uses FBA/BIP process for one youth at a time CICO Universal Support Brief FBA/BIP SAIG Complex FBA/BIP WRAP Group w. individual feature Brief FBA/BIP Sept. 1, 2009 2 2

3
CICO Data Analysis Process
1 Determine Group Effectiveness 2 Determine Individual Student Response to CICO 3 Make Data Decisions

4
Overall Goals for CICO Group Effectiveness: 65% or higher
For the group to be successful on a given week, 80% of possible points must be earned for 65% of the days of that week. 80% is 4 out of 5 days, however, at a weekly criteria of 80% a student would have to meet the daily criteria 100% on a 4 day week Individual Student Daily Goal: 80% or higher Individual Student Overall Goal: 80% of points earned weekly for 4 consecutive weeks.

5
EFFECTIVENESS Of INTERVENTION

6
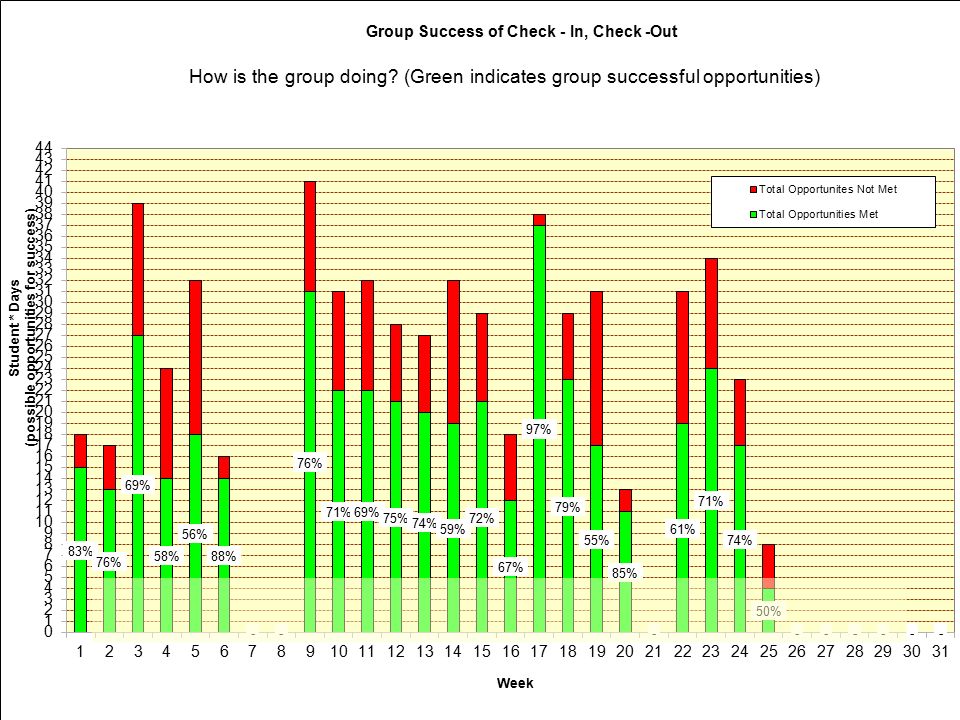
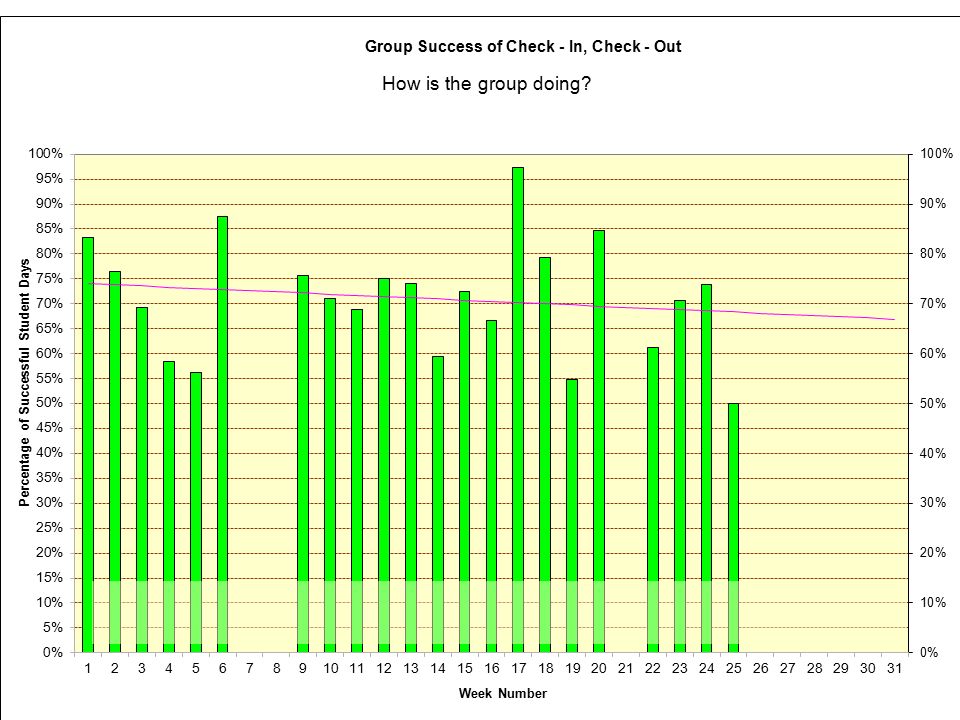
Group Success Questions Have 65% or more students within the group responded positively to the intervention? How is the groups’ data trending? Look at the group graph that includes a trend line. Is it angled upwards or downwards, or is it flat?

7
How to determine group success…
Choose the “Group Charts” tab in the CICO Excel Workbook. Analyze: Group Success – total opportunities met vs. total opportunities not met Median percentage of success statement (must be filtered for “yes”) Group trend data
 Group trend data.")
10
INDIVIDUAL STUDENT RESPONSE TO CICO

11
Individual Progress Questions: Is each student meeting the goal of 80% of possible points for 4 consecutive weeks? How is each student’s data trending? Look at the graph that includes a trend line. Is it angled upwards or downwards, or is it flat?

12
Individual Progress Choose the “Individual Charts” tab in the CICO Excel Workbook. Choose a student from the drop down menu in the green box. Analyze: Individual Progress – days per week on/off target Median percentage of success statement (must be filtered for “yes”) Individual trend data
 Individual trend data.")
15
DATA DECISIONS

16
Data to consider: CICO Data Major & Minor Referral Data
Absence & Tardy Data Suspension Data Qualitative Data Other

17
If Intervention is Effective If Intervention is Ineffective
Data Decisions - Group If Intervention is Effective If Intervention is Ineffective Continue Problem Solve & Modify

18
Data Decisions - Individual Student
If Intervention is Effective: If Intervention is Ineffective: Continue Modify Fade Intensify Discontinue/Graduate Recycle through Problem Solving Process

19
For more information about CICO…
Book Responding to Problem Behavior in Schools: The Behavior Education Program Crone, Horner, & Hawken (2004) Guilford Press DVD The Behavior Education Program: A Check-In, Check-Out Intervention for Students at Risk Hawken, Pettersson, Mootz & Anderson (2005) Websites
 Guilford Press. DVD. The Behavior Education Program: A Check-In, Check-Out Intervention for Students at Risk. Hawken, Pettersson, Mootz & Anderson (2005) Websites.")
Similar presentations


 (March & Horner, 1998) BEP Daily Cycle 1.Check in office at arrival to school *reminder.>")

 Response to evidence-based interventions (Elliott, Witt, Kratchowill, &>")


