Download presentation
Presentation is loading. Please wait.

1
GQM and data analysis Example from a Norwegian company Tor Stålhane IDI / NTNU

2
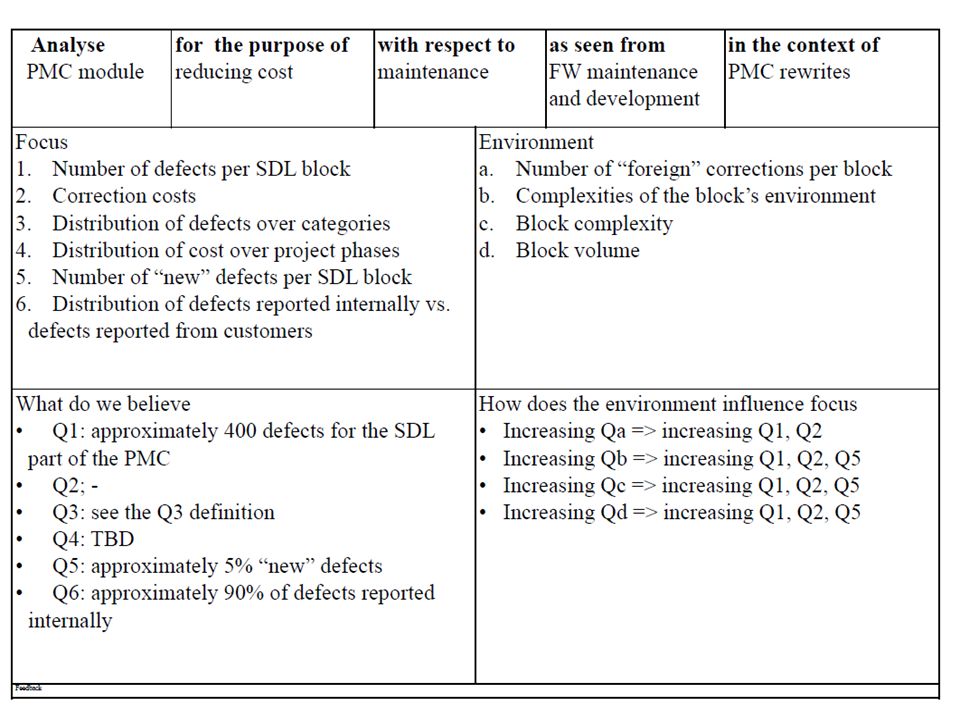
The Problem The company in question develops hardware and software. They have two software groups, each with circa 15 developers. Part of the system is developed in SDL. In order to focus their V&V work better they needed to know which SDL module characteristics that caused errors. Possible candidates were number of module states, number of input signals etc.

3
What to measure? In order to get a consistent and efficient data collection and analysis, we started with a GQM process. A half-day basic course in GQM. A half-day workshop where they identified – the questions that needed answers. – which metrics they needed in order to answer these questions.

6
The Metrics Some of the metrics collected for each SDL module: Number of errors found. Subjective - perceived - complexity. Number of pages of SDL description. Number of SDL states Number of signals in Number of signals out

8
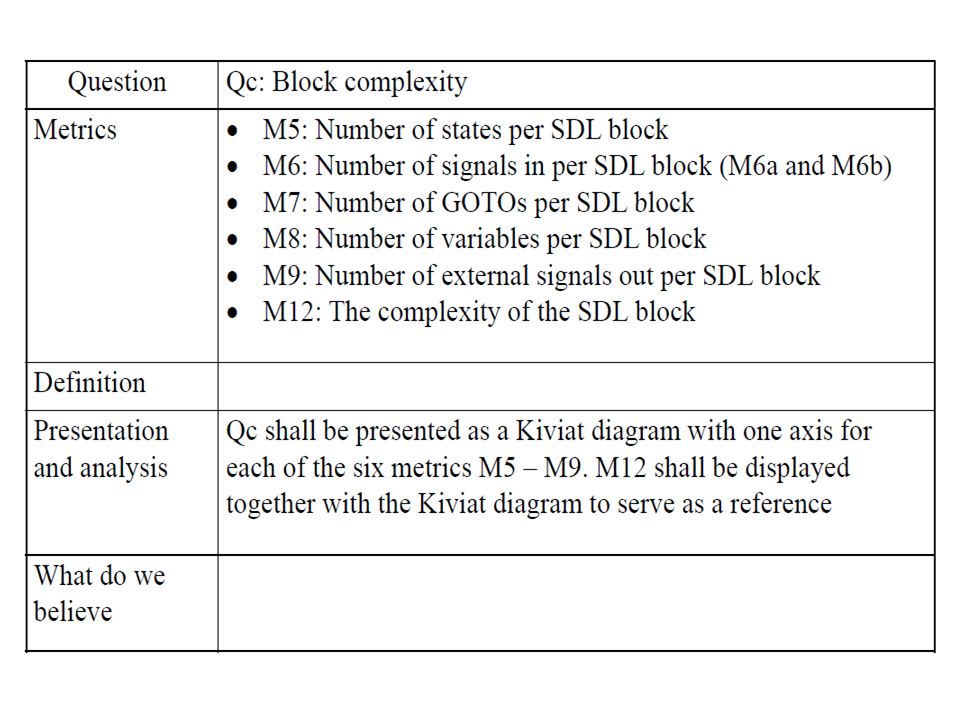
Qc – block complexity When we defined the Qc question, we decided to use a Kiviat diagram to display the metrics included in this question. We show the following data: Non-modified metrics. Just to show that it is not a good idea Normalized metrics values Mean metrics values for each complexity class

9
Non-modified metrics The large value of M6b reduces everything else to “noise”

10
Normalized metrics values – 1 M5 PMECDM52 PMECOM56 CAMCON32 HPOTBL21 TAMCON25 TAMTST10 TTRMOT6 TTRTST3 M5 PMECDM0,93 PMECOM1,00 CAMCON0,57 HPOTBL0,38 TAMCON0,45 TAMTST0,18 TTRMOT0,11 TTRTST0,05

11
Normalized metrics values – 2 High complexity Low complexity Be ware different scales on the axis in the two diagrams

12
Mean metrics values – 1 Be ware different scales on the axis in the three diagrams

13
Mean metrics values – 2

15
What makes it complex - 1 We went through all the hypothesis put forward by the developers during the GQM session. We will look at three of them: Number of states - M5 Number of signals out - M9 Number of pages in the SDL description - M10

16
What makes it complex - 2 The data for the three metrics M5, M9 and M10 were sorted according to the complexity scores (High, Medium and Low). An ANOVA analyses was then performed for each data set. We decided to require a p-value better than 10%

17
ANOVA results - 1 Number of states – M5: Source of VariationSS df MS P-value Between Group 1190,04 2595,02 0,25 Within Groups 1631,83 5326,37 Number of states does not contribute significantly to the complexity as perceived by the developers.

18
ANOVA results - 2 Number of signals out – M9: Source of VariationSS df MS P-value Between Group 2779,0 421389,521 0,098 Within Groups 1813,83 5 362,77 Number of signals out contribute significantly to the complexity as perceived by the developers

19
ANOVA results - 3 Number of pages in the SDL description – M10: Source of VariationSS df MS P-value Between Groups 5586,04 22793,02 0,04 Within Groups 2133,83 5 426,77 Number of pages in the SDL description contribute significantly to the complexity as perceived by the developers

20
Summary - 1 SDL module complexity as perceived by the developers depends on two factors: Number of signals out Number of pages in the SDL description The other suspected factors identified during the GQM process did not give a significant contribution.

21
What about Errors We now have some ideas on what makes a module look complex to the developers. The next step is to see if there is any connection between module complexity and the number of errors in the modules. The ANOVA can give us an answer.

22
Complexity and Errors - 1 Errors and complexity Source of Variation SS dfMS P-value Between Groups 1646,83 2 823,42 0,06 Within Groups 770,67 5 154,13 It is reasonable to assume that complex modules have more errors.

23
Complexity and Errors - 2 If we look at the ANOVA summary table, we see that the differences are quite large: GroupsCount Sum AverageVariance Column 13102 34 343 Column 23 22 7,33 41,33 Column 32 2 1 2 Due to few observations for each complexity level, the variances are large. Thus, we should not be too categorical in our conclusions.

24
Conclusions With all the necessary caveats in mind the company decided as follows: In order to reduce the number of errors we need to single out modules with : Large descriptions - more than 35 pages of SDL description. Many signals out - more than 30. The limiting values are the average values from the ANOVA summary tables.

Similar presentations


 + σ 2 (Genotype) + σ 2 (Measurement) + σ 2 (Condition) + σ 2 (ε) Each of the.>")
>")


 (Click icon for audio)>")


