Download presentation
Presentation is loading. Please wait.

2
Introduction to Statistics for the Social Sciences SBS200, COMM200, GEOG200, PA200, POL200, or SOC200 Lecture Section 001, Spring 2015 Room 150 Harvill Building 8:00 - 8:50 Mondays, Wednesdays & Fridays.

3
No more lab Sessions this semester

5
Schedule of readings Before next exam (Monday May 4 th ) Please read chapters 10 – 14 Please read Chapters 17, and 18 in Plous Chapter 17: Social Influences Chapter 18: Group Judgments and Decisions
 Please read chapters 10 – 14 Please read Chapters 17, and 18 in Plous Chapter 17: Social Influences Chapter 18: Group Judgments and Decisions")
6
Exam 4 – Monday, May 4 th Study guide is online Shorter and longer versions Bring 2 calculators Bring 2 pencils (with good erasers) Bring ID Review Homework Review for Exam 4
 Bring ID Review Homework Review for Exam 4")
8
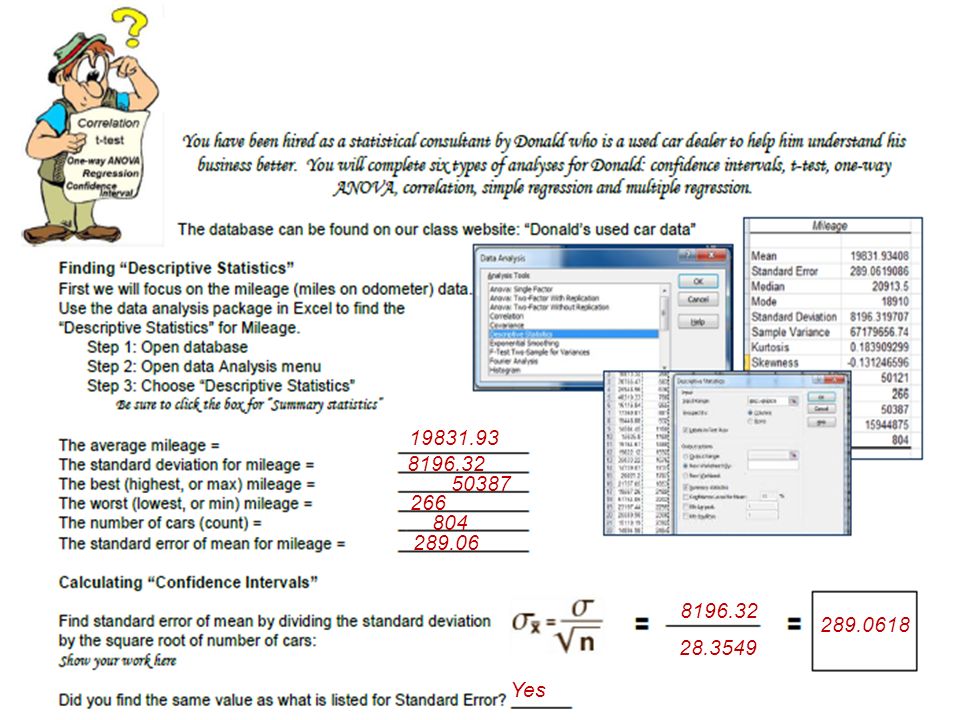
19831.93 8196.32 50387 266 804 289.06 8196.32 28.3549 289.0618 Yes

9
19831.93 289.06 1.96 2.58 19831.93 ± (1.96) (289.06) 19831.93 ± 566.56 19265.37 19265 20397.56 20397 19086.16 19086 20577.70 20577 19831.93 ± (2.58) (289.06) 19831.93 ± 745.77
 (289.06) ± ± (2.58) (289.06) ±")
11
Number of doors 22-doors vs 4-doors Quasi Price of car (dollars) Ratio Between Two-tailed $23,807.14 $20,580.67 alpha = 0.05 3.9677 1.9629 802 p =.000079 The average price for 2-door cars was $23,807.14, while the average price for 4-door cars was $20,580.67. A t-test was conducted and found this to be a significant difference t(802) = 3.9677; p < 0.01
 = ; p <")
12
Size of the engine 3 4- versus 6- versus 8 cylinder engines Quasi Price of car (dollars) Ratio Between $17,862 $20,081 alpha = 0.05 345.3577 3.006964 2 p =.(17 zeroes, then)69755 The average prices were $17,862, $20,081 and $38.968 for the 4-, 6-, and 8-cylinder engines (respectively). An ANOVA was conducted and found this to be a significant difference F(2,801) = 345; p < 0.01 801 $38,968
 = 345; p < $38,968.")
13
802.195 The relationship between mileage and car price was -0.14. This is a weak and not significant correlation r(802) = -0.14305;n.s. -0.1431
 = ;n.s")
14
df = 802 b = -0.1725 r = -0.1431 a = 24765 lower higher -0.1725x + 24765 For each additional mile driven (as x goes up by 1), cost of the car goes down by 17.25 cents. The base cost for the car (before taking into account the mileage) is $24,765 (30,000)(-0.1725) + 24765 = $19,590 -0.1431 2 =.0204633 or 2.04% The proportion of total variance for price of car that was accounted for by miles was 2.04%
 is $24,765 (30,000)( ) = $19, = or 2.04% The proportion of total variance for price of car that was accounted for by miles was 2.04%.")
15
Y’ = cost of car (dollars) mileagesize of car 3145.75 -0.15243 Y’ = 3145.75 + (-0.15243)(mileage) + (4027.67)( car size) 4027.67 yes 15.243 cents $4,027.67
 mileagesize of car Y’ = ( )(mileage) + ( )( car size) yes cents $4,027.67")
17
Today we will be reviewing for the test using clicker questions.

18
What if we were looking to see if our stop-smoking program affects peoples‘ desire to smoke. What would null hypothesis be? a. Can’t know without knowing the dependent variable b. The program does not work c. The programs works d. Comparing the null and alternative hypothesis Correct

19
Which of the following is a Type I error: a. We conclude that the program works when it fact it doesn’t b. We conclude that the program works when in fact it does c. We conclude that the program doesn’t work when in fact it does d. We conclude that the program doesn’t work when in fact it doesn’t Correct

20
What is the null hypothesis of a correlation coefficient? a. It is zero (nothing going on) b. It is less than zero c. It is more than zero d. It equals the computed sample correlation Correct
 b. It is less than zero c. It is more than zero d. It equals the computed sample correlation Correct.")
21
Let’s try one Winnie found an observed correlation coefficient of 0, what should she conclude? a. Reject the null hypothesis b. Do not reject the null hypothesis c. Not enough info is given Correct

22
In the regression equation, what does the letter "a" represent? a. Y intercept b. Slope of the line c. Any value of the independent variable that is selected d. None of these Y’ = a + bx 1 + bx 2 + bx 3 + bx 4 Correct

23
Assume the least squares equation is Y’ = 10 + 20X. What does the value of 10 in the equation indicate? a. Y intercept b. For each unit increased in Y, X increases by 10 c. For each unit increased in X, Y increases by 10 d. None of these. Correct

24
In the least squares equation, Y’ = 10 + 20X the value of 20 indicates a. the Y intercept. b slope (so for each unit increase in X, Y’ increases by 20). c. slope (so for each unit increase in Y’, X increases by 20). d. none of these. Correct
. c. slope (so for each unit increase in Y’, X increases by 20). d. none of these. Correct.")
25
In the equation Y’ = a + bX, what is Y’ ? a. Slope of the line b. Y intercept C. Predicted value of Y, given a specific X value d. Value of Y when X = 0 Correct

26
If there are four independent variables in a multiple regression equation, there are also four a. Y-intercepts (a). b. regression coefficients (slopes or bs). c. dependent variables. d. constant terms (k). Y’ = a + bx 1 + bx 2 + bx 3 + bx 4 Correct
. b. regression coefficients (slopes or bs). c. dependent variables. d. constant terms (k). Y’ = a + bx 1 + bx 2 + bx 3 + bx 4 Correct.")
27
As n ↑ According to the Central Limit Theorem, which is false? As n ↑ x will approach µ As n ↑ curve will approach normal shape As n ↑ curve variability gets larger a. b. c. d. Correct

28
If the coefficient of determination is 0.80, what percent of variation is explained? a. 20% b. 90% c. 64% d. 80% What percent of variation is not explained? a. 20% b. 90% c. 64% d. 80% Correct coefficient of determination = r 2 Correct

29
Which of the following represents a significant finding: a. p < 0.05 b. t(3) = 0.23; n.s. c. the observed t statistic is nearly zero d. we do not reject the null hypothesis Correct
 = 0.23; n.s. c. the observed t statistic is nearly zero d. we do not reject the null hypothesis Correct.")
30
In multiple regression what is the range of values for a coefficient of regression? a. 0 to +1.0 b. 0 to -1.0 c. -1.0 to +1.0 d. Any number at all Y’ = a + b 1 X 1 + b 2 X 2 + b 3 X 3 Correct

31
If r = 1.00, which inference cannot be made? a. The dependent variable can be perfectly predicted by the independent variable b. This provides evidence that the dependent variable is caused by the independent variable c. All of the variation in the dependent variable can be accounted for by the independent variable d. Coefficient of determination is 100%. Correct

32
In a regression analysis what do we call the variable used to predict the value of another variable? a. Independent b. Dependent c. Correlation d. Determination Let’s try one Correct

33
What can we conclude if the coefficient of determination is 0.94? a. r 2 = 0.94 b. direction of relationship is positive c. 94% of total variation of one variable is explained by variation in the other variable. d. Both A and C Correct

34
Which of the following statements regarding the coefficient of correlation is true? a. It ranges from -1.0 to +1.0 b. It measures the strength of the relationship between two variables c. A value of 0.00 indicates two variables are not related d. All of these Correct

35
What does a coefficient of correlation of 0.70 infer? (r = +0.70) a. Almost no correlation because 0.70 is close to 1.0 b. 70% of the variation in one variable is explained by the other c. Coefficient of determination is 0.49 d. Coefficient of nondetermination is 0.30 Correct coefficient of correlation = r coefficient of determination = r 2
 a. Almost no correlation because 0.70 is close to 1.0 b. 70% of the variation in one variable is explained by the other c. Coefficient of determination is 0.49 d. Coefficient of nondetermination is 0.30 Correct coefficient of correlation = r coefficient of determination = r 2.")
36
The Pearson product-moment correlation coefficient, r, requires that variables are measured with: a. an interval scale b. a ratio scale c. a nominal scale d. either A or B. Correct

37
If r = 0.65, what does the coefficient of determination equal? a. 0.194 b. 0.423 c. 0.577 d. 0.806 Correct

38
If the coefficient of correlation is 0.60, what percent of variation is not explained? a. 20% b. 90% c. 64% d. 80% Correct

39
If the coefficient of determination is 0.20, what percent of variation is not explained? a. 20% b. 90% c. 64% d. 80% Correct

40
What is the measure that indicates how precise a prediction of Y is based on X or, conversely, how inaccurate the prediction might be? a. Regression equation b. Slope of the line c. Standard error of estimate d. Least squares principle Correct

41
Let’s try one Agnes compared the heights of the women’s gymnastics team and the women’s basketball team. If she doubled the number of players measured (but ended up with the same means) what effect would that have on the results? a. the means are the same, so the t-test would yield the same results. b. the means are the same, but the variability would increase so it would be harder to reject the null hypothesis. c. the means are the same, but the variability would decrease so it would be easier to reject the null hypothesis. Correct
 what effect would that have on the results. a. the means are the same, so the t-test would yield the same results. b. the means are the same, but the variability would increase so it would be harder to reject the null hypothesis. c. the means are the same, but the variability would decrease so it would be easier to reject the null hypothesis. Correct.")
42
Let’s try one Agnes compared the heights of the women’s gymnastics team and the scores they got. If she doubled the number of players measured, but ended up with the same correlation (r) what effect would that have on the results? a. the r is the same, so the conclusion would be the same b. the r is the same, but with more people, degrees of freedom (df) would go up and it would be harder to reject the null hypothesis. c. the r is the same, but with more people, degrees of freedom (df) would go up and it would be easier to reject the null hypothesis. Correct
 what effect would that have on the results. a. the r is the same, so the conclusion would be the same b. the r is the same, but with more people, degrees of freedom (df) would go up and it would be harder to reject the null hypothesis. c. the r is the same, but with more people, degrees of freedom (df) would go up and it would be easier to reject the null hypothesis. Correct.")
43
Which of the following is true about the standard error of estimate? a. It is a measure of the accuracy of the prediction b. It is based on squared vertical deviations between Y and Y’ c. It cannot be negative d. All of these Standard error of the estimate: a measure of the average amount of predictive error the average amount that Y’ scores differ from Y scores a mean of the lengths of the green lines Standard error of the estimate (line) Correct
 Correct.")
44
If all the plots on a scatter diagram lie on a straight line, (perfect correlation) what is the standard error of estimate? a. - 1 b. +1 c. 0 d. Infinity Standard error of the estimate: a measure of the average amount of predictive error the average amount that Y’ scores differ from Y scores a mean of the lengths of the green lines Standard error of the estimate (line) Correct
 Correct.")
45
Let’s try one Which of these correlations would be most likely to have the highest positive value for r? a. Scatterplot A b. Scatterplot B c. Scatterplot C d. Can not be determined from the information given Scatterplot AScatterplot BScatterplot C Correct

46
Let’s try one Which of the these scatterplots will have the smallest “y intercept”? a. Scatterplot A b. Scatterplot B c. Scatterplot C d. Can not be determined from the information given Scatterplot AScatterplot BScatterplot C Correct

47
Let’s try one Which of the these correlations would be most likely to represent the correlation between salary and expenses? a. Scatterplot A b. Scatterplot B c. Scatterplot C d. Can not be determined from the information given Scatterplot AScatterplot BScatterplot C Correct

48
Let’s try one Which of the following correlations would allow you the most accurate predictions? a. r = + 0.01 b. r = - 0.10 c. r = + 0.40 d. r = - 0.65 Correct

49
After duplicate correlations have been discarded and trivial correlations have been ignored, there remain a. two correlations b. three correlations c. six correlations d. nine correlations Let’s try one Correct

50
Which of the following conclusions can not be made from the data in the matrix? a. There is a significant correlation between Science and Reading b. There is a significant correlation between Math and Reading c. There is a significant correlation between Math and Science Let’s try one Correct

51
Thank you for a wonderful semester! and good luck with your studies See you at the final exam.

Similar presentations