Download presentation
Presentation is loading. Please wait.

1
Collaborative Fisheries Management. 14 th May 2014

2
Acknowledgements NORAD Communities of Rufiji, Kilwa, Mafia, Mtwara rural and Temeke Municipality

3
Socio-economic and Ecological Significance Fisheries Coral Reef Habitats Mangroves Sea Grasses River Estuarine

4
Threats to Socio-economic and Ecological significances 3. Destructive / unsustainable fishing 4. Artisanal fishers no access to capital 2. Open access fisheries management 1. Limited central & local government capacity

5
(CFM) -Alternative to the threat Why? – Devolves sovereignty for fisheries management - stakeholders involvement -Empowers communities on fisheries management planning & decision- making as provided in Tanzania Fisheries Act of 2003

6
CFM GOAL: Strengthen Community Capacity on Fisheries Management.

7
1.Promote collaborative FISHERIES MANAGEMENT 2.Share knowledge and RAISE AWARENESS on fisheries management 3.Protection of HABITATS & SPECIES 4.MONITORING and data for management Objectives of the component

8
Component outputs 1. Community groups responsible for fisheries co- management established and/or strengthened. 2. Collaborative fisheries management area plans (CFMAPs) developed and implementation initiated. 3. Capacity of community fisheries co-management groups to collaborate in data collection and to apply fisheries information in decision-making strengthened
 developed and implementation initiated. 3. Capacity of community fisheries co-management groups to collaborate in data collection and to apply fisheries information in decision-making strengthened.")
9
5. Lessons learned disseminated to relevant parties interested/ involved in fisheries co-management initiatives 4. District capacity to engage in fisheries co- management strengthened

10
Awareness raising & Communication Intensive awareness raising conducted using materials

11
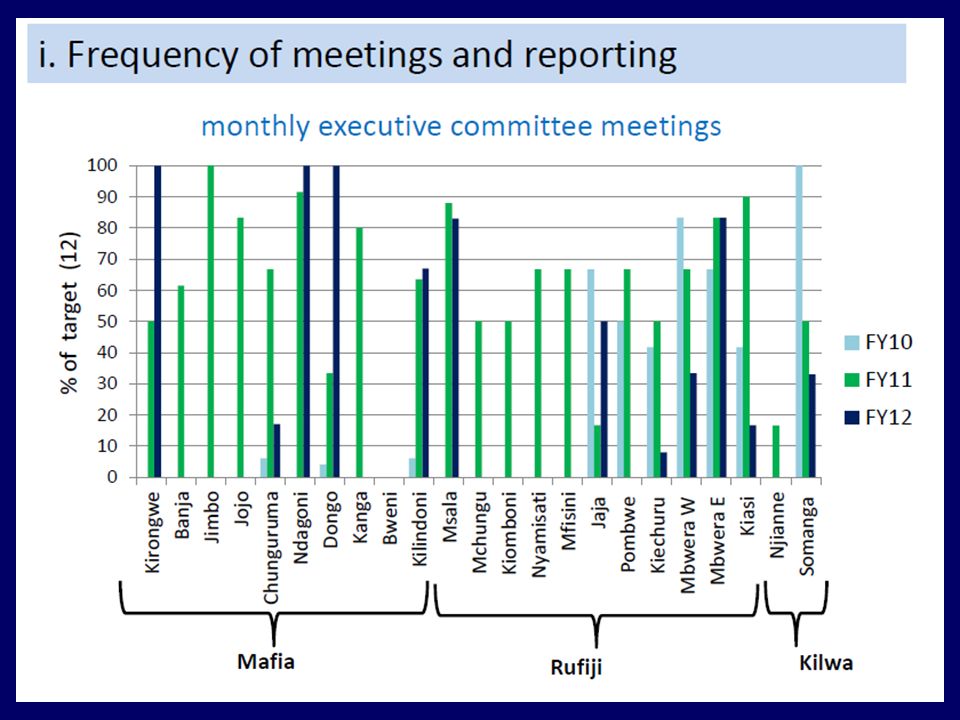
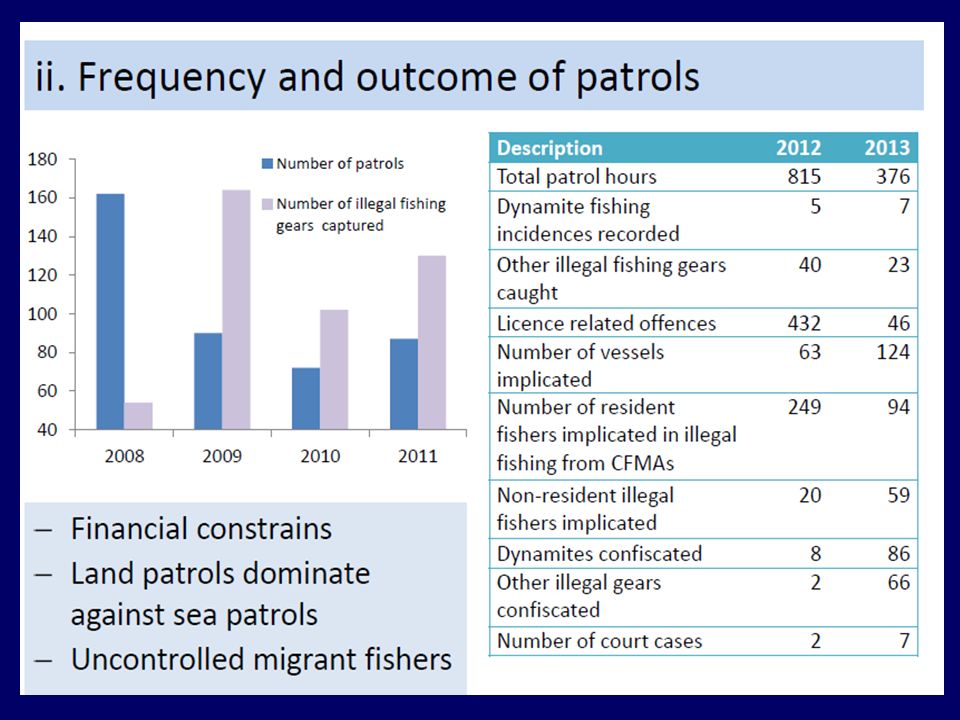
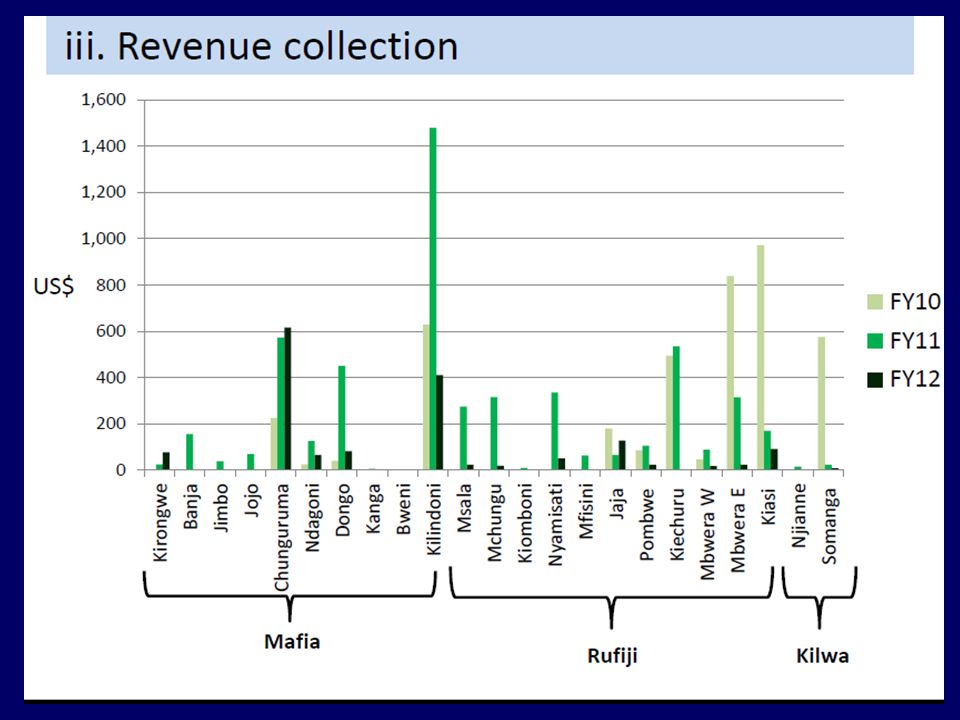
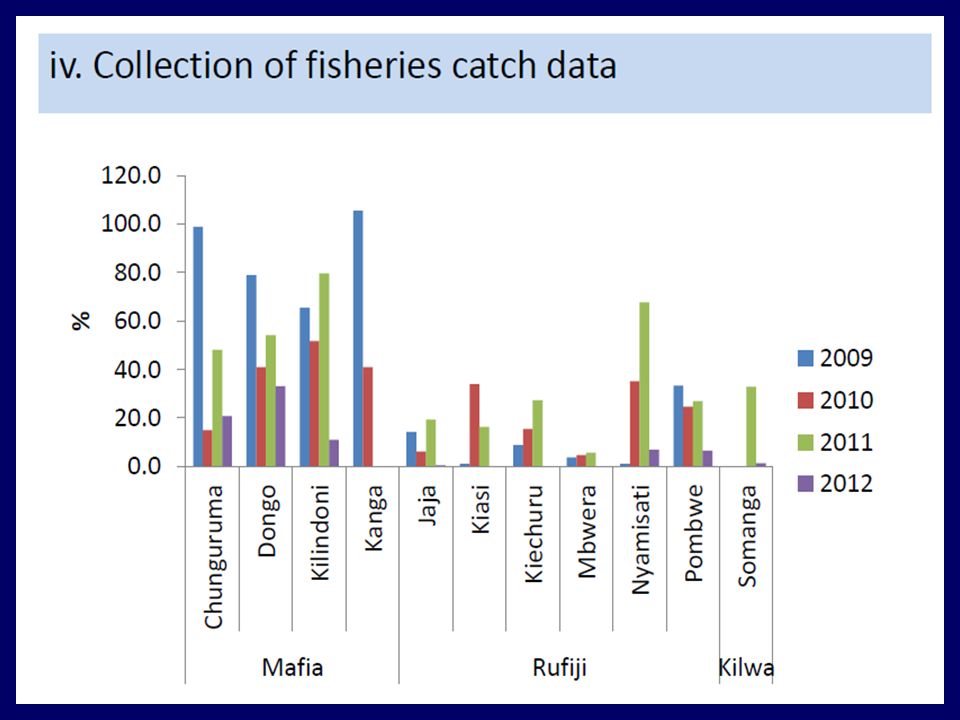
BMU Formation Process: 1.Members registration 2.Election of BMU’s office bearers : Roles of BMU: 1. Preparation and implementation of community fisheries management plans, bylaws & work plans 2. To conduct surveillance/patrol activities 3. To collection fisheries based revenue 4. To collect fisheries data 5. To register and issue permit to fishers applying for fishing licenses

12
BMU Organization Structure

13
Study sites = 76 (41 and 35 villages) Fishing Patterns Survey (2007/2014)
 Fishing Patterns Survey (2007/2014)")
14
BMU capacity building process BMU capacity building process 7. Training in fisheries resources use planning inc. problem identification, analysis & development of 5 yr plans 1. Training Governance & leadership skills 8. Fund raising & financial management training- BMU financial sustainability strategy 2. Study visits to Tanga & Lake Victoria 3. Fisheries policy & legislation awareness raising & Bylaws development 4. Fish catch data collection training 5. Surveillance training – surveillance protocol

15
Build capacity cont……………. Provision of 6 Boats and other surveillance equipments to BMUs District Officer’s capacity building on CFM through: 1.Change agency training 2.Computer & data management training 3. Collaborative natural resources management course 4. Exchange visits 5. On job attendance and facilitation of village level meetings

16
Establishment of Collaborative Fisheries Management Areas (CFMA) – Second stage for strengthen community capacity THE UNITED REPUBLIC OF TANZANIA MINISTRY OF LIVESTOCK DEVELOPMENT AND FISHERIES PREPARED BY FISHERIES DEVELOPMENT DIVISION AND WORLD WIDE FUND FOR NATURE NOVEMBER, 2010
 – Second stage for strengthen community capacity THE UNITED REPUBLIC OF TANZANIA MINISTRY OF LIVESTOCK DEVELOPMENT AND FISHERIES PREPARED BY FISHERIES DEVELOPMENT DIVISION AND WORLD WIDE FUND FOR NATURE NOVEMBER, 2010")
17
CFMA Management Process Roles of CCC: Harmonize CFMA Mgt PlansHarmonize CFMA Mgt Plans Coordinate implementation of CFMA plansCoordinate implementation of CFMA plans Share with BMUs and review joint implementation issuesShare with BMUs and review joint implementation issues Ensure good governance among BMUsEnsure good governance among BMUs BMU 1 BMU 4BMU 3 BMU 2 CCC

18
What has been a progress so far?

19
36 BMU established and strengthened capacity, 23 in active operation (20,497 registered) 48% women 7 CFMAs: 2,498 sq km 16 no-take zones – approx. 61.2 sq km 7 CFMA mgt plans 11 pilot sustainable finance plans Mafia Island Marine Park

25
Average Catch Values (kg) from 19 Landing Sites of 10 Villages Year Catch per trip per day Catch per Gear per hour Catch per Fisher Catch per Fisher per Gear per hour 200920.681.138.780.54 201047.675.1410.350.80 201160.806.3617.131.24 Increase in Fish availability
 from 19 Landing Sites of 10 Villages Year Catch per trip per day Catch per Gear per hour Catch per Fisher Catch per Fisher per Gear per hour Increase in Fish availability")
27
Achievements Confiscation of dynamite and unsustainable fishing gears in Somanga, Kilwa

28
Thanks for your time

Similar presentations


 was formed in 2005 in response to concerns raised by NGOs at the increasing.>")

 SEASCAPE PROGRAMME WWF-TANZANIA.>")


