Download presentation
Presentation is loading. Please wait.

1
Macroeconomic Equilibrium The AD-AS Model

2
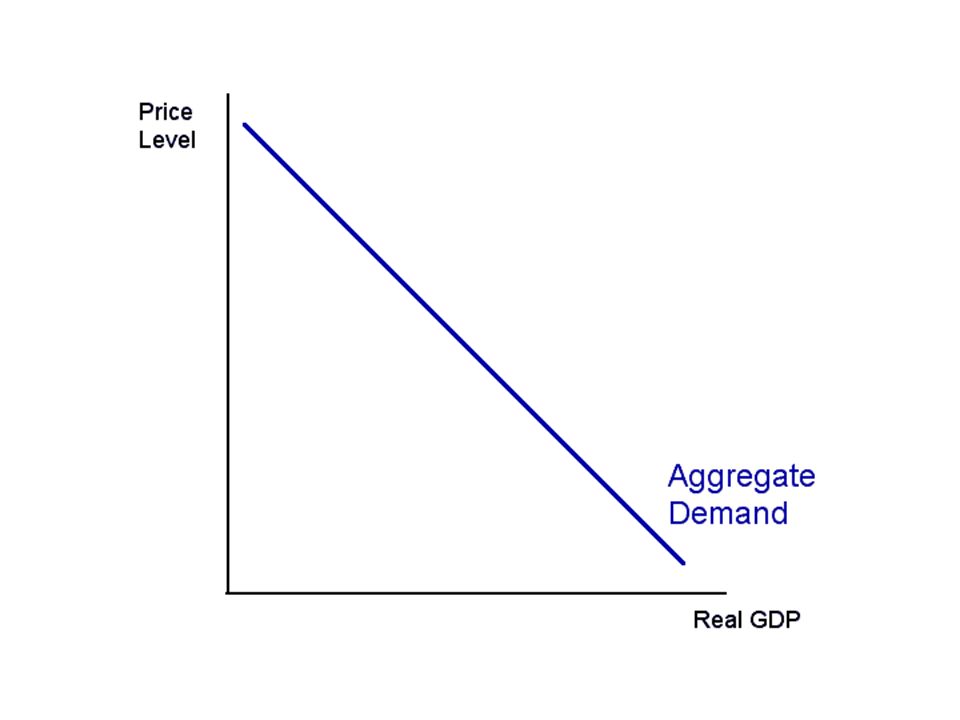
Aggregate Demand Just as we can determine a demand curve for a particular good or service, we can also determine an Aggregate Demand Curve that represents demand in the macro economy In this case, it is the demand for a certain level of output (GDP) at a particular price level
 at a particular price level")
4
Shift in Aggregate Demand Changes in Expectations – Greater optimism leads to more spending at any given price level Changes in Wealth – As household assets increase in value, people feel free to spend more at any given price level

5
Figure 17.2 Shifts of the Aggregate Demand Curve Ray and Anderson: Krugman’s Macroeconomics for AP, First Edition Copyright © 2011 by Worth Publishers

6
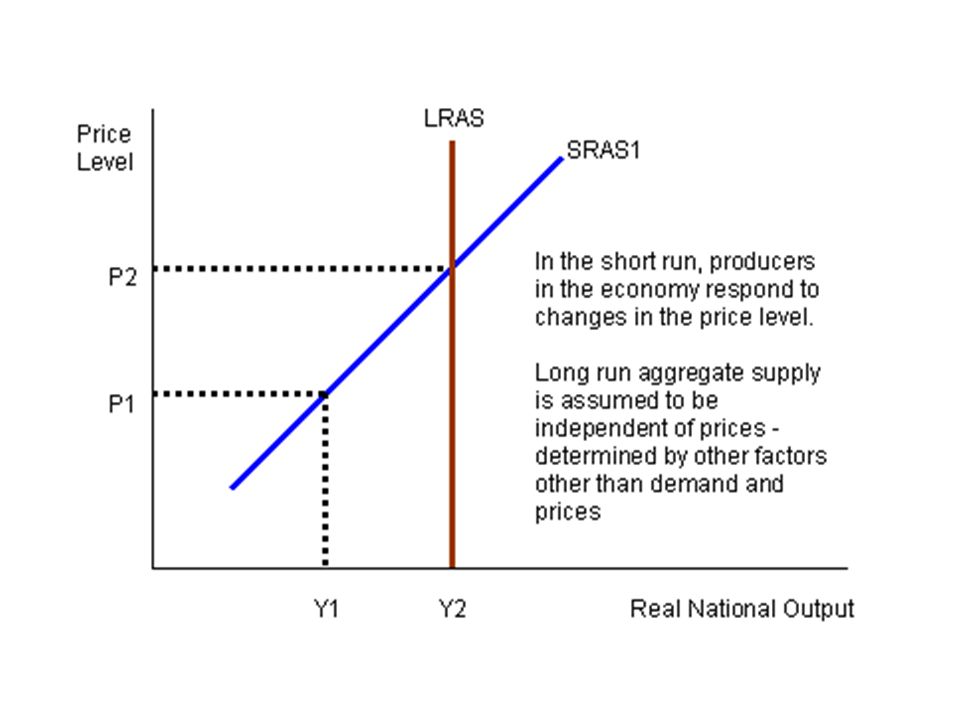
Short-Run Aggregate Supply (SRAS) Upward sloping, just as in market case – But again for different reasons Profits = Price of Outputs – Price of Inputs – Revenue generated by price increases outpaces increases in input costs (wages are “sticky”) – So, in the short-run curve slopes upwards Reverse is also true
 Upward sloping, just as in market case – But again for different reasons Profits = Price of Outputs – Price of Inputs – Revenue generated by price increases outpaces increases in input costs (wages are sticky ) – So, in the short-run curve slopes upwards Reverse is also true")
8
Changes in SRAS 1.Changes in commodity prices – Oil; steel – Decrease in commodity prices = increase in SRAS 2.Changes in nominal wages – Increase in nominal wages = decrease in SRAS 3.Change in productivity – Increases in productivity = increase in SRAS

9
Figure 18.2 Shifts of the Short-Run Aggregate Supply Curve Ray and Anderson: Krugman’s Macroeconomics for AP, First Edition Copyright © 2011 by Worth Publishers

10
Long-Run Aggregate Supply (LRAS) In the longer term, “sticky” input prices “catch up” to output prices Therefore, in the long run, price level should have no affect on aggregate supply So, aggregate supply would be a vertical line
 In the longer term, sticky input prices catch up to output prices Therefore, in the long run, price level should have no affect on aggregate supply So, aggregate supply would be a vertical line")
12
Long-Run Aggregate Supply What is the significance of the output value (Y) at which the LRAS is vertical? The answer is the economy’s potential output –YP–YP – This represents the level at which the economy would produce if all prices (including wages) were perfectly flexible
 were perfectly flexible.")
13
Figure 18.4 Actual and Potential Output from 1989 to 2009 Ray and Anderson: Krugman’s Macroeconomics for AP, First Edition Copyright © 2011 by Worth Publishers

14
Figure 19.4 Long-Run Macroeconomic Equilibrium Ray and Anderson: Krugman’s Macroeconomics for AP, First Edition Copyright © 2011 by Worth Publishers Long-Run Macroeconomic Equilibrium

Similar presentations


 is at a level of output that corresponds to equilibrium in labor market.>")


 shows the quantity of real GDP produced at different.>")


 that firms will produce at each Price Level (PL)>")


