Download presentation
Presentation is loading. Please wait.

1
Being Able to Look Before You Leap: Using Probabilistic Scales to Predict Response to Government Payment Changes Anne Sharp and Erica Riebe

2
The problem Evaluation research (particularly Government evaluation) has an inability to conduct experiments, retain control groups, or test market Still required to: –Make decisions re payment entitlements and changes –Justify withdrawal or alteration of payments –Understand likely customer reactions So, policy decisions are made in an environment of uncertainty
 has an inability to conduct experiments, retain control groups, or test market Still required to: –Make decisions re payment entitlements and changes –Justify withdrawal or alteration of payments –Understand likely customer reactions So, policy decisions are made in an environment of uncertainty")
3
Our solution Use the Juster Probabilistic Scale to predict the likely reactions of payment recipients to hypothetical life or payments changes Mostly used to date in a marketing context –Future purchase behaviour and/or adoption

4
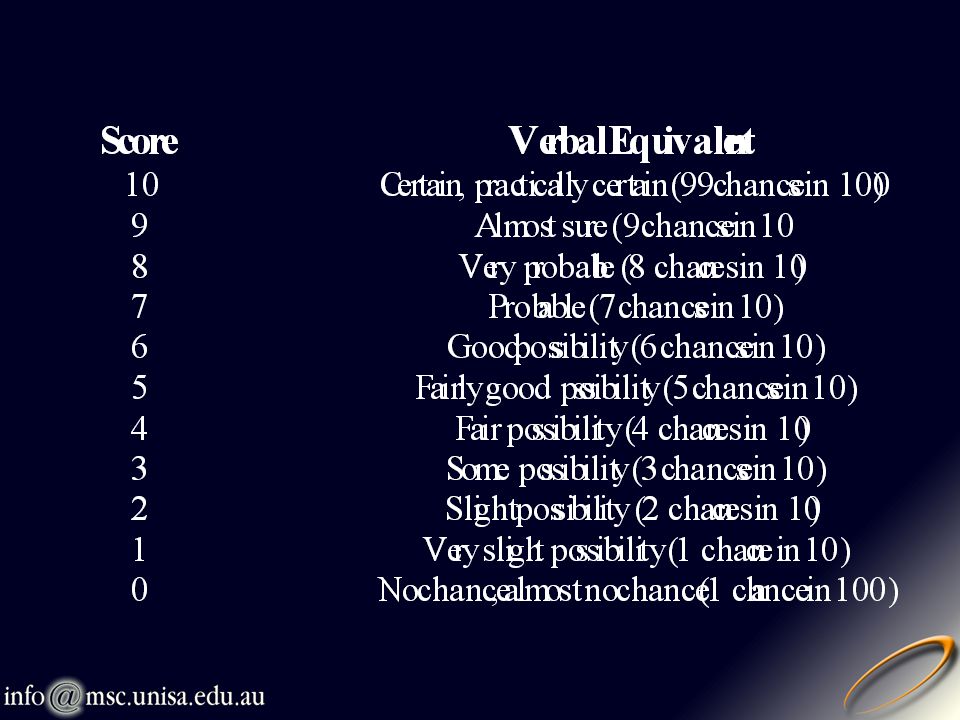
The Juster Scale The scale is an eleven-point probabilistic scale Asks the respondent to predict the chances that they will behave in a particular, specified manner, in a specified time Can be used face-to-face, or via telephone or mail methodology

6
Example question Written Juster: –We are interested in the chances of you seeking employment if your partner lost his/her job. On the following scale, how probable is it that you would seek work in the next 12 months (Full scale provided to respondents) Telephone Probability: We are interested in the chances of you seeking employment if your partner lost his/her job. On a scale from 0 to 10, where 0 equals no chance or almost no chance and 10 equals certain, or practically certain, what are the chances that you would seek work in the next twelve months. You can think of the numbers as chances out of ten, that is 3 would equal 3 chances in 10 and 7 would equal 7 chances in 10.
 Telephone Probability: We are interested in the chances of you seeking employment if your partner lost his/her job. On a scale from 0 to 10, where 0 equals no chance or almost no chance and 10 equals certain, or practically certain, what are the chances that you would seek work in the next twelve months. You can think of the numbers as chances out of ten, that is 3 would equal 3 chances in 10 and 7 would equal 7 chances in 10..")
7
The Juster Scale’s use to date Developed in the US and refined in New Zealand Shown to provide accurate aggregate estimates of consumption behaviour (far better than intentions measures) Thomas Juster (developer) now with PSID so would expect its use to spread to social issues/policy research
 Thomas Juster (developer) now with PSID so would expect its use to spread to social issues/policy research")
8
Our recent Government work Longitudinal, 3 phase, 1300 respondent national evaluation of Parenting Payment (reaction to payment changes and its impact on work decisions) Cross sectional project, 1500 respondents, examining choice behaviour (future payment delivery and mode)
 Cross sectional project, 1500 respondents, examining choice behaviour (future payment delivery and mode)")
9
Case 1: Payment preferences Government making changes in the method for payment that recipients use Recipients will now have a choice on method Juster used to predict uptake of payment choice options –Fortnightly payment via agent –Reconciliation through the tax system (lump sum) –Reconciliation through tax system (fortnightly) Results used for Government workload planning
 –Reconciliation through tax system (fortnightly) Results used for Government workload planning")
10
Application Estimated the aggregate preference level for each payment mode Examined differences in choice when additional information was provided about how the reconciliation process would work. That is, measured sensitivity to communication efforts. Waiting for implementation to occur (July 1) to compare estimates with “actuals” at an aggregate (% who chose each mode) and individual (do people do what they say) level
 to compare estimates with actuals at an aggregate (% who chose each mode) and individual (do people do what they say) level.")
11
Case 2: Parenting Payment Targeted at main carer, means tested only on their income Two broad groups examined: –Respondents who were currently at their preferred workforce participation level; and –Respondents who indicated that they were not at the preferred workforce participation level Juster used to obtain benchmark estimates of changing their work status in the next year

12
Possible changes to workforce participation benchmarks Current Preferred Shift Examined At homeAt homeSeeking paid employment Part timePart timeIncreasing or Decreasing hours Full timeFull timeDecreasing hours worked At homePart timeChanging to part time work At home / part timeFull timeChanging to full time work Full timePart timeDecreasing their hours worked Full timeAt homeDecreasing their hours worked

13
Application In each case the benchmark was established and controlled for across research phases Respondents asked the probability again, given changes in certain circumstances: –Payment withdrawal, increase or decrease –Life events Partner’s income increasing or decreasing Childrens’ attendance and progression in school –Payment eligibility - making it progressively easier to work and not lose payments

14
Application outcomes Established the impact of changes in payments and family circumstances on respondent’s benchmark work probabilities Established the impact of the payment relative to other family events on work benchmarks –Loss of payment versus loss of partner income Established if improved knowledge of the system would increase likely workforce participation (eligibility rule & explaining the rules). –Implications for communication programme

15
Results - Juster Scale Test 1: Satisfied recipients of payment, at home in phase 1, wanting to be at home. Asked probability of seeking work in next year. Phase 2 behaviour examined –Aggregate - Mean Juster 1.9, therefore predicted 19% would find paid work. And 19% did so –Individual - Those who gave high likelihoods were twice as likely to gain employment than those who gave low likelihoods (37% cf 14%)
.")
16
More Results Test 2: Satisfied recipients of payment, at home in phase 2, wanting to be at home. Asked probability of seeking work in next year. Phase 3 behaviour examined –Aggregate - Mean Juster 1.5, therefore predicted 15% would find paid work. And 17% did so –Individual - Those who gave high likelihoods were twice as likely to gain employment than those who gave low likelihoods (32% cf 13%)
.")
17
More Results Test 3: Dissatisfied recipients of payment, at home in phase 1, wanting to be part-time employed. Asked probability of seeking work in next year. Phase 2 behaviour examined – Aggregate - Mean Juster 4.3, therefore predicted 43% would find paid work. And 28% did so. –Distribution shape –Individual - Those who gave high likelihoods were still twice as likely to gain employment than those who gave low likelihoods (29% cf 12%)
.")
18
Implications Juster Scale was stable across phases, enabled accurate predictions of behaviours at both aggregate and individual level Juster Probability scale is a useful tool in evaluating a range of behaviours (consumption, choice, reactions) Can be successfully used in a social policy context More needed on examining the accuracy of predictions at both an aggregate and individual level.
 Can be successfully used in a social policy context More needed on examining the accuracy of predictions at both an aggregate and individual level.")
Similar presentations


 Claire Bailey (Division of.>")


?>")


