Download presentation
Presentation is loading. Please wait.

1
Cash flow analysis: PM

2
Cash Flow Cash flow is an indication of how money moves into and out of the company and how you pay your bills. Cash flow

4
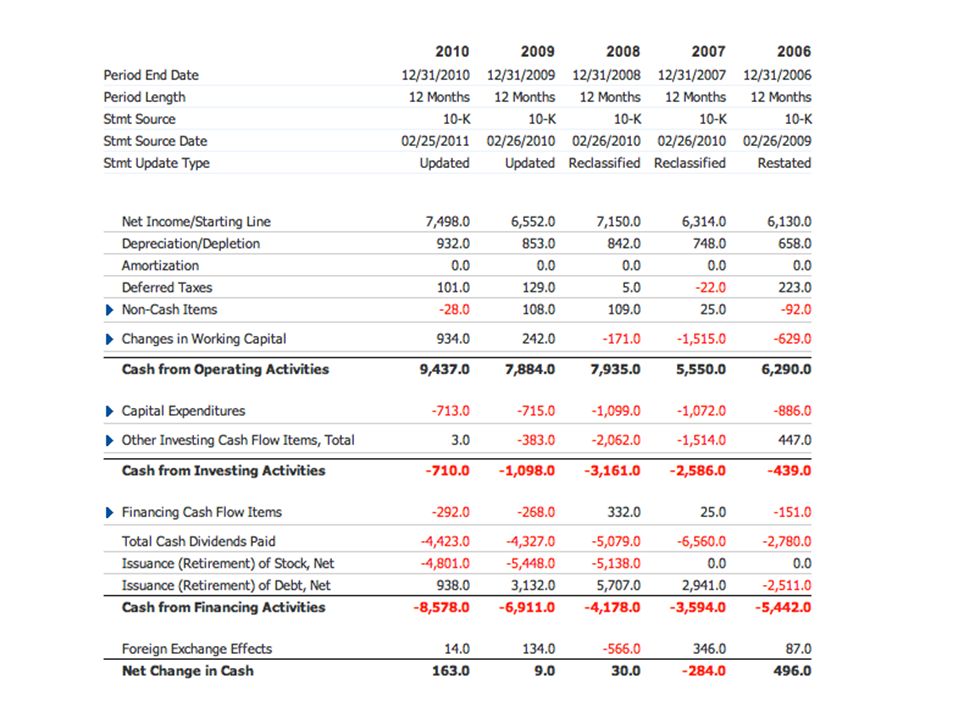
Cash Flow from Operation Operating Cash Flow much higher than BTI(around 3.9M (2010)) Small decline in 2009 but steadily increasing Net Operating Cash Flow/Sales- tells us how many dollars of cash we get for every dollar of sale
) Small decline in 2009 but steadily increasing Net Operating Cash Flow/Sales- tells us how many dollars of cash we get for every dollar of sale")
5
Current Ratio It tells the business owner if current assets are sufficient to meet current debt current assets divided by current liabilities PM's current ratio deteriorated from 2008 to 2009 and from 2009 to 2010

6
Quick Ratio A more specific test of liquidity than the current ratio Measures the firm's liquidity if it doesn't have inventory to sell to meet its short-term debt obligations (cash plus short-term marketable investments plus receivables) divided by current liabilities If the quick ratio is less than 1.0 times, then it has to sell inventory to meet short-term debt, which is not a good position for the firm to be in
 divided by current liabilities If the quick ratio is less than 1.0 times, then it has to sell inventory to meet short-term debt, which is not a good position for the firm to be in")
7
Operating Cash Flow Ratio Operating cash flow relates to cash flows that a company accrues from operations to its current debt Measures how liquidity a firm is in the short run since it relates to current debt and cash flows from operations. If the Operating Cash Flow Ratio for a company is less than 1.0, the company is not generating enough cash to pay off its short-term debt which is a serious situation. It is possible that the firm may not be able to continue to operate. Cash from Operating Activities9,437.007,884.007,935.005,550.006,290.00 Total Current Liabilities12,804.0011,178.0010,144.008,091.006,989.00 Operating cash flow ratio0.7370353010.705314010.7822358040.6859473490.899985692

8
Cash Flow from Operation/ Average Total Liabilities Measures ability to pay its debts over a period of time The higher the ratio, the better the firm's financial flexibility and its ability to pay its debts Cash from Operating Activities9,437.007,884.007,935.005,550.006,290.00 Total Liabilities31,544.0028,836.0025,472.0016,182.0011,853.00 Ratio0.2990.2730.3120.3430.531

9
Cash Flow from Investing For investors, the most important item in this category is capital expenditures. It's generally assumed that this use of cash is a prime necessity for ensuring the proper maintenance of, and additions to, a company's physical assets to support its efficient operation and competitiveness.

10
Cash Flow from Investing Capital Expenditure – Growth: Decreased until 2008; yet increased from 2009 – PM- only capital expenditure of fixed assets – Compared to BTI: BTI seem to have stable capital expenditure (around 480~580M every year) Overall PM spend more
 Overall PM spend more")
11
w

12
Cash Flow from Financing

13
Free Cash Flow Free Cash Flow - Net operating cash flow minus capital expenditures A steady, consistent generation of free cash flow is a highly favorable investment quality PM: steady growth from 2008

Similar presentations


 2004 Prentice Hall, Inc. The Analysis of Financial Statements This chapter will develop tools and.>")


 èProfitability ratios è Single ratio by itself is not very meaningful.>")