Download presentation
Presentation is loading. Please wait.

1
Managed Breeding for Conservation: Sustainability of Ex Situ Populations Kevin Zippel - CBSG/WAZA Amphibian Program Officer Materials produced by: R. Andrew Odum, Curator Department of Herpetology Toledo Zoological Society

2
Why do we maintain records?

3
Records are kept… To manage a collection To manage multiple collections in coordination (population management) To learn about the animals in our charges (Do Science)
 To learn about the animals in our charges (Do Science)")
4
Records are kept… To communicate Records are kept as part of our responsibilities for the animals in our charges

5
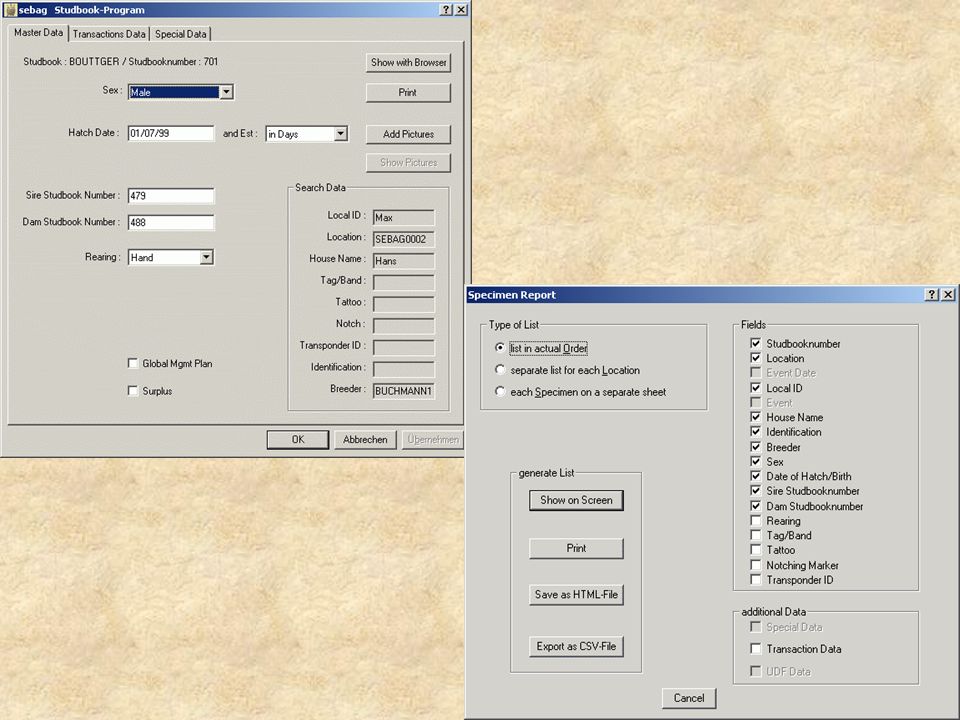
Data for Collection Management Identifiers Sex Parentage Where are they Who are they with What they did while they were here Husbandry Medical

6
Data for population management Genetic –parentage Demographic –Sex –Location –Immigration –Emigration –Births –Deaths

7
Genetic Data Demographic Data Records for Population Management Genetic data is most important! No! Demographic data is most important! You guys sound like a bunch of treefrogs! They are both important!

8
Minimal Data Set How Obtained (demographic) Arrival Data (demographic) Sex (demographic) Birth Date (demographic) Parents (genetic)
 Arrival Data (demographic) Sex (demographic) Birth Date (demographic) Parents (genetic)")
9
Minimal Data Set Death date (demographic) Departure data (demographic) Specimen Identification (acc. #, pit tag, photograph, etc.)
.")
10
Why do we cooperatively manage populations? For preservation of genetic diversity (GD) for the future (The Ark) For future reintroduction To efficiently utilize captive resources
 for the future (The Ark) For future reintroduction To efficiently utilize captive resources.")
11
Preserve Gene Diversity Maintain a specific amount of Gene Diversity (GD) for a specific amount of time e.g. 90% for 100 years THE ARK

12
SPARKS

13
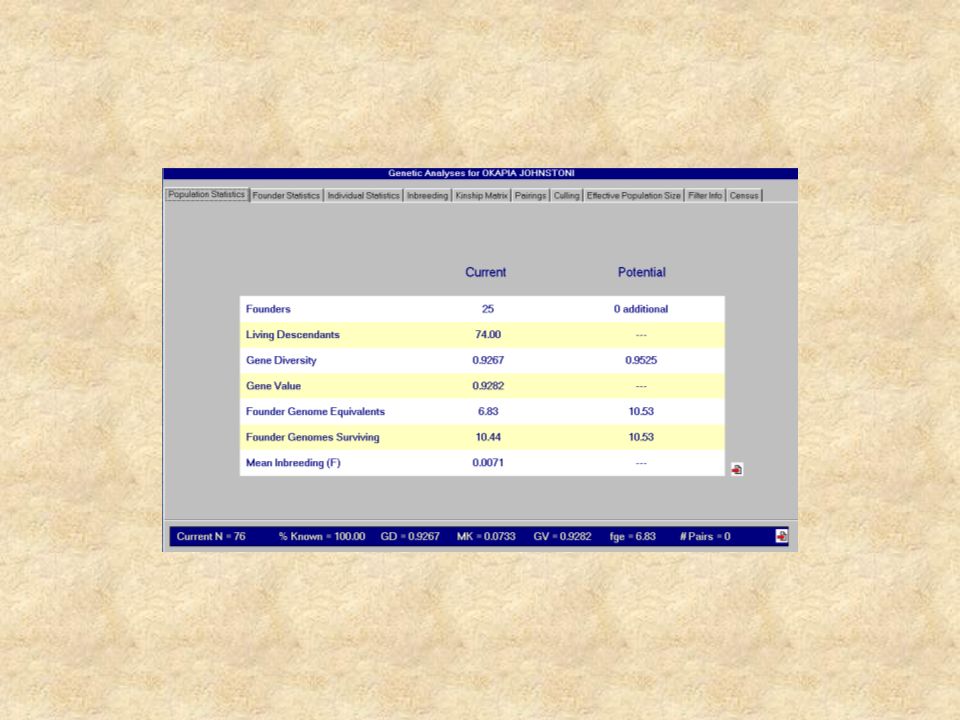
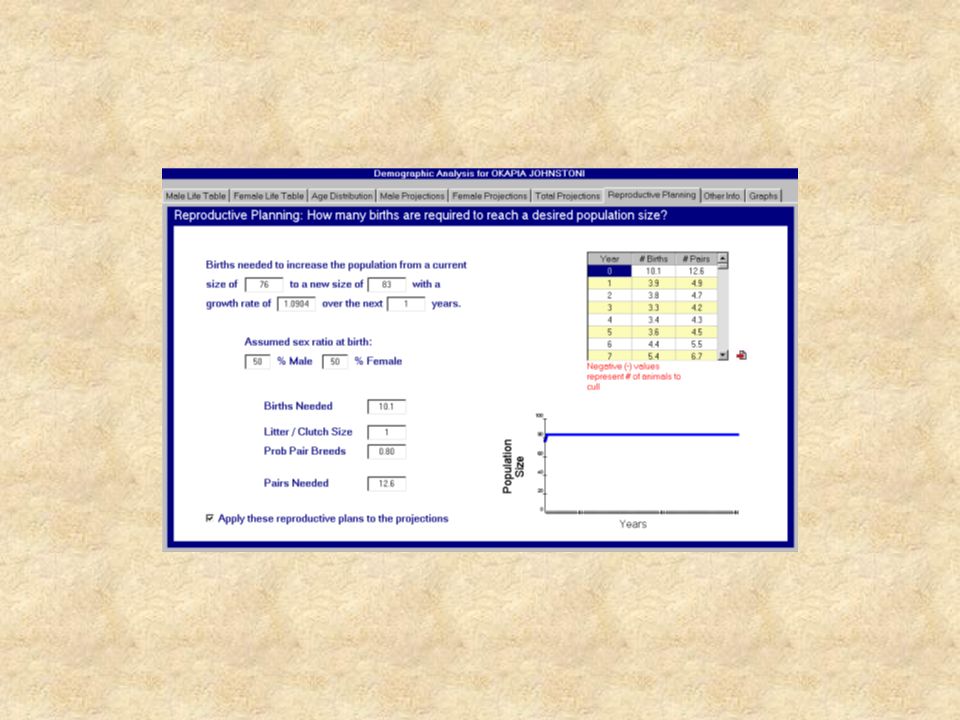
PM-2000

14
Managed vs. Unmanaged Arabian oryx N = 13 in 1965 10 founders N = 416 in 1995 Stable 92% gene diversity Ne/N = 0.30 Mean Inbreeding=0.07 Markhor N = 35 in 1965 11 founders N = 81 in 1995 Unstable 86% gene diversity Ne/N = 0.07 Mean Inbreeding=0.19

15
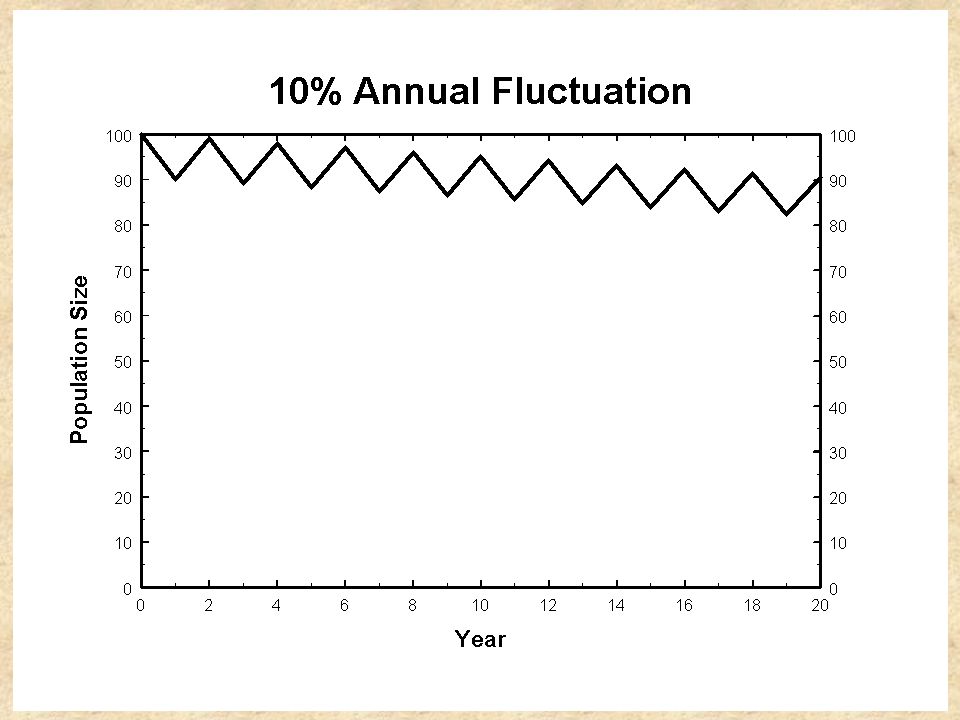
All populations fluctuate: stable populations fluctuate little. 100 @ 10% 100 @ 50% x 0.90 = 90x 0.50 = 50 x 1.10 = 99x 1.50 = 75 x 0.90 = 89x 0.50 = 38 x 1.10 = 98x 1.50 = 56 x 0.90 = 88x 0.50 = 28 x 1.10 = 97x 1.50 = 42 Good years don’t cancel bad years

18
Projection of dolphin population: Initial N = 100; K = 200

19
Projection of dolphin population: Initial N = 10; K = 20

20
Carrying Capacity (N) Founders Expansion Phase Maintenance Phase N Time
 Founders Expansion Phase Maintenance Phase N Time")
21
N t = N t ‑ 1 + (B – D) + (I – E) Factors that effect N from one census to the next Tomorrow Today
 + (I – E) Factors that effect N from one census to the next Tomorrow Today")
22
Loss of Gene Diversity by Drift The problem with small populations ABCD AD BD A D D B Unrelated Animals Allele C is lost

23
Loss of gene diversity due to drift 1000 500 250 100 50 10 Generation % Gene Diversity N

24
Inbreeding Mating between relatives Reduces gene diversity (GD) Greatly increases probability of expressing deleterious alleles Reversible I love my cousin
 Greatly increases probability of expressing deleterious alleles Reversible I love my cousin")
25
Inbreeding 12 34 56 Unrelated Animals Non-inbred offspring Inbred offspring

26
Inbreeding Depression Inbreeding Depression Expressed by XX Following deleterious allele X through a pedigree ABCX AX BX XB XX A B X X X X X B Unrelated Animals Non-inbred offspring Inbred offspring X is a rare deleterious allele

27
Inbreeding reduces fitness Look What I Made Now!

28
Inbred vs. Non-Inbred Crested Wood Partridges at MN Zoo 8% reduction in egg volume 10% reduction in egg weight 20% reduction in hatch rate 51% reduction in 30 day survival Inbred birds have 41% more medical notes than do their non-inbred counterparts!

29
Inbreeding is Reversible If an inbred animal is bred with an unrelated animal, the resulting offspring are not inbred Outbreeding

30
Unrelated Animals Non-inbred offspring Inbred #5 & #6 Unrelated Female Non-Inbred Offspring 12 34 567 8 8 is not inbred, but GD is lost

31
The Bad vs. The Good Small populations Few breeders Isolationist, possessive management Little or no genetic management Poor records Larger populations More breeders Cooperative management Careful genetic management Good records

32
Population Management Goals Maintain 90% gene diversity for 100 years Defined target population size –Founders vs. offspring Stable numbers –Stable age distribution Avoid inbreeding, drift Maximize Ne/N

33
How is managed breeding achieved? data collected compiled at institution - ARKS IV compiled internationally - ISIS (future = ZIMS) polished by studbook keeper - SPARKS management recommendations - PM2000 population modeling - VORTEX
 polished by studbook keeper - SPARKS management recommendations - PM2000 population modeling - VORTEX.")
34
Data to collect Provenance Genetic –Parentage Demographic –Gender –Birth/capture date –Immigration –Emigration –Births/Breeding behavior/Development –Deaths

36
Studbooks 300 Population Management Plans (PMPs) –Designated Population Manager keeps studbook and makes management recommendations 90 Species Survival Plans (SSPs) –Species Coordinator & Management Group elected committee, outside advisors –Established genetic goals for 50-100 years –Participation required of AZA member zoos –Field Conservation integral to program
 –Designated Population Manager keeps studbook and makes management recommendations 90 Species Survival Plans (SSPs) –Species Coordinator & Management Group elected committee, outside advisors –Established genetic goals for years –Participation required of AZA member zoos –Field Conservation integral to program")
37
1. Quantify Inbreeding The Inbreeding Coefficient (F) F = probability that homologous alleles at a random locus are “identical by descent” How to Make Breeding Recommendations?
 F = probability that homologous alleles at a random locus are identical by descent How to Make Breeding Recommendations .")
38
Inbreeding Coefficient F=0 F = 0.25 ABCX AXBX XBXX Inbreeding Coefficients of a Simple Pedigree

39
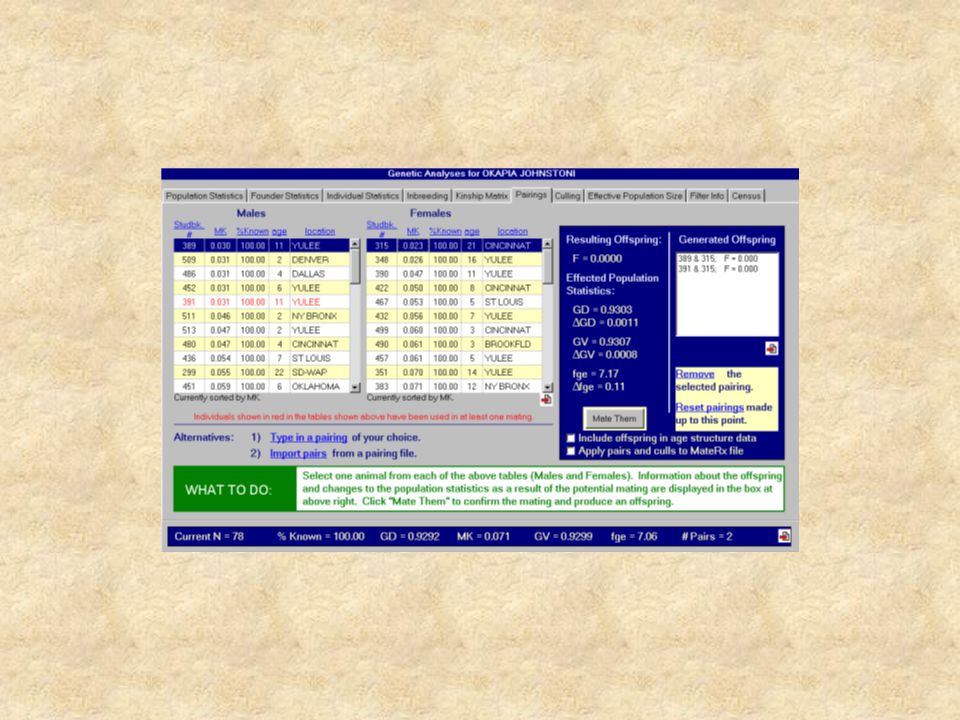
2. Select breeding pairs using the principle of inbreeding coefficient to determine relatedness Kinship How to Make Breeding Recommendations?

40
How related are we? Kinship Kinship Coefficients of a Simple Pedigree 12 34 56 HH F=0 F = 0.25 F = 0.375 k = 0 between #1 and #2 k= 0.25 between #3 and #4 k= 0.375 between #5 and #6 Hypothetical cross of #5 & #6

41
3. Calculate Mean Kinship: the average of all the kinships of an animal to the rest of the population How to Make Breeding Recommendations?

42
MK of Pedigree ALL ANIMALS LIVING MK=0.225 MK=0.3375 MK=0.3875 12 34 567 8 #7 is the most important animal MK=0.4125 MK=0.05 MK=0.2275

43
Mean Kinship Determines Best Pairings Determines Animals to Surplus

47
Incomplete data May remove animals from analysis process May create errors in analysis May prevent analysis

48
Incorrect data May create significant errors in analysis Usually hurts captive population

49
The Future: Applying Our Knowledge Cooperation among institutions Larger populations, backup More breeders Careful genetic management Population planning Group management Good records

50
Population Management is Balanced on Good Records Husbandry DemographyGenetics GOOD RECORDS

Similar presentations