Download presentation
Presentation is loading. Please wait.

1
Information Systems in Organizations 2.1 Analyzing organizations as systems and processes

2
Course Topics Overview Unit 1: Introduction Unit 2: Systems Analysis Unit 3: Organizational Systems Unit 4: Consumer Systems 2

3
Unit 2: Systems Analysis 2.Systems analysis: what makes a system tick? 2.1. Analyzing organizations as systems and processes 2.1.1. Process decomposition: swim lane diagrams 2.1.2. Data modeling: entity relationship diagrams 2.2. Systems architecture: devices, network, data, apps 2.2.1. Visualizing architecture: conceptual diagramming 2.2.2. Ex. of legacy, contemporary, and future information systems 3

4
? What is “systems analysis”? What is “systems architecture”? Problem Solving Technique Decomposition Business Process Modeling What is the problem? What is the solution?

5
Systems Analysis "Systems analysis is a problem solving technique that decomposes a system into its component pieces for the purpose of the studying how well those component parts work and interact to accomplish their purpose" - Wikipedia [ [ "the process of studying a procedure or business in order to identify its goals and purposes and create systems and procedures that will achieve them in an efficient way“ – Merriam-Webster Dictionary So what does a systems analyst do?

6
Systems Architecture Systems Architecture is a generic discipline to handle objects (existing or to be created) called "systems", in a way that supports reasoning about the structural properties of these objects. Systems Architecture is a response to the conceptual and practical difficulties of the description and the design of complex systems. – Boris Golden Once a systems analyst understands the business problem, they architect a solution

7
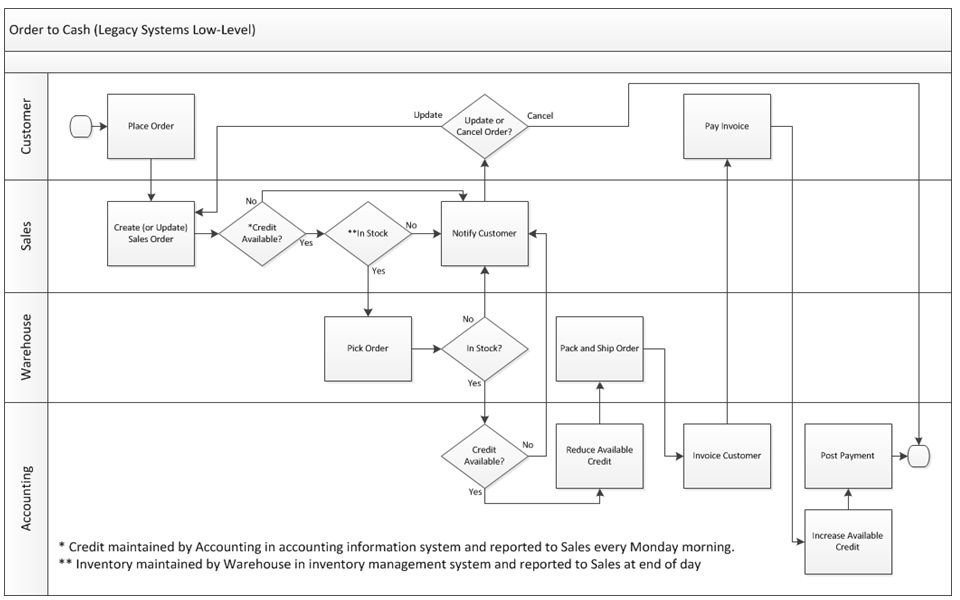
? What is a “swim lane diagram”? How is a process performed? Who does what? When do they do it? What happens before? What happens after?

8
Swim Lane Diagram Who does what and when?

10
? Give me a process and let’s make a swim lane diagram…

11
Learn IT #4 The deliverable for this assignment is a one page swim lane diagram for drive-through ordering at a fast food restaurant. 11

12
? What is an “entity relationship diagram”? Entity = Noun Relationship = Verb Attribute = Characteristic Data Model

13
Entity Relationship Diagram (ERD)
")
14
Primary ERD Symbols

15
Inventory Item Attributes ID Name Description Unit of Measure Weight Serial #

16
Internal ID Name Display Name Description Purchase Description Vendor Name Store Display Name Store Description Units Type Stock Unit Purchase Unit Sale Unit Display in Web Site Purchase Price Preferred Vendor Base Price List Price Online Price Income Account Asset Account Expense/COGS Account Costing Method On Special Tax Schedule On Hand Available On Order Committed Back Ordered Reorder Point Preferred Stock Level Reorder Multiple Drop Ship Item Special Order Item Copy SO Description Weight Weight Units Class Business Unit Date Created Last Modified Inventory Item Attributes

17
? Let’s model the data that is used by the process we modeled earlier…

18
Unit 2: Systems Analysis 2.Systems analysis: what makes a system tick? 2.1. Analyzing organizations as systems and processes 2.1.1. Process decomposition: swim lane diagrams 2.1.2. Data modeling: entity relationship diagrams 2.2. Systems architecture: devices, network, data, apps 2.2.1. Visualizing architecture: conceptual diagramming 2.2.2. Ex. of legacy, contemporary, and future information systems 18

Similar presentations

>")


 4.1.2. Mobile (Smartphones)>")


 is a specialized graphic that illustrates the interrelationships between entities in a database.>")


