Download presentation
Presentation is loading. Please wait.

2
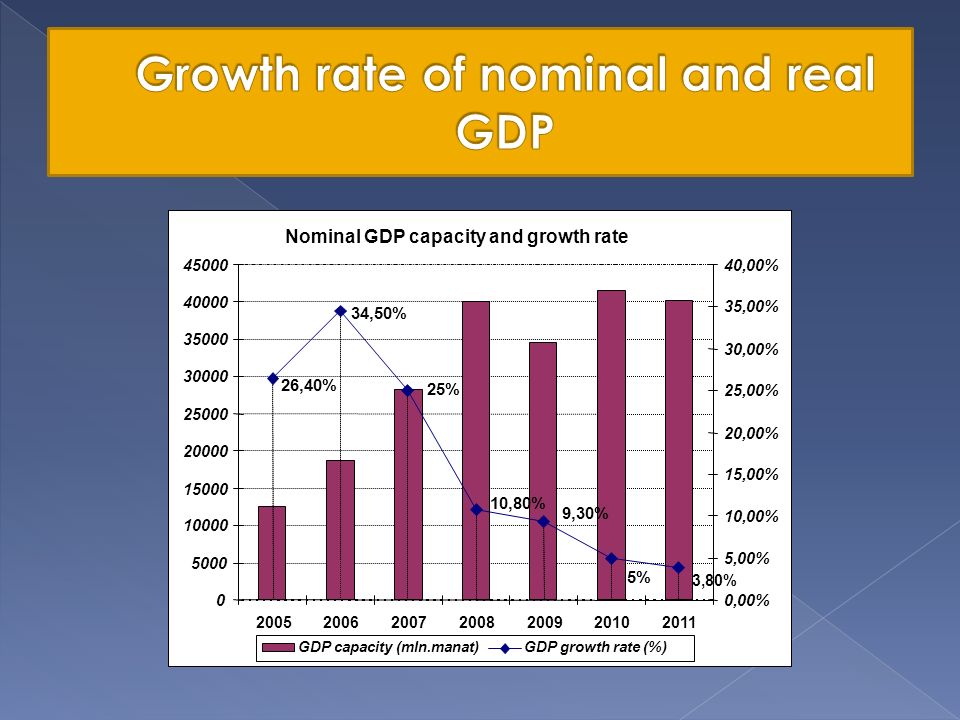
Socio-economic indicators and inflation Years2007200820092010 GDP, mln.AZN Growth rate, % 28360,5 25,0 40137,2 10,8 34578,7 9,3 41600 5.0 GDP per capita, $347456034874,15797,8 Oil GDP, growth rate, %36,86,814,31,8 Non-oil GDP, growth rate, % 11,415,93,27,9 Inflation, % Average yearly16,720,81,55,7 Income of population, growth rate, % 40,337,88,013.3 Average monthly wage, AZN growth rate, % 214,0 42,0 274,4 24,2 298,0 8,6 325 9.1

4
2005-20082009-2010 GDP growth rate, %24.2%7.2% Oil sector growth rate, %42.9%8.3% Non-oil sector growth rate, %11.8%5.6% CPI, %13.9%3.6% Growth rate of nominal incomes, %31.8%10.7% Growth rate of nominal wage, %27.0%8.9% Growth rate of budget expenditure, %64.3%6.8% Growth rate of bank activities, %65%14%

6
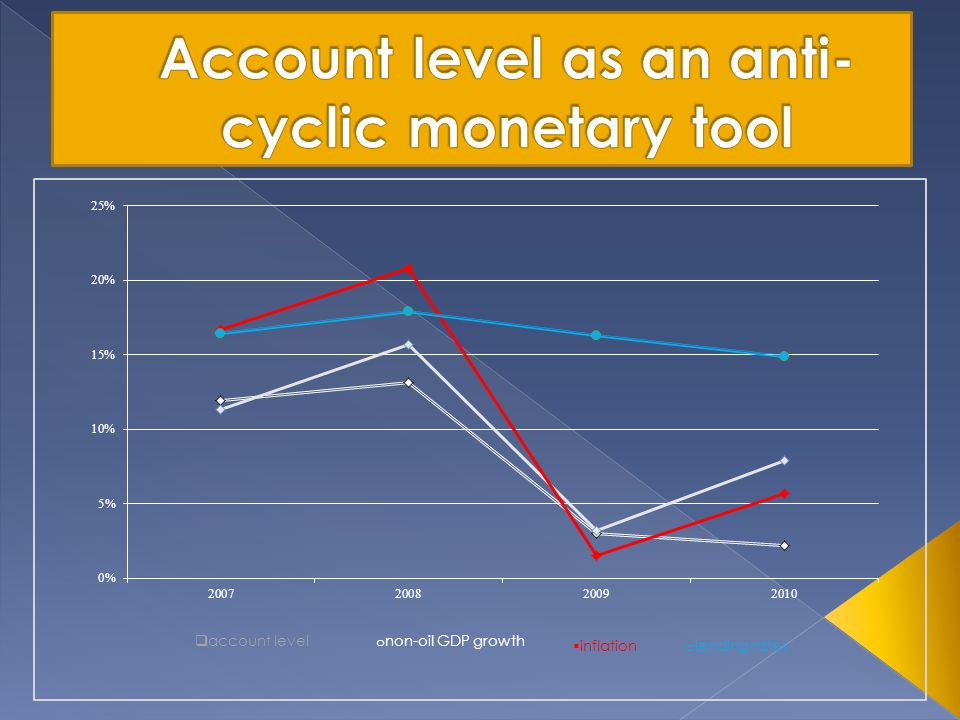
6 Inflation and non-oil GDP

7
7 The growth rate of salary in oil and non- oil sectors Average monthly salary in oil and non-oil sectors (AZN) 0 200 400 600 800 1000 1200 1400 1600 2008200920102011201220132014 OilNon-oil
 OilNon-oil")
8
8 The poverty level, in percent

9
9 Multidimensional Poverty Index, MPI 0.021 Poverty rate on MPI 5.4% The number of population on MPI, mln., person 0.5 Poverty on income (1.25 $ per day) 2% Poverty on income (2 $ per day) 2% Official poverty level (2010) 9.1% Population (mln., 2010) 9.1 HDI, 2010 0.787 104 ölk ə arasında 66 HDI status orta (medium) Multidimensional Poverty Index
 2% Poverty on income (2 $ per day) 2% Official poverty level (2010) 9.1% Population (mln., 2010) 9.1 HDI, ölk ə arasında 66 HDI status orta (medium) Multidimensional Poverty Index")
11
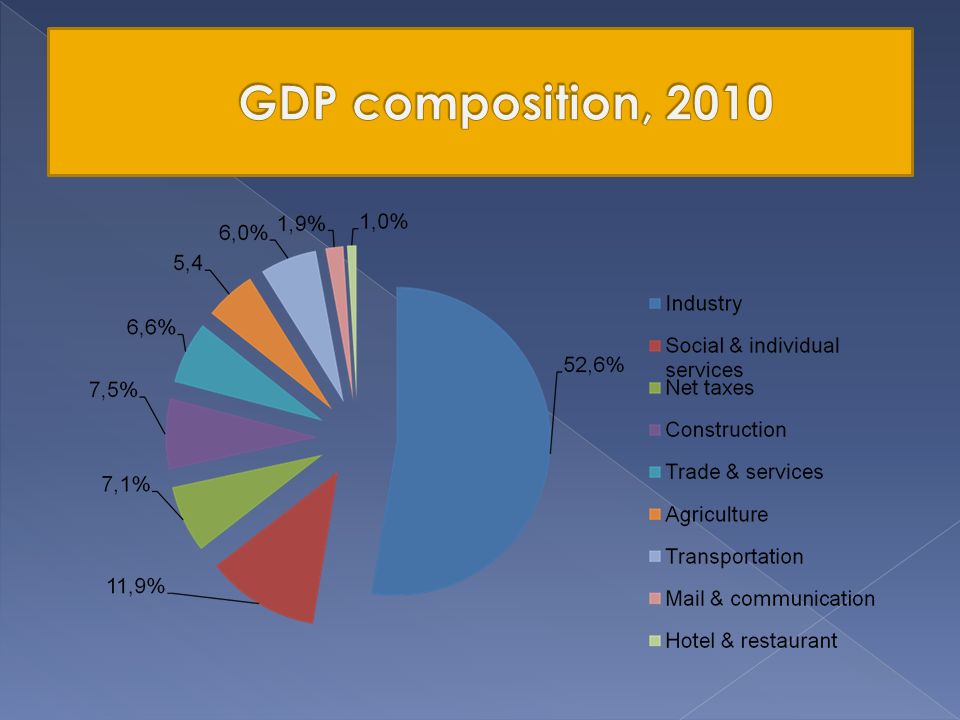
De-industrialization trend in the composition of GDP (over sectors, %) 9,20% 7,10% 6,50% 6,70% 6,80% 6,50% 49,40% 57,30% 59,50% 58,50% 50,00% 52,60% 45,30% 43% 41,00% 9,40% 7,70% 6,70% 7,00% 7,40% 7,50% 9,00% 8,80% 8,60% 24,40% 22,40% 21% 22% 28% 27,40% 31% 32,80% 34,70% 35,20% 7,60% 5,50% 6,60% 6,70% 7,60% 7,10% 8,10% 8,40% 8,70% 5,40% 5,60% 0%20%40%60%80%100% 2005 2006 2007 2008 2009 2010 2011(p) 2012 (p) 2013 (p) 2014 (p) agricultureindustryconstructionservicesnet taxes
 9,20% 7,10% 6,50% 6,70% 6,80% 6,50% 49,40% 57,30% 59,50% 58,50% 50,00% 52,60% 45,30% 43% 41,00% 9,40% 7,70% 6,70% 7,00% 7,40% 7,50% 9,00% 8,80% 8,60% 24,40% 22,40% 21% 22% 28% 27,40% 31% 32,80% 34,70% 35,20% 7,60% 5,50% 6,60% 6,70% 7,60% 7,10% 8,10% 8,40% 8,70% 5,40% 5,60% 0%20%40%60%80%100% (p) 2012 (p) 2013 (p) 2014 (p) agricultureindustryconstructionservicesnet taxes")
16
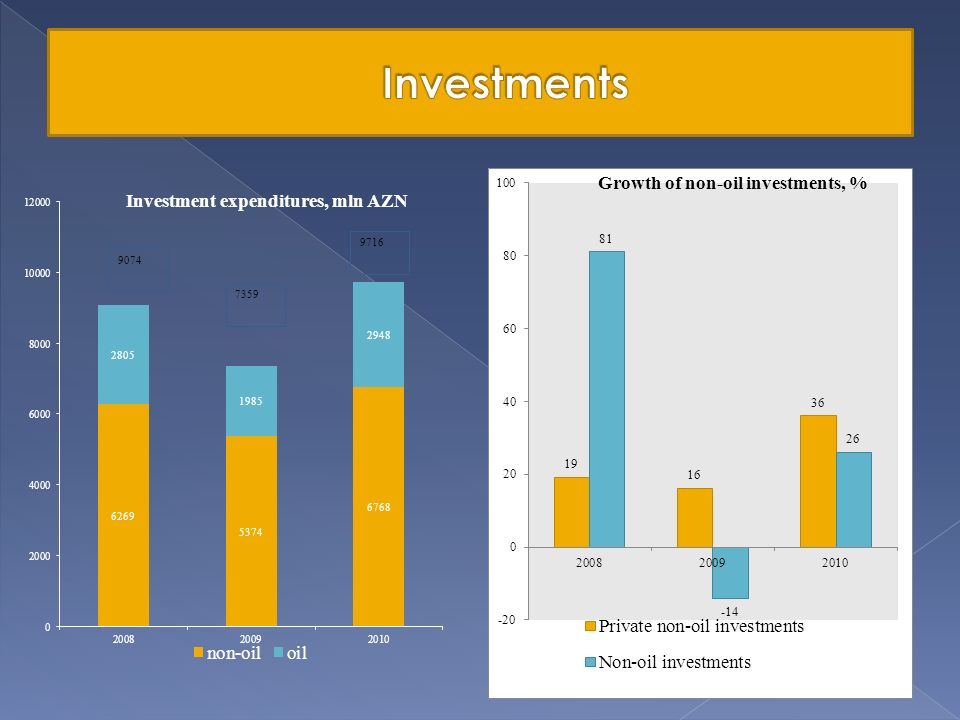
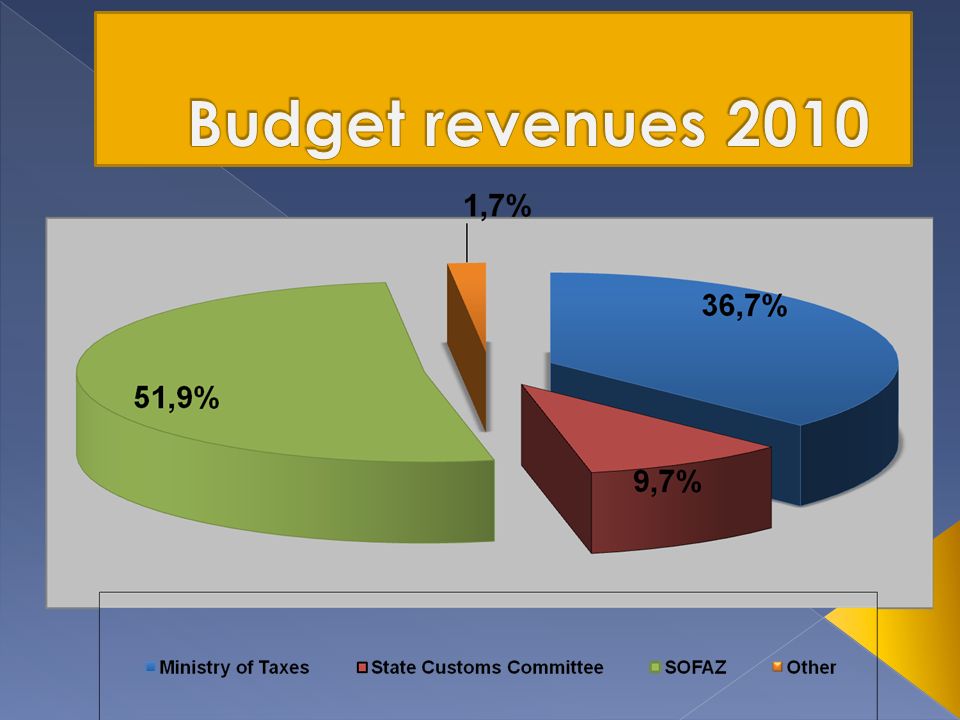
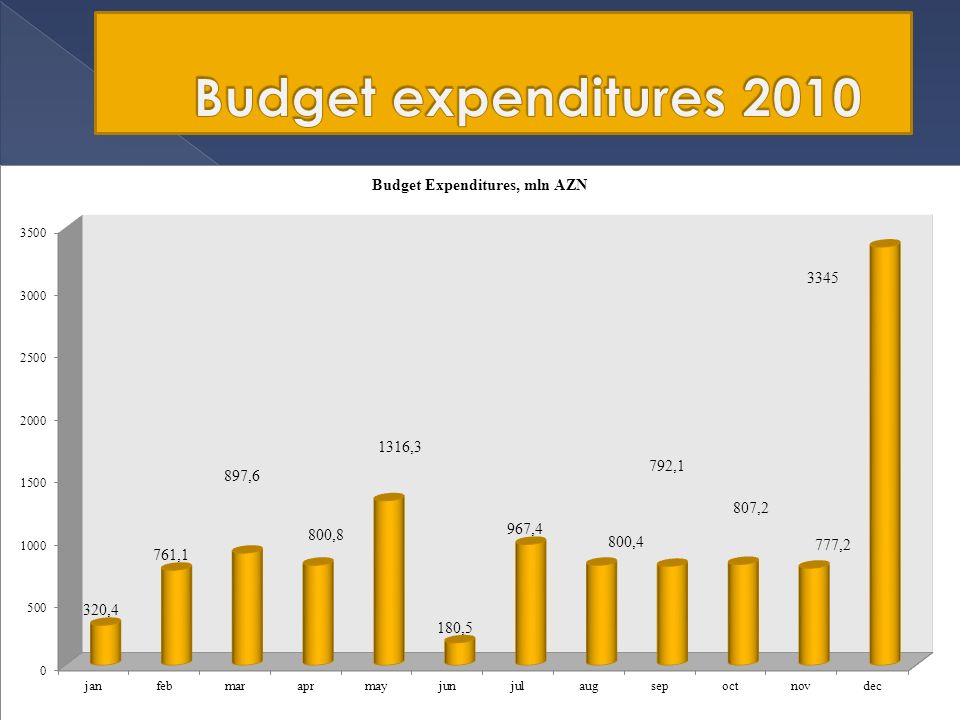
Years20032007200820092010 Incomes of state budget, mln.AZN Growth rate, % 1220,9 34,1 6007,3 55 10763,0 79,2 10325,9 -4,1 11 402,5 10,4 Oil incomes, mln.AZN Growth rate, % 470 35,8 3564 58 7299,6 104,8 6897 -5,5 7177 4,5 Non-oil incomes, mln.AZN Growth rate, % 751 32,9 2443,3 51 3463,4 41,8 3429,0 -1,0 4223 23,1 State budget expenditure, mln.AZN Growth rate, % 1235 32,5 6058,7 6,0 10680,0 76,3 10567,0 -1,9 11 766,0 12 Including investment expenditure, mln.AZN Growth rate, % 901915 2,2 times 4276,0 2,1 times 3177,0 -25,7 4 147,0 16,3

26
1. Considering the risk of continuing growth rate of the economy after 2011, the procyclic macroeconomic policy should be replaced with the sustainable economic development-based macro-economic policy; in addition, dependence of the economic growth rate on crude oil prices should be gradually neutralized; 2. Problems in GDP structure, specifically the risks of determining role of consupmtion and capital accumulation should be considered in macroeconomic policy; 3. Particular strategy should be developed for the development of the agricultural sector and non-oil industry and the control over the implementation of state programs should be accelerated; 4. Business and investment climate should be developed in order to further increase the share of non-oil sector in investments and the GDP;

27
5. New phase of government assistance to entrepreneurship should be launched to Qeyri-neft ixrac potensialını v ə vergitutma bazasını genişl ə ndirm ə k üçün sahibkarlığa dövl ə t köm ə yinin yeni m ə rh ə l ə si başlanılmalı; 6. Addressed “agitation” policy should be realized to decrease the salaries difference between the economic sectors (for example, application of alleviated tax and social payment rates for the entities in the non-oil sector where salaries are lower than in the oil sector); 7. Improvement of the national accounting system and statistics on macroeconomic indicators and poverty; 8. Permanent and unchangable incomes approach should be applied to the oil revenue expenditures, as envisaged in the “Long-term strategy on oil and gas revenue management”;
; 7. Improvement of the national accounting system and statistics on macroeconomic indicators and poverty; 8. Permanent and unchangable incomes approach should be applied to the oil revenue expenditures, as envisaged in the Long-term strategy on oil and gas revenue management ;.")
28
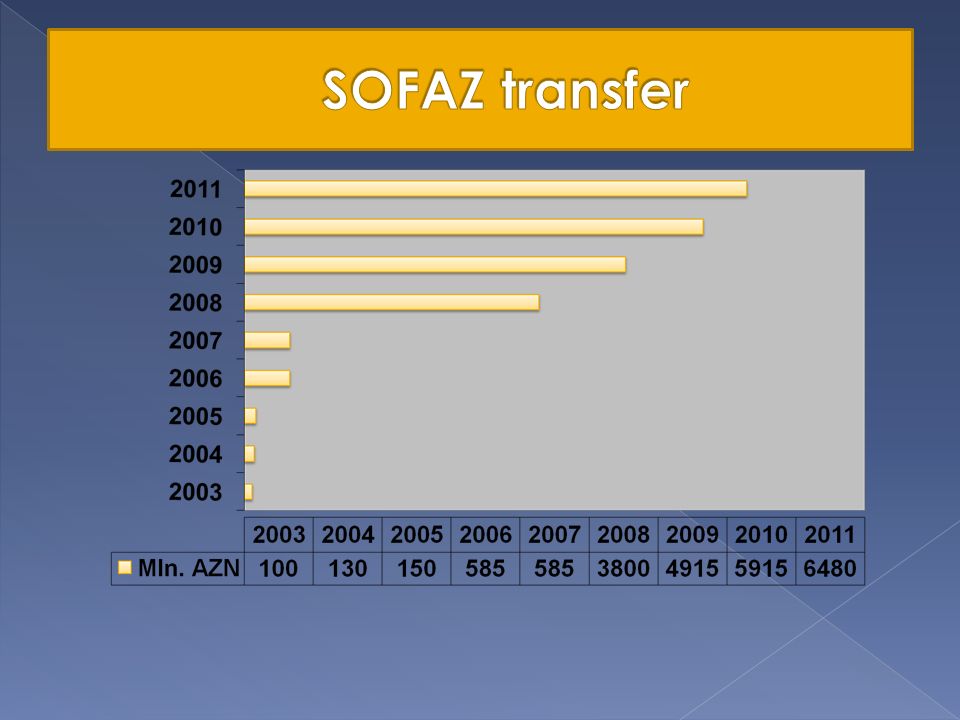
9. Financial policy directive, based on solid foundations, should be adopted on “Fund-budget” relations münasib ə tl ə ri and transfers from SOFAZ should be limited to particular amount of its assets; 10. Azerbaijani government should add a stronger strategic composition to the budget and align the fiscal policy with the strategcy and programs related to the medium and long-term development of the country; 11. Structural reforms should be undertaken in the state management, decentralization policy should be expanded and financial independence given to the health and educational institutions in the first place in the frame of fiscal decentralization reforms in Azerbaijan; 12. Classification of expenditures on paragraphs, articles and items subject to ammendments according to the decision of the Cabinet of Ministers on approval of the “Unified budget classification of Azerbaijan Republic” should be complied with the real needs;

29
13. Tax administration should be improved to increase the coefficient of direct tax incomes collection in provision of state budget incomes; regulative and stimulating, aside from fiscal functions of the taxes, should be strengthened and the sources of tax debts emergence researched. 14. The budget deficit, along with the other fiscal parameters, should also be forecasted for the medium term period at the level, not harmful for the macroeconomic stability and the sources of its coverage be complied with the general fiscal policy; 15. Considering that the increase of state expenditures is among the factors seriously affecting the inflation, it is important that they grow in tact with absorption capacity of the economy. Thus, the absorption capacity of the economy should be considered in budget increases, alongside with the principle of stability; 16. Competitiveness in the bank sektor should be increased, power concentration decreased and administrative distortion eliminated in the credit market to manage the growing risks in the bank sector and prevent the possible crisis.

30
Gubad Ibadoglu: gubad.ibadoglu@gmail.comgubad.ibadoglu@gmail.com Kenan Aslanli: kenan.aslanli@yahoo.comkenan.aslanli@yahoo.com Sohrab Farhadov: sohrabfarhadov@yahoo.comsohrabfarhadov@yahoo.com National Budget Group Baki, Azerbaijan AZ 1065 44, Jafar Jabbarli str., Caspian Plaza 3, floor 9 Phone: (+99412) 437 18 20 E-mail: office@nbg.azoffice@nbg.az www.nbg.az www.budget.az
")
Similar presentations


 10 March, 2014 In Seoul, Korea Ministry of Finance PRESENTATION AT THE PLENARY SESSION DEVELOPMENT COOPERATION.>")


![ÜNVAN Bakı, AZ1078, C.Məmmədquluzadə küç, 998-ci məhəllə TELEFON/FAKS [994 12] 596 66 69 PERSPECTIVES OF LIFE.](/15/4725389/big_thumb.jpg "ÜNVAN Bakı, AZ1078, C.Məmmədquluzadə küç, 998-ci məhəllə TELEFON/FAKS [994 12] 596 66 69 PERSPECTIVES OF LIFE.>")


