Download presentation
Presentation is loading. Please wait.

1
PRESENTATION ON RABI REVIEW AND KHARIF PROSPECTS NATIONAL CONFERENCE ON AGRICULTURE FOR KHARIF CAMPAIGN 2010 Gurbachan Singh Gurbachan Singh Agriculture Commissioner Ministry of Agriculture Krishi Bhavan, New Delhi Email : ag.comm@nic.in

2
Rabi Review Kharif Prospects Second Green Revolution : The Way Forward

3
4.17 m ha less coverage in rice 4.17 m ha less coverage in rice More area under sorghum and maize More area under sorghum and maize 0.61 m ha more coverage under pulses 0.61 m ha more coverage under pulses 0.60 m ha less coverage in Oilseeds 0.60 m ha less coverage in Oilseeds Kharif rice production less by 12.04 m t Kharif rice production less by 12.04 m t 0.48 m t less pulses 0.48 m t less pulses More area coverage in cotton 10.3 m ha compared to 9.40 m ha last year More area coverage in cotton 10.3 m ha compared to 9.40 m ha last year Oilseeds production 16.19 m t against 17.81 m t in 2008- 09 Oilseeds production 16.19 m t against 17.81 m t in 2008- 09 Overall Kharif foodgrain production less by 18.03 m t compared to 2008-09 Kharif 2009 at a Glance : Abnormal Southwest Monsoon

4
Strategy worked out to compensate kharif loss in Rabi Late rains (end of kharif season): Rabi prospects brightened with early sowing of oilseeds, pulses and rainfed wheat 102.3% area coverage compared to normal area under Rabi 117.3% area under pulses as compared to normal Less coverage under oilseeds mainly due to less coverage of mustard in Rajasthan Rabi Scenario 2009-10
: Rabi prospects brightened with early sowing of oilseeds, pulses and rainfed wheat 102.3% area coverage compared to normal area under Rabi 117.3% area under pulses as compared to normal Less coverage under oilseeds mainly due to less coverage of mustard in Rajasthan Rabi Scenario")
5
Overall about 2.2 lakh ha more coverage compared to last year Good timely rains in M.P., U.P. and some other States : M.P. and U.P. may harvest record wheat production. No major pest menace, bright sunshine and continued prolonged moderate winter temperatures will contribute for enhanced productivity. No significant frost damage on winter crops in north- west India Record wheat production is expected during 2009-10

6
Rabi Area Coverage as on 12.03.2010 Crop Normal Area This year Last Year + over last year Wheat270.98278.16275.89+2.27 Rice39.8040.2944.22-3.93 Jowar47.5245.6949.42-3.73 Maize8.7011.6111.74-0.13 Barley6.857.607.17+0.43 Total Coarse Cereals Cereals62.5365.2768.72-3.45 Pulses119.47144.35137.07+7.28 Total foodgrains coverage 492.72528.07525.90+2.17 (in Lakh ha)
")
7
Second Advance Estimates of Production of Foodgrains CropSeason2008-092009-10 2 nd Adv. Estimates Final Estimates Target 2 nd Adv. Estimates RiceKharif85.5084.9086.0072.90 Rabi13.4014.3014.5014.70 Total98.9099.20100.5087.60 Wheat77.8080.7079.0080.30 C.CerealsKharif27.7028.5032.7022.80 Rabi9.3011.5010.4011.50 Total37.0040.0043.1034.30 CerealsKharif113.10113.50118.7095.60 Rabi100.50106.40104.00106.50 Total213.60219.90222.60202.10 Total Pulses Kharif4.804.706.504.20 Rabi9.409.9010.0010.50 Total14.2014.6016.5014.70 Total foodgrains Kharif118.00118.10125.2099.90 Rabi109.90116.30114.00117.00 Total227.90234.50239.10216.90 (Million tons) Source : DAC
 Source : DAC.")
8
Second Advance Estimates of Production of other Crops CropSeason2008-092009-10 2 nd Adv. Estimates Final Estimates Target 2 nd Adv. Estimates Total Nine Oilseeds (lakh t) Kharif163.23178.10194.00161.91 Rabi96.3799.11122.00101.31 Total259.60277.19316.00263.22 Cotton* (Total) (lakh Bales each 170 kg) 221.67222.76260.00223.18 Jute (lakh Bales each 180 kg) 102.5496.33102.0097.00 Mesta( lakh Bales each 180 kg) 7.847.3010.006.57 Jute and Mesta 110.38103.65112.00103.57 Sugarcane (cane) (lakh t ) 2904.492850.2934002512.68 Source : DAC
 Kharif Rabi Total Cotton* (Total) (lakh Bales each 170 kg) Jute (lakh Bales each 180 kg) Mesta( lakh Bales each 180 kg) Jute and Mesta Sugarcane (cane) (lakh t ) Source : DAC.")
9
Super Imposing Rainfall Temperature MSP Seeds Fertilizers Others

10
Super Imposing Rainfall Temperature MSP Seeds Fertilizers Others

11
Planning for Kharif 2010 Likely Monsoon Scenarios Below normal like 2009 Below normal like 2009 Normal Normal Above normal Above normal Pre-monsoon good showers Pre-monsoon good showers Early onset early withdrawal Early onset early withdrawal Late onset, early / late withdrawal Late onset, early / late withdrawal Timely onset – long break – late revival – extended phase Timely onset – long break – late revival – extended phase Extended monsoon (End September) Extended monsoon (End September) Matching seeds, seedlings, fertilizers, machinery, plant protection, mulching materials etc. (contingency plans) Matching seeds, seedlings, fertilizers, machinery, plant protection, mulching materials etc. (contingency plans)
 Matching seeds, seedlings, fertilizers, machinery, plant protection, mulching materials etc. (contingency plans).")
12
In situ / ex situ rain water conservation Availability of seed, fertilizers (P and K needed at sowing), plant protection equipments and pesticides etc. Promotion of yield enhancing practices SRI SRI Quality Seeds / Hybrids Quality Seeds / Hybrids Conservation / Precision Agriculture Conservation / Precision Agriculture Integrated Nutrient, Water and Pest Management Strategies Integrated Nutrient, Water and Pest Management Strategies Water, Fodder and Feed Availability for Animals Hints for Productivity Enhancement : Advance Planning

13
All India Position of Requirement And Availability of Certified Seed During Kharif 2010 CropsRequirement Quantity in Qtls AvailabilitySurplus/Deficit Paddy53539065999845645939 Ragi27241308743633 Kodo40042929 Maize755761903034147273 Bajra25460829509440486 Jowar15710517442017315 Total Cereals 65490217403696854675 Urd13398418810954125 Cowpea2145820529-929 Moong17961218987310261 Horsegram3728650-3078 Field Bean 3503500 Moth153005759-9541 Arhar20067722698526308 Rajmash1102700-402 Total Pulses 55621163295476743

14
All India Position of Requirement and Availability of Certified Seed During Kharif 2010 Quantity in Qtls RequirementAvailabilitySurplus/Deficit Castor437166437820662 Groundnut18259672006427180460 Niger15171069-448 Til20502274886986 Soybean29625153580675618160 Sunflower45001522957294 Total Oilseeds 48992185732332833114 Cotton19268625332060634 Total Fibre 23107828836157283 Bajra, Napier Hybrid 25250 Guar76003848308827 Sudan Grass 2002000 Total Fodder 76228850558827 Grand Total 12311756141423991830643

15
Issues Declining levels of soil organic matter Widening N: P : K Ratio Widening N: P : K Ratio Micro-nutrient deficiencies Micro-nutrient deficiencies Declining response in terms of grains / kg fertilizer Declining response in terms of grains / kg fertilizer Heavy metal pollution Heavy metal pollution Low nutrient use efficiency Low nutrient use efficiencyStrategies Site Specific Nutrient Management : Soil testing labs and soil health cards Fertilizer use as per ICAR /SAU’s Maps Integrated Nutrient Management Conservation Agriculture Practices NBS: Balanced Nutrition Issues and Strategies Related to Soil Health Management

16
Current status of nutrient use efficiencyNutrient Efficiency percentage N30-50 P10-20 K<80 S8-12 Zn2-5 Fe1-2 Cu1-2 Mn1-2

17
Measures to increase nutrient use efficiencyMeasureNutrient Increase in nutrient use efficiency(%) Split vs. single dose application N15-20 Furrow placement vs broadcast application PK20-30 The incorporation of urea super granules (USG)vs split application N20 The foliar vs basal application Micro-nutrients15-20 Neem coated vs prilled urea N5-10 Preferential application of phosphorus to wheat in rice-wheat sequence P50
vs split application N20 The foliar vs basal application Micro-nutrients15-20 Neem coated vs prilled urea N5-10 Preferential application of phosphorus to wheat in rice-wheat sequence P50.")
18
Area under important pulse crops and major pulse producing States Major Crops Major States Crop Area (%) State Production (%) Chickpea39Maharashtra20 Pigeon pea 21M.P.17 Mung bean 11Rajasthan11 Urad bean 10U.P.11 Lentil7A.P11 Peas5 70% of Total Production Current Production : 14.7 m t By 2020 : 22-24 m t Productivity : : 659 kg / ha Import 3-4 m t / year Prices quite high Other countries 1700-2000 kg/ha
 State Production (%) Chickpea39Maharashtra20 Pigeon pea 21M.P.17 Mung bean 11Rajasthan11 Urad bean 10U.P.11 Lentil7A.P11 Peas5 70% of Total Production Current Production : 14.7 m t By 2020 : m t Productivity : : 659 kg / ha Import 3-4 m t / year Prices quite high Other countries kg/ha")
19
Pulses production : Constraints & Strategies ConstraintsStrategies Poor genetic potential Inadequate quality seed availability Marginal soils /85% under rainfed Inadequate nutrition Pests : YVM, Seed treatment MSP and Trade Genetic potential Quality seeds Area expansion : Rice fallows (4 m ha) and summer moong Cropping intensity : Intercropping Diversion of upland rice area (productivity < 1.5 t/ha) Pigeon pea on rice bunds INM / IPM modules Site specific sowing and harvesting machines Blue bulls MSP and procurement
 and summer moong Cropping intensity : Intercropping Diversion of upland rice area (productivity < 1.5 t/ha) Pigeon pea on rice bunds INM / IPM modules Site specific sowing and harvesting machines Blue bulls MSP and procurement")
20
States with productivity less than national average Crop Wheat West Bengal, Gujarat, Uttarakhand, Bihar, M.P. Maharashtra Rice U.P., Jharkhand, Assam, Bihar, Orissa, Maharashtra, Chattisgarh Pulses Maharashtra, Chattisgarh, Orissa, Rajasthan, Karnataka Oilseeds West Bengal, Uttar Pradesh, Maharashtra, A.P., Karnataka Source : Paper circulated during Chief Ministers Conference on 6.2.2010

21
CAGR Yield Analysis of Major Crops – Rice State Yield (Kg / Hectare) CAGR of yield (2003-4 to 2007-08) 2003-042007-082008-09* Punjab2.13369440194022 A.P.2.67300933443247 Haryana5.16274933612726 W.B0.69250425732646 T.N5.11230828172510 Karnataka2.54237526252434 U.P.-1.45218720632171 Jharkhand4.45169520181947 Assam-1.77153414281720 Bihar-5.07152312371610 Orissa3.15149616941520 Maharashtra0.67185319031506 Chattisgarh-0.14145414461176 All India 1.45207822022186 Target CAGR 1.05 Note:* 4 th Advance Estimates **Working Group of Planning Commission (Based on TE 2006-07); Yellow : States showing CAGR less than target CAGR Green: States showing more than target CAGR
 CAGR of yield ( to ) * Punjab A.P Haryana W.B T.N Karnataka U.P Jharkhand Assam Bihar Orissa Maharashtra Chattisgarh All India Target CAGR 1.05 Note:* 4 th Advance Estimates **Working Group of Planning Commission (Based on TE ); Yellow : States showing CAGR less than target CAGR Green: States showing more than target CAGR")
22
PulsesState Yield (Kg / Hectare) CAGR of yield (2003-4 to 2007-08) 2003-042007-082008-09* U.P-4.78890731908 A.P.9.09567803821 M.P.-5.39761609810 Bihar0.13814818804 Gujarat3.06748843757 Maharashtra7.00569746555 Chattisgarh-0.91608586546 Orissa4.01382446473 Rajasthan-9.19590401467 Karnataka14.98304531465 All India -0.43635625655 Target CAGR** CAGR**0.24 Note:* 4 th Advance Estimates **Working Group of Planning Commission (Based on TE 2006-07); Yellow : States showing CAGR less than target CAGR: Green: States showing more than target CAGR
 CAGR of yield ( to ) * U.P A.P M.P Bihar Gujarat Maharashtra Chattisgarh Orissa Rajasthan Karnataka All India Target CAGR** CAGR**0.24 Note:* 4 th Advance Estimates **Working Group of Planning Commission (Based on TE ); Yellow : States showing CAGR less than target CAGR: Green: States showing more than target CAGR")
23
Second Green Revolution : The Way Forward 1. High potential low productivity areas (Eastern U.P., Bihar, West Bengal, Orissa, Jharkhand and Chattisgarh) - Extending Green Revolution to ER – 400 crores 2.Sustaining productivity in high productivity zones (Punjab, Haryana, Western U.P.) 3.Improving productivity in Coastal States - Multiple use of resources for mixed farming - Rain water harvesting / ground water recharge - DHORUV Technology
 - Extending Green Revolution to ER – 400 crores 2.Sustaining productivity in high productivity zones (Punjab, Haryana, Western U.P.) 3.Improving productivity in Coastal States - Multiple use of resources for mixed farming - Rain water harvesting / ground water recharge - DHORUV Technology.")
24
4.ENHANCING RAIN WATER UTILIZATION (currently 29% is utilized) India largest ground water user in the world Exploiting 230 cubic kilometers of groundwater every year (1/4 th of global total) Exploiting 230 cubic kilometers of groundwater every year (1/4 th of global total) GW supports 60% irrigation and 80% rural and urban water supply GW supports 60% irrigation and 80% rural and urban water supply 29% of ground water blocks are semi-critical, critical and over exploited By 2025, an estimated 60% of GW blocks will be in a critical situation Country receives average annual rainfall of about 1 meter Hardly 29% of rainfall utilized. Can it be increased to 40, 50, 60 ??? In – situ / ex – situ conservation / Ground water recharge Crop diversification from high to low water demanding crops Second Green Revolution : The Way Forward

25
Rain water Harvest : The Best Option

26
5.Surplus food from small farm holdings through multienterprize agriculture Nearly 50% farmers cultivate less than one hectare Nearly 50% farmers cultivate less than one hectare Integrated farming system approach Integrated farming system approach Regular income and employment Regular income and employment A way to organic farming A way to organic farming Rs. 300 – 400 net income / day from one ha holding Rs. 300 – 400 net income / day from one ha holding A way to coup up with predicted climate change A way to coup up with predicted climate change Nutritional security Nutritional security Second Green Revolution : The Way Forward

27
Multi enterprise Model

28
Second Green Revolution : The Way Forward 6.Soil and water conservation strategy for hilly and foot hill zones 7.Soil health and water quality issues vis-à-vis human and animal health 8.Bridging yield gaps between frontline demonstrations and district average yields 9.Area expansion through the reclamation of nearly 120 m ha waste lands : salt affected, acidic, eroded, ravines etc (dovetailing of Central Schemes like NREGA, RKVY, NHM etc.)
")
29
Flouride Toxicity Saline Waterlogged Soils Arsenic Toxicity

30
Second Green Revolution : The Way Forward 10Couping-up strategies for predicted climate change : droughts, floods, heat and cold waves, frost etc 11.Conversion of waste into wealth : effective utilization of agricultural residues, waste water, use of industrial effluents 12.Remote sensing, GIS, GPS and Satellite techniques in assessment, implementation and monitoring of agricultural systems : Area coverage, crop condition and natural resources 13.Alternative livelihood opportunities in risk prone areas / alternative sources of food

31
Cold Wave of 2002-03 : Experience at Dehradun

32
Mango damaged by cold wave

33
( a )
")
34
Cold wave damaged crops of (a) tomato and (b) potato ( b )
 tomato and (b) potato ( b )")
35
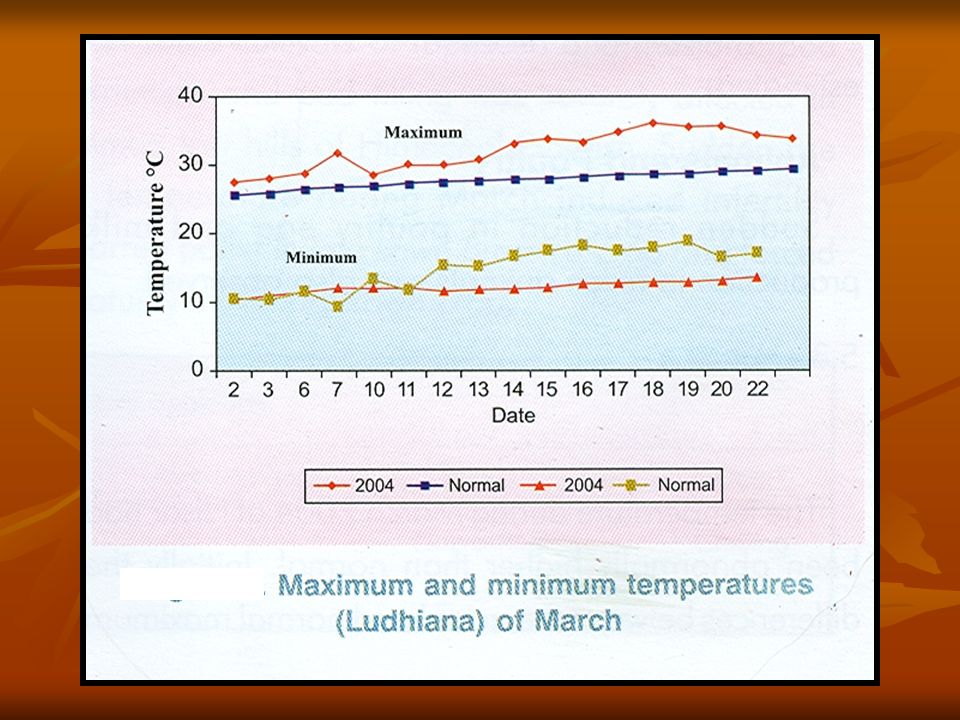
Heat wave of March, 2004

37
Prosopis juliflora pods: An alternate source of human food and animal feed Alternate food, fodder and energy sources in dry areas

38
14.Effective working together mechanisms between research, development and policy at the district / block levels to ensure : Farmers participatory seed production (KVK’s, SAUs, Agriculture Departments, NGO’s Private Sector etc. at the district / block level ) Farmers participatory seed production (KVK’s, SAUs, Agriculture Departments, NGO’s Private Sector etc. at the district / block level ) Revisiting productivity of Central and State owned farms Revisiting productivity of Central and State owned farms Weather based forewarning advisories at the district level Weather based forewarning advisories at the district level 15.Food Saved is Food Produced (post harvest and storage losses) Second Green Revolution : The Way Forward
 Farmers participatory seed production (KVK’s, SAUs, Agriculture Departments, NGO’s Private Sector etc. at the district / block level ) Revisiting productivity of Central and State owned farms Revisiting productivity of Central and State owned farms Weather based forewarning advisories at the district level Weather based forewarning advisories at the district level 15.Food Saved is Food Produced (post harvest and storage losses) Second Green Revolution : The Way Forward.")
39
THE MESSAGE : Harvest and Store Rain water for Present and Future Generations

Similar presentations

, Crop, Directorate of Agriculture, Bihar, Patna. E.Mail:- 1.>")


 ICAR, Krishi Bhawan, New Delhi Workshop on “Agricultural.>")


