Download presentation
Presentation is loading. Please wait.

1
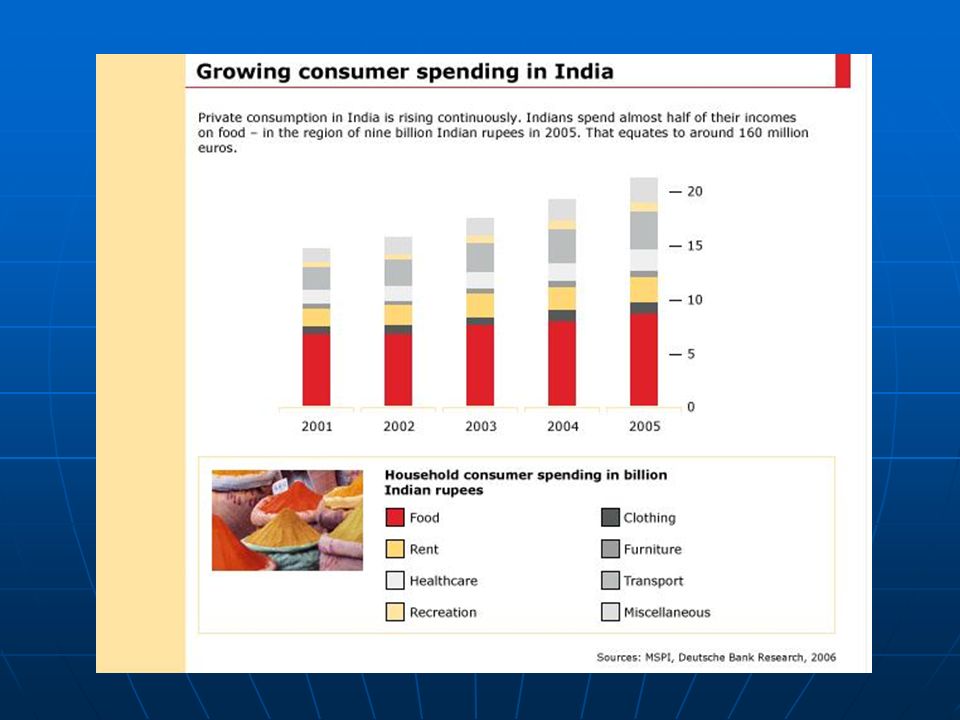
Mechel S. Paggi Director, Center for Agricultural Business California State University, Fresno Supply Chains for Food Trade in Asia: Implications for U.S. Farm Policy* * This presentation was prepared in collaboration with Dr. Tom Reardon, Professor, Michigan State University and Dr. Tom Wahl, Professor and Department Chairman, North Dakota State University based on ongoing research funded by the California Department of Agriculture. Domestic and Trade Impacts of U.S. Farm Policy: Future Directions and Challenges November 16, 2007 Washington, D.C.

2
Introduction Dynamics of the Asian Dynamics of the Asian Food Supply Chain Linkages to U.S. Farm Policy? Linkages to U.S. Farm Policy?& Thoughts on the Future

3
Reality of the Present & Promises For the Future Asia is a Big Market & Asia is where the Money and People Will Be in the Near Future

4
Rapidly Shifting Nature of Asian Food Economy … almost defies description

5
Markets Flourishing

6
[Shenzhen in 1980 and 2000, S. China borer Hong Kong] Urbanizing
![[Shenzhen in 1980 and 2000, S. China borer Hong Kong] Urbanizing](http://images.slideplayer.com/25/7710686/slides/slide_6.jpg "[Shenzhen in 1980 and 2000, S. China borer Hong Kong] Urbanizing")
7
Industrializing

8
Westernizing

9
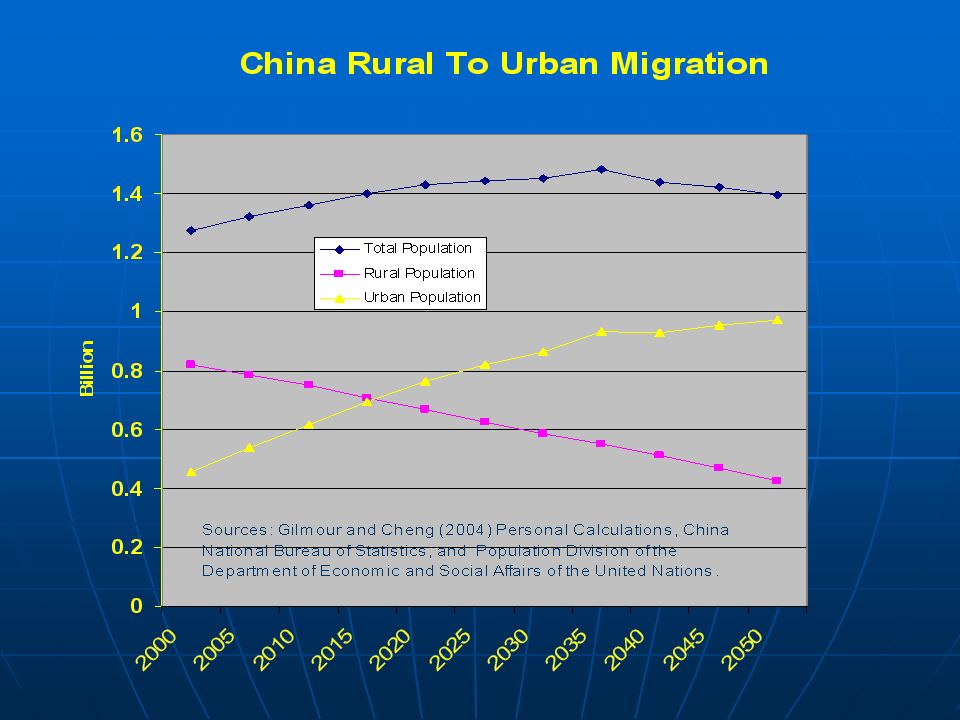
1.3 billion People 1.3 billion People Biggest consumption push will come over the next 20 years when hundreds of millions of rural residents migrate to the city Biggest consumption push will come over the next 20 years when hundreds of millions of rural residents migrate to the city Huge Market Potential

10
Overall Increase in Off-farm Work 2004 More than 150 million people shifted to the off farm sector between 1980 and 2004 Off farm Employment 2015 200019901980 >150 mil Rozelle, Jikun, Reardon, et. al survey 2005 1.3 billion 800 million rural 200 million farmers

16
Korea

17
The Food Market Place is Changing To Accommodate the Changing Consumers

18
Korean Food Retail Market (Food share in sales) (Fresh Produce share in sales) Korean Food Retail Market (Food share in sales) (Fresh Produce share in sales) Supermarket (80%) (35%) Supermarket (80%) (35%) Supercenter (40-50%) (20-25%) Supercenter (40-50%) (20-25%) Large-scale food discounter storeLarge-scale food discounter store E-mart, LotteMart, HomePlus, Wal-Mart Supercenter, CarrefourE-mart, LotteMart, HomePlus, Wal-Mart Supercenter, Carrefour Convenience Store (80%) Convenience Store (80%) Seven Eleven, LG25 Seven Eleven, LG25 Department Store (20%) Department Store (20%) In Korea, Department Stores have a supermarket in basement floor. In Korea, Department Stores have a supermarket in basement floor. Mom and Pop Store (80%) Mom and Pop Store (80%) Traditional Market(Wet Market) Traditional Market(Wet Market)
 Mom and Pop Store (80%) Traditional Market(Wet Market) Traditional Market(Wet Market).")
19
Share of Consumer Purchase Channel by Product (Based on the amount; January to June 2004) Source : AC Nielsen, 2004 Korea
 Source : AC Nielsen, 2004 Korea")
20
The volume of retail sales of Supermarkets in China 12 large cities City Total volume of retail sales (100 million yuan ) Total amount of sales of supermarkets ( 100 million yuan ) Proportion of supermarkets (%) No. of stores of supermarket Shanghai236889637.810220 Beijing211261629.25000 Tianjin101624023.6 Chongqing92020021.73000 Qingdao58416828.83785 Shenyang77620826.84000 Wuhan92824025.92350 Suzhou6009616.01093 Ningbo57613623.6 Taiyuan2164822.2 Hangzhou68012017.61222 Yantai4245613.21400 Harbin680324.7253

22
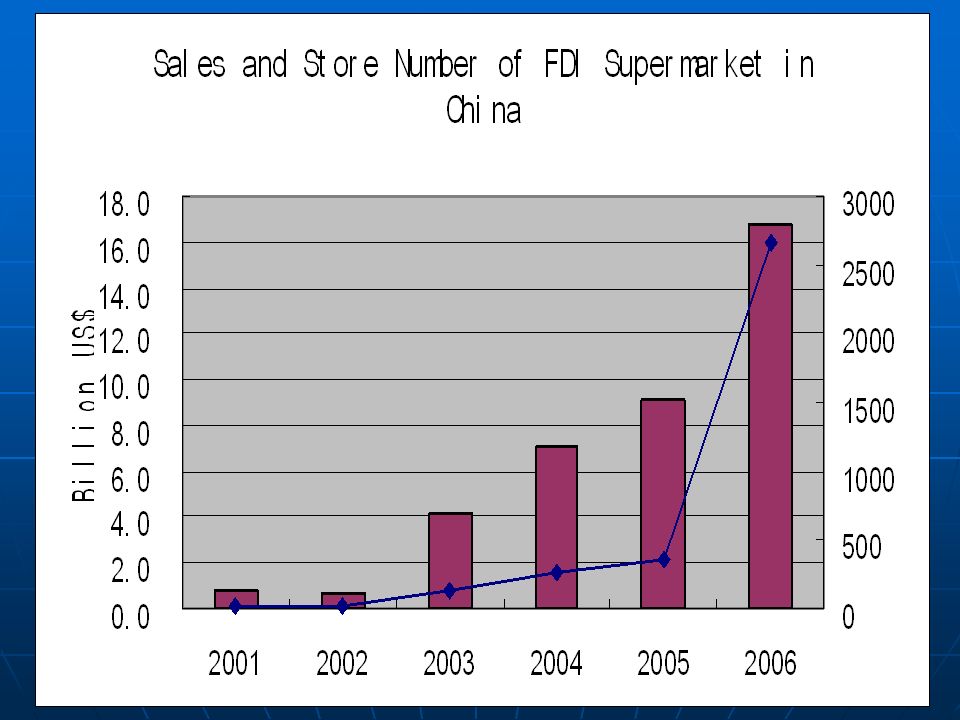
The FDI supermarkets have entered into China’s market Year Name of Company Country Place of first Supermarket 1991YohanJapanShanghai 19927-ElevenJapanShenzhen 1995CarrefourFranceShanghai 1996MetroGermanyShanghai 1996Wal-MartUSAShenzhen 1997 Lotus Super Center ThailandShanghai 1998 Ito Yokado JapanBeijing 1999AuchanFranceShanghai

24
Changing Food Markets

25
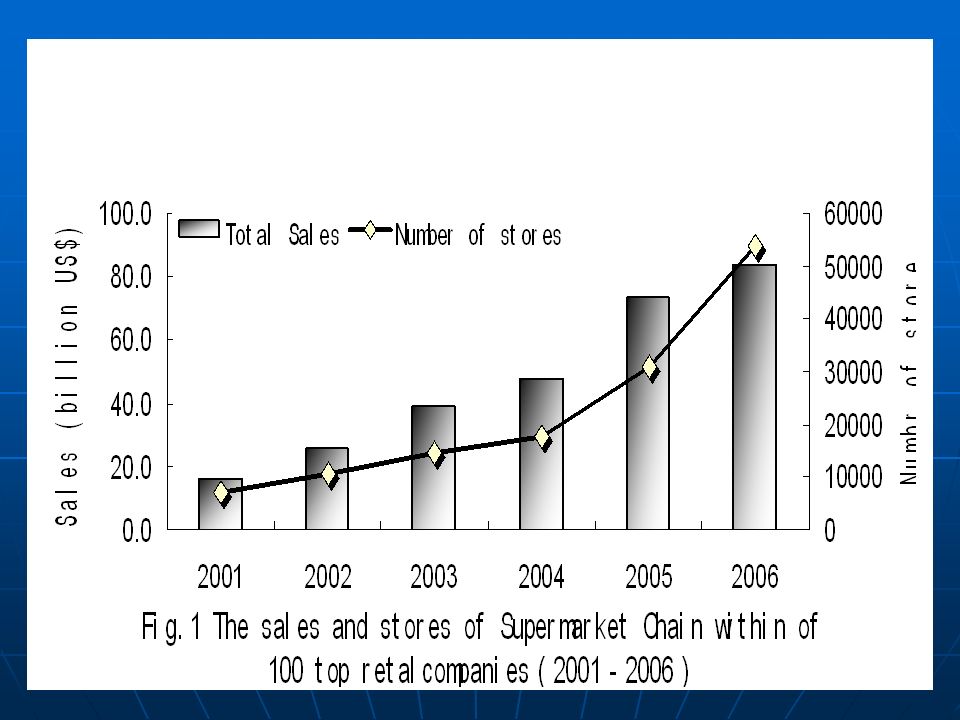
Increasingly This Growth Is Helping Fuel Trade

26
2003 2004 2005 2006 2007 2008 2009 2010 Food Imports Becoming More Important Metro Estimates of Imports to Supply China

27
And Increasingly That Trade is Regional

28
Sourcing From Within the Region MCC China trade flow within Asia countries 16% 84% CountriesShare % Main products Thailand24 Fruit / Rice / sea Food Korea23Gen. Food Japan13Gen. Food Philippine10Fruit Singapore10Gen. Food Taiwan8beverage Indonesia4Sea Food Malaysia2Gen. Food Other6Gen. Food Asia imported food share 16% of total MCC China import

29
Imported fruit Domestic Fruit 61% 30% 9% Imported fruit Asia imported fruit share 9% of total MCC China import fruit CountriesShare % Main products Philippine53Banana Thailand35Durian Vietnam9Dragon fr Taiwan1Mango Japan1Apples Other1Pear Metro C&C Exchange 2008 CountriesMain products IndiaMango PakistanMango Sourcing From Within the Region MCC China trade flow within Asia countries

30
China Exports Expanding to Important Near By Markets Taking Markets from U.S. Suppliers

31
Who are these Folks? Asian Suppliers to this Dynamic Market & The Corresponding Supply Chain Small Many But Changing

32
China’s Farm Structure 200,000,000+ million farms 200,000,000+ million farms Every rural resident (800,000,000 of them) has land Every rural resident (800,000,000 of them) has land Almost all farms are “family farms” Almost all farms are “family farms” Farm size: “1 mu per person” Farm size: “1 mu per person” Average size of vegetable operation (about 1/3 of an acre … a big garden!) Average size of vegetable operation (about 1/3 of an acre … a big garden!) Few Cooperatives or Farmer Associations Few Cooperatives or Farmer Associations 6 mu acre; 15 mu hectare
 has land Every rural resident (800,000,000 of them) has land Almost all farms are family farms Almost all farms are family farms Farm size: 1 mu per person Farm size: 1 mu per person Average size of vegetable operation (about 1/3 of an acre … a big garden!) Average size of vegetable operation (about 1/3 of an acre … a big garden!) Few Cooperatives or Farmer Associations Few Cooperatives or Farmer Associations 6 mu acre; 15 mu hectare")
33
Diversified Farming Operation China Scale

34
42 (mandays) Hired Day / ha 3.2 (US$/day) Wage Ownership and Control 96%(%) Contracted from “ collective ” 4%(%) Rented from other farmer 95%(%) Share of area decided by farmer 312 (mandays ) Own Labor Days / ha Labor 3 crops (horticulture makes up ½ ) (number) Number of crops (diversification) 5 plots(number) Distinct Plots 0.4 ha (1 acre)(ha) Farm size Farm Characteristic The typical fruit growing farm in China, 2005 Rozelle, Jikun, Reardon, et. al survey 2005 6 mu acre; 15 mu hectare

35
7882(US$) Housing 402(US$) Assets: Farm equipment 25(%) Share of household head who has off-farm jobs (self employed) 20(%) Share of HH head who has off-farm jobs (in factory) (%) Off-farm job 50(%) Share of HH head with ag extension training 7(year) Education of HH head Education and training 42 (male)(year) Age of HH head 4(person) HH size Household characteristics The typical fruit growing household in China, 2005 Rozelle, Jikun, Reardon, et. al survey 2005, greater Beijing area

36
Major Assets * Same place that has lunar orbiting satellite?

37
But the Times they are a Changing Melon Production Under Plastic

38
The Evolving Supply Chain

39
Sales Primarily still at point of Production (2004) Note; -- “In the village” = Off the tree + From Home + Road-side -- Share sold in wet markets in cities down over time Percent of all purchases
 Note; -- In the village = Off the tree + From Home + Road-side -- Share sold in wet markets in cities down over time Percent of all purchases")
40
Small Trader-dominated System (2004) Percent of all purchases / coops
 Percent of all purchases / coops")
41
Typical Trading “Firm” Arrangement Farmer’s field Small Trader: Finds seller / contacts trucker / buys with cash Small Trader -- Partner Outlets Inside China’s cities (>90% private) Partners: in other villages Small Trader -- Partner In the city wholesale mktGoing from village to village Private, “contract” truckers Division I Div II Rozelle, Jikun, Reardon, et. al survey 2005

42
Small Traders Purchase Product Transfer to Partners in Markets Some Product Sold Directly Big Wholesale To Big Buyers Supermarkets, Institutions, Military, etc Smaller Wholesale to Restaurants & Mom and Pops

43
Asian Food Supply Chain Evolution Metro Cash & Carry Wholesaler to Small Retail and Food Service

44
Asian Food Supply Chain Evolution

45
Distribution Flow for Fruits and Vegetables in Korea PRODUCERSPRODUCERS CONSUMERSCONSUMERS APC Others Large Vendors Small Food Retailers Restaurants Small Vendors Regional Commodity Producers Group APC : Agricultural Processin Center (mostly operated by regional ag. co-op) RPC : Rice Processing Center (operated by regional ag co-op or farm related firm) Source : Korea Ministry of Agriculture, 2003 Collecting Agents Large Food Retailers Wholesale Market (48.5%) IAMC (5.4%) Traditional Wet Market (29.5%) Large Food Retailers(SC) (5.8%) Direct Sale to Consumers or Retailers (10.8%)
 RPC : Rice Processing Center (operated by regional ag co-op or farm related firm) Source : Korea Ministry of Agriculture, 2003 Collecting Agents Large Food Retailers Wholesale Market (48.5%) IAMC (5.4%) Traditional Wet Market (29.5%) Large Food Retailers(SC) (5.8%) Direct Sale to Consumers or Retailers (10.8%).")
46
Korea Growth in Number of Super Centers

47
The Quality Line : Real Quality and Value Image Taste: Propose good tasting products above market standard Food safety: Contribute to the human health and food safety for the consumer by applying the precaution and prevention principle. No GMO Control the food chain: from the field to the plate (guide line, control plan and traceability) Quality/Price: Guarantee the best and stable quality products with an accessible price Retribute producers according to their work Authenticity: Preserve and promote the agricultural heritage Look for the best origin Encourage and Support Regions and Countries where Carrefour is presented Permanence: Preserve the social, economical and ecological environment
 Quality/Price: Guarantee the best and stable quality products with an accessible price Retribute producers according to their work Authenticity: Preserve and promote the agricultural heritage Look for the best origin Encourage and Support Regions and Countries where Carrefour is presented Permanence: Preserve the social, economical and ecological environment.")
48
QL project in Carrefour China Fuji Veg BJ Veg SH Pork DL Beef SH Litchi 99.06 Pomelo 02.09 Mandarin 02.12 Salmon 03.03 Pork 03.06 ( SH ) Pork 04.11 ( BJ ) Pork 05.05 (South ) Signed Product 7 product Orange Pork DL Beef SH Product in trial ( launching in store ) 6 product Project in development 8 product Veg GZ Veg ShZ Shrimp Pork CD Pork KM Pork ShYang Beef BJ KIWI
 Pork ( BJ ) Pork (South ) Signed Product 7 product Orange Pork DL Beef SH Product in trial ( launching in store ) 6 product Project in development 8 product Veg GZ Veg ShZ Shrimp Pork CD Pork KM Pork ShYang Beef BJ KIWI")
49
Carrefour Future Supply Chain Breeder Slaughtering, Cutting Transportatio n Farming Meat Carrefour ’s product Customer Control Analyse Record Delivery Sale

50
Summary Asian Food Supply Chain Developing at a Rapid Rate Asian Food Supply Chain Developing at a Rapid Rate Increasing Demand for High Quality (Safe) and Diversity in Products Increasing Demand for High Quality (Safe) and Diversity in Products Intra Asian Supply Becoming Important in Food Trade Intra Asian Supply Becoming Important in Food Trade Producers Increasing Quality and Quantity Producers Increasing Quality and Quantity Growth in Consumer Base Has Great Potential for Higher Valued Products Growth in Consumer Base Has Great Potential for Higher Valued Products Global and Regional Food Chains Increasing Presence in Control of the Flow Global and Regional Food Chains Increasing Presence in Control of the Flow
 and Diversity in Products Increasing Demand for High Quality (Safe) and Diversity in Products Intra Asian Supply Becoming Important in Food Trade Intra Asian Supply Becoming Important in Food Trade Producers Increasing Quality and Quantity Producers Increasing Quality and Quantity Growth in Consumer Base Has Great Potential for Higher Valued Products Growth in Consumer Base Has Great Potential for Higher Valued Products Global and Regional Food Chains Increasing Presence in Control of the Flow Global and Regional Food Chains Increasing Presence in Control of the Flow")
51
Linkages to U.S. Farm Policy? Does Farm Policy Enhance U.S. Agriculture’s Ability to Benefit from Changes In Asian Food Supply Chain?

52
What’s In the Farm Bill ?

53
What Does Current Policy Contribute? Commodity Title? Commodity Title? Cheap inputs for Asian fiber sector: cotton to China, textiles back to U.S.; Cheap inputs for Asian fiber sector: cotton to China, textiles back to U.S.; Cheap inputs for Asian feed sector: corn and soybeans for livestock and poultry feed, value added products in return; Cheap inputs for Asian feed sector: corn and soybeans for livestock and poultry feed, value added products in return; Not readily apparent any significant contribution to U.S. agriculture having increased opportunities in growing markets in Asia. to U.S. agriculture having increased opportunities in growing markets in Asia.

54
What Does Current Policy Contribute? Horticulture? Planting Flexibility: no change in either House or Senate version except for pilot program of 10,000 of processing tomatoes in Indiana ( Not much supply Side impact) Block Grants to States: Could fund efforts to expand access in Asian Markets and/or develop new products, etc. $365 million over 5 years ($73 million/50 = $1.46 million per state) Modest Support by Title I standards Last Time Authorized $44.4 million annually Provided $7 (PL 180-465); Allocated by production %
 Block Grants to States: Could fund efforts to expand access in Asian Markets and/or develop new products, etc. $365 million over 5 years ($73 million/50 = $1.46 million per state) Modest Support by Title I standards Last Time Authorized $44.4 million annually Provided $7 (PL ); Allocated by production %.")
55
What Does Current Policy Contribute? Other Provisions? COOL, may create standards that are adopted/required in Asian Markets. Export Market Promotion: House Senate

56
What Does Current Policy Contribute? Technical Assistance for Specialty Crops (TASC) Funding to assist in removal of SPS barriers to U.S. agricultural Exports: Provides Input into Standards Development Adopted in Asian Supply Chains (Public/Private) (H) (S)
 Funding to assist in removal of SPS barriers to U.S. agricultural Exports: Provides Input into Standards Development Adopted in Asian Supply Chains (Public/Private) (H) (S).")
57
Does Farm Policy Enhance U.S. Agriculture’s Ability to Benefit from Changes In Asian Food Supply Chain? Not Much, Indirectly for the Most Part What Could We Do if We Should Do Anything?

Similar presentations