Download presentation
Presentation is loading. Please wait.

1
Nutrient Criteria for the plains regions of Missouri

2
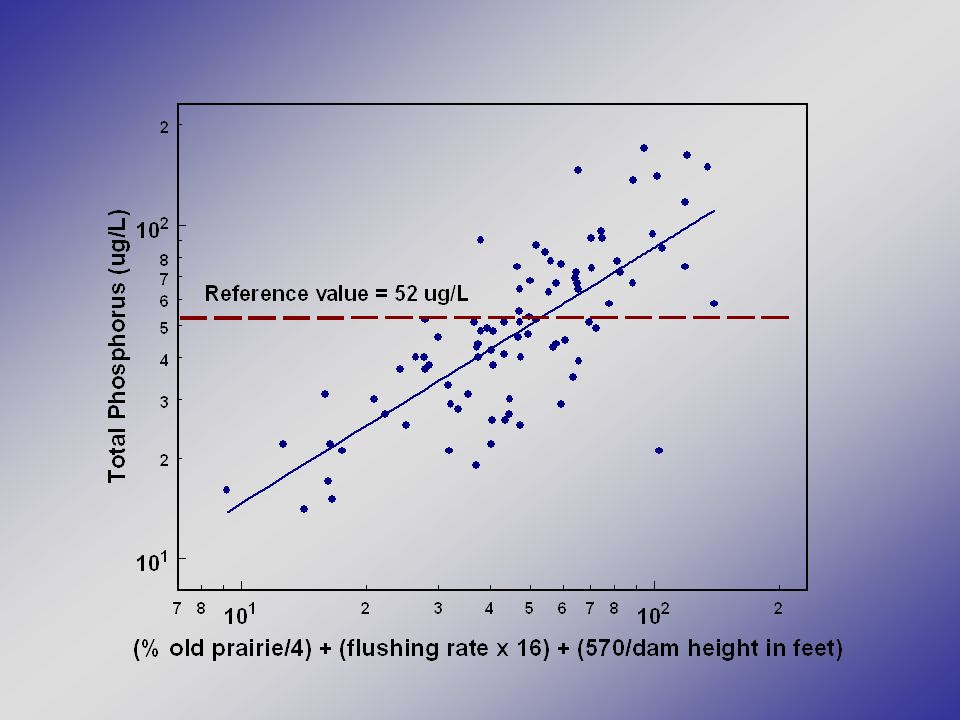
Using the proportion of the watershed that was historically prairie (measure of natural soil fertility), flushing rate (inflow volume relative to reservoir volume), and dam height (estimate of lake depth) we can predict the phosphorus concentration of reservoirs located in the plains region of Missouri. In the following graphics the horizontal axis is the predicted phosphorus and the vertical axis is the long- term phosphorus concentration. Each symbol represents an individual reservoir in the plains region of Missouri, and the diagonal line shows the general relationship between predicted and actual phosphorus levels.

4
Some of the reservoirs in the plains region were built in pockets of forest, and have water quality that reflects this difference in watershed land cover. These reservoirs could be considered as “outstanding” and protected from cultural eutrophication by setting a lower phosphorus standard. In the following example the phosphorus level of 20 μg/L has been indicated with the dashed line. Those reservoirs that have long-term phosphorus concentrations below this level would be listed as “outstanding” waters and the goal would be to maintain <20 μg/L phosphorus in these reservoirs.

6
One reservoir has a long-term phosphorus concentration that is above the 20 μg/L “outstanding” level as well as above the predicted phosphorus. This reservoir could be targeted for nutrient reduction to get it below the 20 μg/L level.

8
A higher phosphorus criteria could be set using a variety of methods. In the following example the value of 52 μg/L is used. This value is the 75 th percentile of the plains reference lakes (reference defined as having watersheds with limited urban and/or agriculture, no point sources and originally dominated by prairie land cover).
..")
10
Reservoirs with long-term phosphorus concentrations that fall between the two standards would not be listed as they are below the “reference” phosphorus level.

12
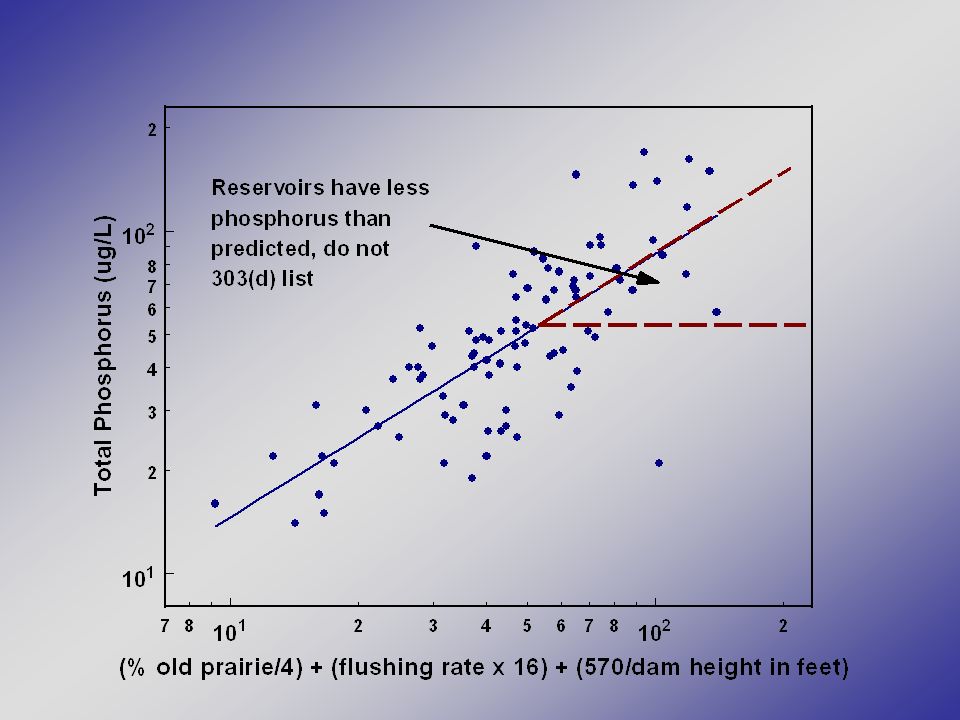
Reservoirs with long-term phosphorus concentrations that are above the “reference” phosphorus level but below predicted values would not be listed.

14
Those reservoirs with long-term phosphorus that is above both the reference level and the predicted value would go through Use Attainability Assessments to determine if impairments are occurring.

16
To summarize

18
The following flow chart shows the decision process for those reservoirs that are above the “outstanding” waters standard.

19
Is mean TP > than regional reference value? no Do not 303(d) list yes Is mean TP > than predicted TP value? yes no Is predicted value correct? (check depth, flushing rate, etc) no Recalculate predicted value yes Does Use Attainability Analysis indicate impairment? no yes Place on 303(d) list
 list yes Is mean TP > than predicted TP value. yes no Is predicted value correct. (check depth, flushing rate, etc) no Recalculate predicted value yes Does Use Attainability Analysis indicate impairment. no yes Place on 303(d) list.")
Similar presentations


: 240-360 kg N/ha/yr.>")


 Plan Implementation by Jeff Spoelstra, Coordinator, Kalamazoo River Watershed Council.>")


? What are the WLA assumptions? How will Avista’s.>")


