Download presentation
Presentation is loading. Please wait.

1
Understanding International Assessments Tom Loveless UNLV Las Vegas, Nevada January 17, 2012

2
Outline of Talk 1. The First International Tests 2. Why International Test Scores Matter 3. Comparing PISA and TIMSS 4. Sample Items 5. Results from TIMSS and PISA 6. Some surprises

4
1 st International Mathematics Study, Population 1B Country MeanSD Israel 32.314.7 Japan 31.216.9 Belgium 30.413.7 Finland 26.49.6 Germany 25.411.7 England 23.818.5 International Avg. 23.015.0 Scotland 22.315.7 The Netherlands 21.412.1 France 21.013.2 Australia 18.912.3 United States 17.813.3 Sweden 15.310.8 International Project for the Evaluation of Educational Achievement, International Study of Achievement in Mathematics: A Comparison of Twelve Countries, edited by Torsten Husén (New York, John Wiley and Sons, 1967).
..")
5
Economic Growth and Education, 1960-2000 Hanushek et al (2008)
")
6
Comparing PISA and TIMSS Governance PISATIMSS Government representatives Government representatives Researchers and Government Representatives Researchers and Government Representatives SamplePISATIMSS Age-based; 15-year- olds Age-based; 15-year- olds Grade-based; 4th and 8th grades Grade-based; 4th and 8th grades

7
Comparing PISA and TIMSS (cont.) Philosophy of Assessment PISATIMSS Measures the ability to apply what has been learned to real-world situations (socio- constructivist) Measures what has been learned in the school curriculum ScopePISATIMSS Learning inside and outside of school, including attitudes, values, and beliefs Learning inside and outside of school, including attitudes, values, and beliefs Topics in school curriculum Topics in school curriculum
 Philosophy of Assessment PISATIMSS Measures the ability to apply what has been learned to real-world situations (socio- constructivist) Measures what has been learned in the school curriculum ScopePISATIMSS Learning inside and outside of school, including attitudes, values, and beliefs Learning inside and outside of school, including attitudes, values, and beliefs Topics in school curriculum Topics in school curriculum")
8
Comparing PISA and TIMSS (cont.) Content-Math PISATIMSS Mathematical literacy: Space and shape, change and relationships, quantity, uncertainty Mathematical literacy: Space and shape, change and relationships, quantity, uncertainty Grade 4 mathematics: Number, geometric shapes and measures, data display Grade 4 mathematics: Number, geometric shapes and measures, data display Grade 8 mathematics: Number, algebra, geometry, data and chance Grade 8 mathematics: Number, algebra, geometry, data and chance
 Content-Math PISATIMSS Mathematical literacy: Space and shape, change and relationships, quantity, uncertainty Mathematical literacy: Space and shape, change and relationships, quantity, uncertainty Grade 4 mathematics: Number, geometric shapes and measures, data display Grade 4 mathematics: Number, geometric shapes and measures, data display Grade 8 mathematics: Number, algebra, geometry, data and chance Grade 8 mathematics: Number, algebra, geometry, data and chance")
9
Sample Item—TIMSS 4 th Grade Math

10
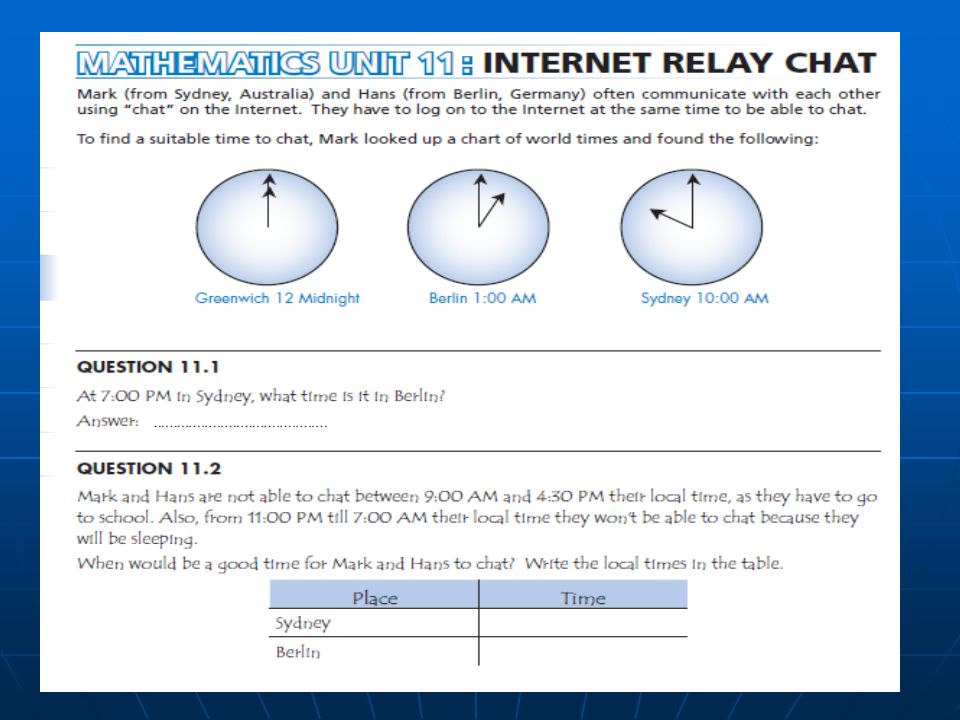
Sample Items: PISA 2006 Mathematics Literacy

12
TIMSS 2007 Math Scores (Grade 4) Hong Kong SAR 607Germany525 Singapore599Denmark523 Chinese Taipei 576Australia516 Japan568Hungary510 Kazakhstan549Italy507 Russian Federation 544Austria505 England541Sweden503 Latvia537Slovenia502 Netherlands535Armenia500 Lithuania530 Slovak Republic 496 United States 529 Countries in blue are significantly above the international average scale score (M = 500, sd = 100). Source: TIMSS & PIRLS International Study Center, TIMSS 2007 International Mathematics Report: Findings from IES’s Trends in International Mathematics and Science Study at the Fourth and Eighth Grades (2008).
..")
13
TIMSS 2007 Math Scores (Grade 4) Scotland494 New Zealand 492 Czech Republic 486 Norway473 Ukraine469 Georgia438 Iran, Islamic Rep. of 402 Algeria378 Colombia355 Morocco341 El Salvador 330 Tunisia327 Kuwait316 Qatar296 Countries in green are significantly below the international average scale score (M = 500, sd = 100). Source: TIMSS & PIRLS International Study Center, TIMSS 2007 International Mathematics Report: Findings from IES’s Trends in International Mathematics and Science Study at the Fourth and Eighth Grades (2008).
. Source: TIMSS & PIRLS International Study Center, TIMSS 2007 International Mathematics Report: Findings from IES’s Trends in International Mathematics and Science Study at the Fourth and Eighth Grades (2008)..")
14
TIMSS 2007 Math Scores (Grade 8) Chinese Taipei 598 Korea, Rep. of 597 Singapore593 Hong Kong SAR 572 Japan570 Hungary517 England513 Russian512 United States 508 Lithuania506 Czech Republic 504 Slovenia501 Armenia499 Australia496 Countries in blue are significantly above the international average scale score (M = 500, sd = 100). Source: TIMSS & PIRLS International Study Center, TIMSS 2007 International Mathematics Report: Findings from IES’s Trends in International Mathematics and Science Study at the Fourth and Eighth Grades (2008).
. Source: TIMSS & PIRLS International Study Center, TIMSS 2007 International Mathematics Report: Findings from IES’s Trends in International Mathematics and Science Study at the Fourth and Eighth Grades (2008)..")
15
TIMSS 2007 Math Scores (Grade 8) Sweden491Tunisia491 Malta488Georgia488 Scotland487Iran487 Serbia486Bahrain486 Italy480Indonesia480 Malaysia474 Syrian Arab Republic 474 Norway469Egypt469 Cyprus465Algeria465 Bulgaria464Colombia464 Israel463Oman463 Ukraine462Palestine462 Romania461Botswana461 Bosnia456Kuwait456 Lebanon449 El Salvador 449 Thailand441 Saudi Arabia 441 Turkey432Ghana432 Jordan427Qatar427 Countries in green are significantly below the international average scale score (M = 500, sd = 100). Source: TIMSS & PIRLS International Study Center, TIMSS 2007 International Mathematics Report: Findings from IES’s Trends in International Mathematics and Science Study at the Fourth and Eighth Grades (2008).
..")
17
What Can We Learn from International Tests? Trends in National Achievement Trends in National Achievement Top Scoring Nations Top Scoring Nations Some Surprises Some Surprises

20
Trends in Mathematics Scores, 8 th grade by country: 1995 to 2007 * p<.05. Within-country difference between 1995 and 2007 average scores is significant. Country difference in scores between 1995 and 2007 is greater than U.S. Country difference in scores between 1995 and 2007 is less than U.S. Country difference in scores between 1995 and 2007 is not measurably different from U.S.

22
TIMSS 2007 Mathematics Grade 8 U.S. average score lower than average scores of 5 countries Top countries in Asia Average score is higher than U.S. average score Average score is lower than U.S. average score Average is not measurably different from U.S. average

23
Why Do Top Scoring Nations Do So Well? My Own Speculation 1. Culture—emphasis on academic achievement in childhood. 2. Time—longer day and year + time outside of school 3. Curriculum—lean, focused, sequential 4. Teachers—trained in academic disciplines rather than education schools

24
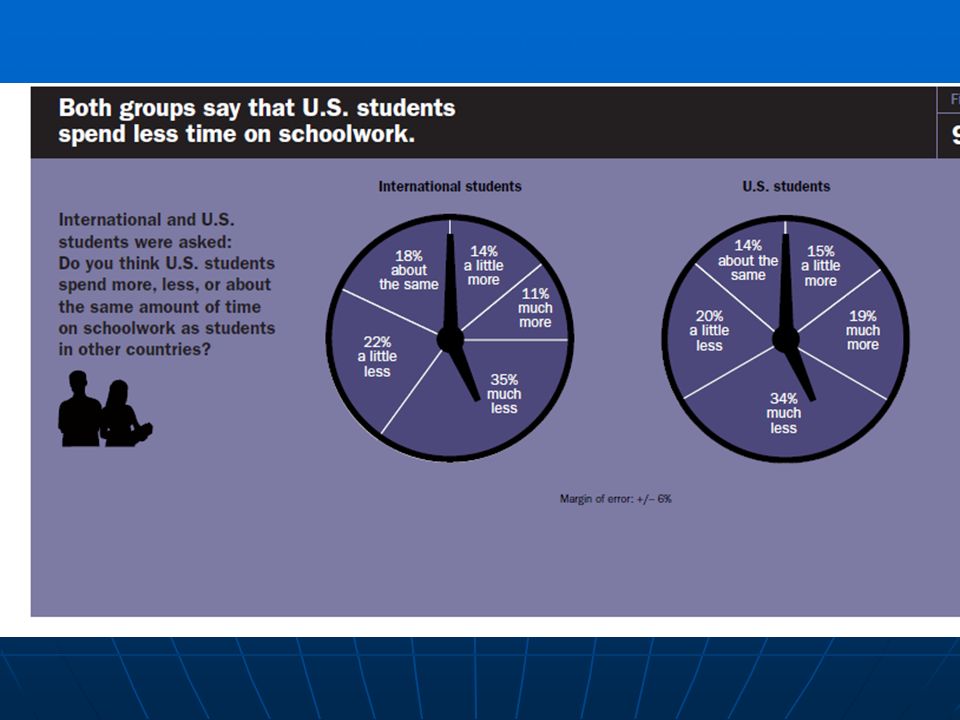
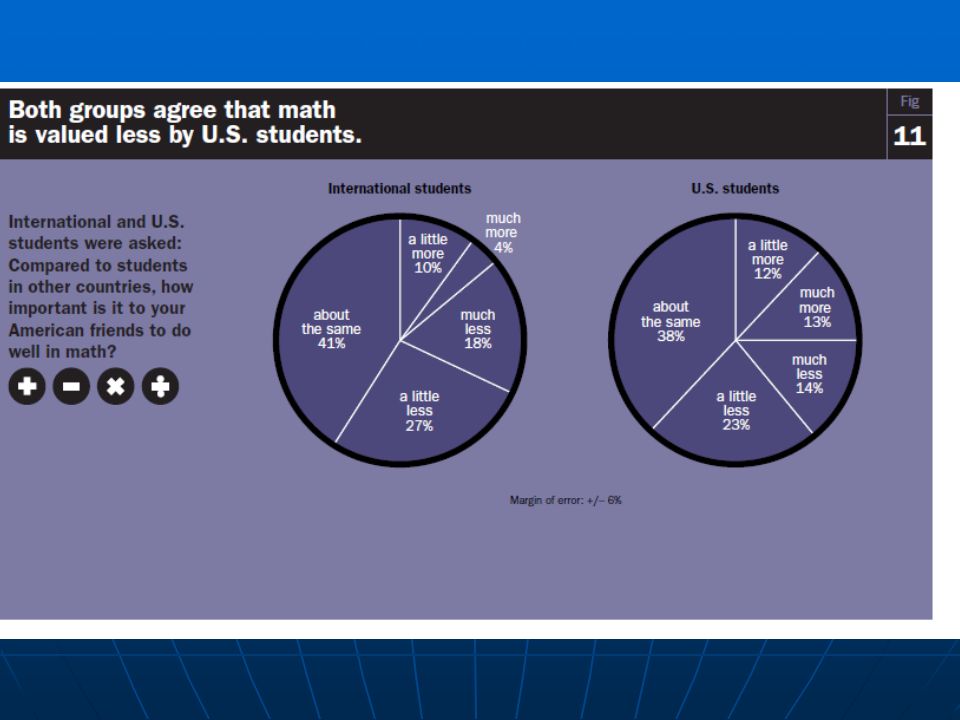
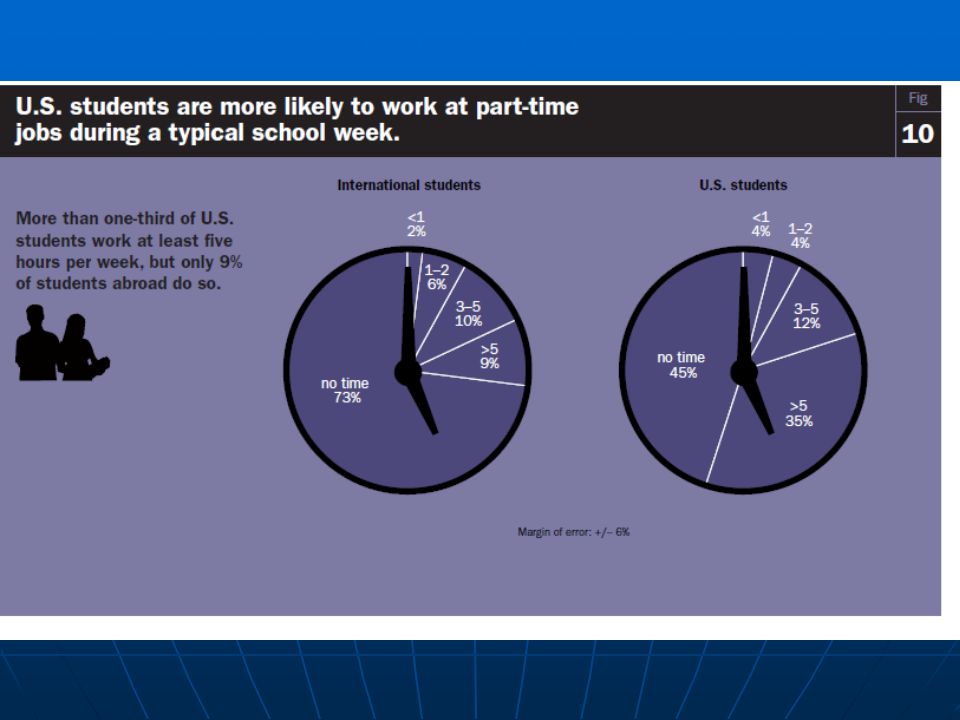
What Do Foreign Exchange Students Think? Brown Center Reports 2001, 2002. Sample of approximately 380 students from abroad (2001) and about the same from U.S (2002). Asked a series of questions comparing schools and peers in U.S. and abroad.
 and about the same from U.S (2002). Asked a series of questions comparing schools and peers in U.S. and abroad..")
30
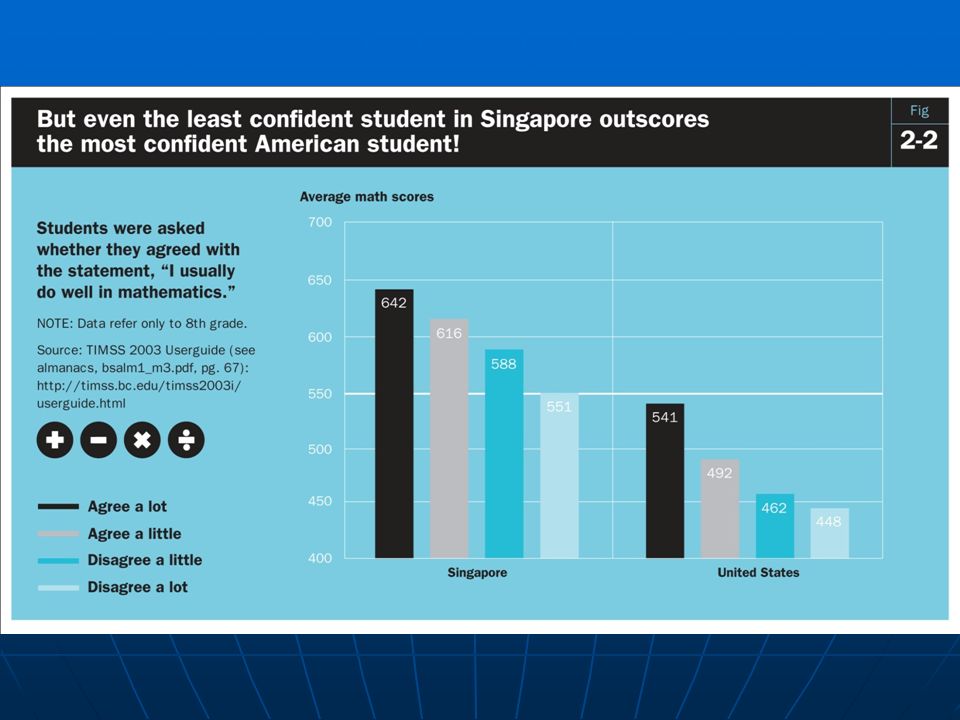
A Surprise Achievement and Enjoyment Between Country Relationship, r = -0.76

34
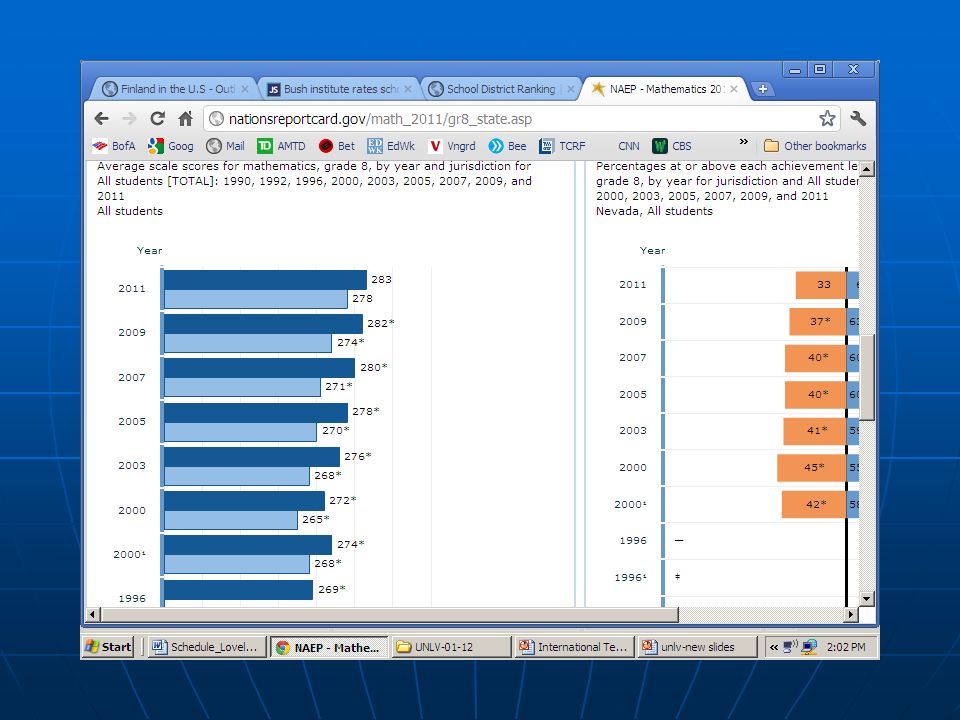
How Does Clark County Stack Up?

37
Conclusion The two international tests, TIMSS and PISA, differ in content, sampling design, and age of students tested. The two international tests, TIMSS and PISA, differ in content, sampling design, and age of students tested. The U.S. scores near the international average on mathematics tests. Mediocre but not awful. The U.S. scores near the international average on mathematics tests. Mediocre but not awful. The U.S. has never scored at the top on international tests of math and science. The U.S. has never scored at the top on international tests of math and science. The U.S. has improved (modestly) on international tests of math since 1995. The U.S. has improved (modestly) on international tests of math since 1995. National test scores in math are inversely correlated with national indicators of student confidence and enjoyment of subject. National test scores in math are inversely correlated with national indicators of student confidence and enjoyment of subject.
 on international tests of math since The U.S. has improved (modestly) on international tests of math since National test scores in math are inversely correlated with national indicators of student confidence and enjoyment of subject. National test scores in math are inversely correlated with national indicators of student confidence and enjoyment of subject..")
38
Conclusion (cont.) Culture seems to matter a lot in promoting academic achievement. Culture seems to matter a lot in promoting academic achievement. Extrapolations of state to national to international scores are fraught with error. Extrapolations of state to national to international scores are fraught with error. That said, Clark County almost certainly would score significantly below average on a test of international achievement. That said, Clark County almost certainly would score significantly below average on a test of international achievement.

Similar presentations


 2006 Prepared by the Education Trust December 2007.>")