Download presentation
Presentation is loading. Please wait.

1
Measuring Value and Outcomes of Reading Dr. Carol Tenopir University of Tennessee ctenopir@utk.edu

2
What information they need and use How many articles they read Changes in behavior, formats, needs Purpose and outcome of readings Value of libraries and publishers Ongoing studies of scientists… (Audiences=librarians, funders, publishers, scientists)
")
3
Methods for measuring value Usage Citations Focus groups Return on Investment Perceptions Experiments Critical incident Contingent valuation Observations Conjoint measurement Interviews

4
Critical Incident Technique Surveys by Tenopir and King (1977-present) Ask respondents about most recent reading Ask questions on purpose, motivation and outcomes of specific reading In-depth picture of complexity of readings
 Ask respondents about most recent reading Ask questions on purpose, motivation and outcomes of specific reading In-depth picture of complexity of readings")
5
“The following questions in this section refer to the SCHOLARLY ARTICLE YOU READ MOST RECENTLY, even if you had read the article previously. Note that this last reading may not be typical, but will help us establish the range of patterns in reading.” Critical Incident

6
Definitions “Articles can include those found in [e] journal issues, web sites, or separate copies such as preprints, reprints, and other electronic {or paper} copies. Reading is defined as going beyond the table of contents, title, and abstract to the body of the article.” Carol Tenopir
![Definitions Articles can include those found in [e] journal issues, web sites, or separate copies such as preprints, reprints, and other electronic {or paper} copies.](http://images.slideplayer.com/25/7705568/slides/slide_6.jpg "Reading is defined as going beyond the table of contents, title, and abstract to the body of the article. Carol Tenopir.")
7
Principal Purpose of Reading (Faculty in U.S. and Australia, 2004-2006, n=1433) 51% 9% 11% 9% 20% Research Teaching Current Awareness Proposals Other
 51% 9% 11% 9% 20% Research Teaching Current Awareness Proposals Other.")
8
Source of reading by purpose of reading by faculty (Faculty in U.S. and Australia, 2004-2005, n=1412) Research Teaching Current Awareness
 Research Teaching Current Awareness.")
9
Library E-Collections are Most Common Source of Additional Readings Library collection Other

10
Readings for Research More likely to be rated “absolutely essential” More likely to be found by searching More likely to be from e-sources More likely to be from the library

11
Comments (2008) tell us that E-Collections improve… Efficiency and productivity “[e-access] saves me a lot of time which can be used for more extensive reading.” Writing and proposals “[E-access] is essential for scientific writing.” Research and teaching “I could not do the kind of research or teaching I do without these resources.”
![Comments (2008) tell us that E-Collections improve… Efficiency and productivity [e-access] saves me a lot of time which can be used for more extensive reading. Writing and proposals [E-access] is essential for scientific writing. Research and teaching I could not do the kind of research or teaching I do without these resources.](http://images.slideplayer.com/25/7705568/slides/slide_11.jpg "Comments (2008) tell us that E-Collections improve… Efficiency and productivity [e-access] saves me a lot of time which can be used for more extensive reading. Writing and proposals [E-access] is essential for scientific writing. Research and teaching I could not do the kind of research or teaching I do without these resources.")
12
Average number of articles read annually by publishing productivity (number of articles published in the past 2 years) (Faculty in U.S. and Australia, 2004-2005, n=1364)
.")
13
Principal purpose of reading by publishing productivity (number of articles published in the past 2 years) (Faculty in U.S. and Australia, 2004-2005, n=1366)
.")
14
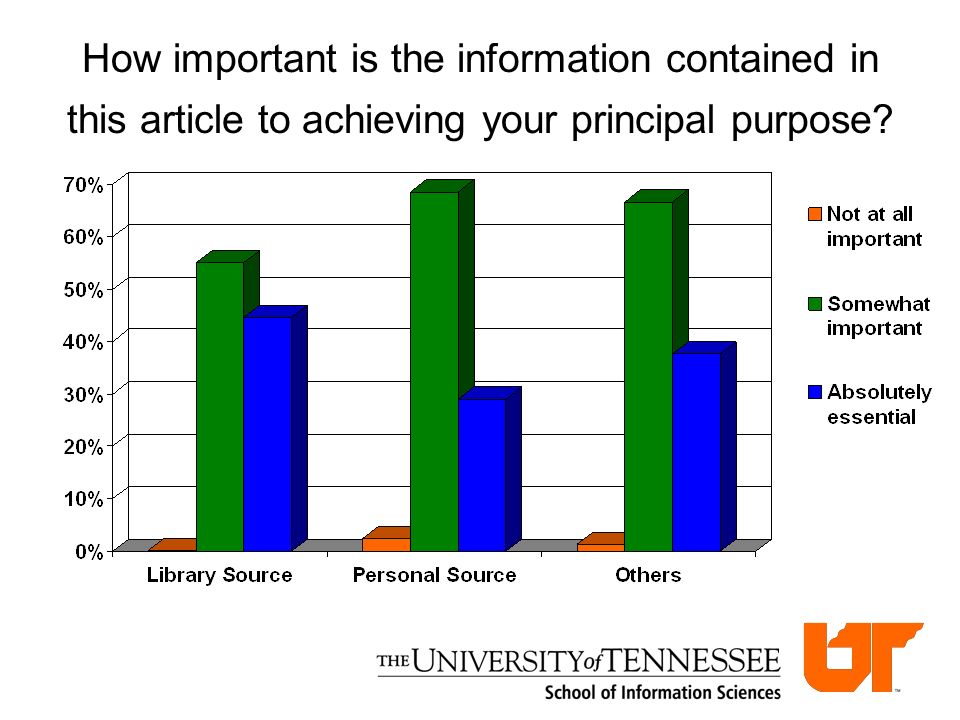
How important is the information contained in this article to achieving your principal purpose?

16
National differences Carol Tenopir Faculty in Australia have the highest amounts of e-reading and report a significant amount (6.7%) of readings done while travelling Faculty in Finland access articles more at the office or lab, less at home Finnish scholars report a higher use of searching in locating e-articles Faculty in Taiwan, Japan and Finland have a higher percentage of readings from the library
 of readings done while travelling Faculty in Finland access articles more at the office or lab, less at home Finnish scholars report a higher use of searching in locating e-articles Faculty in Taiwan, Japan and Finland have a higher percentage of readings from the library")
17
Return on Investment (ROI) ROI is a quantitative measure expressed as a ratio of the value returned to the institution for each monetary unit invested in the library. For every $/€/¥ spent on the library, the university received ‘X’ $/€/¥ in return. Demonstrate that library collections contribute to income-generating activities

18
Study in 3 Phases Phase 1: ROI in grants, case study at a U.S. University (completed 2008) Phase 2: ROI in grants, expanded to 8 countries (completed 2010) Phase 3: ROI for grants/research, teaching, student engagement (in progress now)
 Phase 2: ROI in grants, expanded to 8 countries (completed 2010) Phase 3: ROI for grants/research, teaching, student engagement (in progress now).")
19
Types of Data Collected Data sourcesMethod Research FacultySurvey; quantitative and qualitative Grant ProposalsUniv research data; survey Grant IncomeUniv research office data LibraryTotal budget (including collection, facilities, personnel, etc.) Administrators’ prioritiesInterviews (with library, university, and research administrators)
 Administrators’ prioritiesInterviews (with library, university, and research administrators)")
20
Phase 2 8 institutions in 8 countries

21
Phase 2: ROI for Grants 1.3:1 to 5:1 Research and Teaching STM/Hum/SS Under 1:1 Research and Teaching

22
Phase 2: Why Does ROI for Grants Vary? ROI depends on institutional mission Research institutes have very large grants Teaching universities have smaller and fewer grants ROI varies depending on methods of government funding Be cautious comparing ROI across institutions

23
Ranking and Conjoint Analysis When faced with numerous articles on their topic, how do scholars make the decision of which articles to read? A study funded by:

24
Methodology International online survey of scholars Ranking and conjoint analysis provide relative importance of various article characteristics Additional questions to help identify differences: amount of reading, subject discipline, age, and location

25
The survey yielded 442 responses from 12 countries

26
Ranking Article Characteristics Respondents were asked to rank the importance of seven article characteristics from 1-7 where 1 is “most important” and 7 “least important.” 26

27
27

28
Next most important were: Online accessibility (3.27) Source of article (3.46) Journal Title (3.58) Author(s) (4.07) 28
 Source of article (3.46) Journal Title (3.58) Author(s) (4.07) 28")
29
29

30
30

31
31

32
32

33
The least important: Type of Publisher (5.21) Author’s Institution (5.82) 33
 Author’s Institution (5.82) 33")
34
34

35
35

36
Academic Disciplines n=412 36

37
HumanitiesSciencesMedicalSocial Sciences EngineeringProfessional Topic 111111 Online Accessibility 322224 Authors 555555 Institution 777777 Source (journal) 243342 Type of Publisher 666666 Journal Title 434433 Ranking of Article Characteristics by Discipline 37
 Type of Publisher Journal Title Ranking of Article Characteristics by Discipline 37")
38
Conjoint Analysis Methodology Respondents considered16 article profiles with each consisting of a different permutation of article characteristics. They rated how likely they were to read an article with that profile on a scale of 1-10 ( 1 is “absolutely would not read” and 10 is “absolutely would read.”) For conjoint analysis, the 16 profiles explored three characteristics: Author, Journal Type, and Accessibility.
 For conjoint analysis, the 16 profiles explored three characteristics: Author, Journal Type, and Accessibility..")
39
Profile 1 How likely are you (on a scale of 1 to 10) to read an article with these characteristics? Written by an author I recognize as a good (but not top) scholar, in a peer- reviewed journal outside the top tier, and available online at no personal cost [to reader]. Absolutely would not read-→1…2…3…4…5…6…7…8…9…10←-Absolutely would read Profile 13 How likely are you (on a scale of 1 to 10) to read an article with these characteristics? Written by an author I recognize as a good (but not top) scholar, from a source other than a journal, and available online at no personal cost. Absolutely would not read-→ 1…2…3…4…5…6…7…8…9…10 ←-Absolutely would read 39
 scholar, in a peer- reviewed journal outside the top tier, and available online at no personal cost [to reader]. Absolutely would not read-→1…2…3…4…5…6…7…8…9…10←-Absolutely would read Profile 13 How likely are you (on a scale of 1 to 10) to read an article with these characteristics. Written by an author I recognize as a good (but not top) scholar, from a source other than a journal, and available online at no personal cost. Absolutely would not read-→ 1…2…3…4…5…6…7…8…9…10 ←-Absolutely would read 39.")
40
Author Utility Estimate Top Tier 1.412 Good.386 Weak -1.193 Unknown -.605 40

41
Journal Utility Estimate Top Peer 1.113 Other Peer.376 Not Peer -.971 Not Journal -.519 41

42
Access Utility Estimate Online no personal Cost1.604 Online personal Cost -1.107 Print Only -.497 42

43
Some Final Thoughts on Measuring Value Measure motivations, purposes, outcomes Variations by purpose and discipline No one method stands alone

Similar presentations


 the Value of Academic Libraries Carol Tenopir University of Tennessee>")


