Download presentation
Presentation is loading. Please wait.

1
AIR POLLUTION CE 326 Principles of Environmental Engineering Prof. Tim Ellis January 16, 2009

2
Announcements No class Monday due to holiday Wednesday lab meet at the ISU Power Plant – see map on course website Air Pollution Problems Chapter 7: 2, 5, 7, 10, 15 due 1/26/2009 Chapter 7: 2, 5, 7, 10, 15 due 1/26/2009

3
Air Pollution Factoids Americans make the equivalent of _____ round trips to the moon each year in their automobiles. National air quality levels have shown significant improvements over the last _____ years in the U.S. Since 1970, aggregate emissions of the six principal pollutants have been cut by ____%, while the gross domestic product has increased 164%, energy consumption has increased _____%, and vehicle miles traveled has increased ________%. _____ million tons of pollution are emitted into the air each year in the U.S.

4
Air Pollution Factoids Approximately _____ million people live in counties where monitored air in 2002 was unhealthy at times because of high levels of at least one of the six principal air pollutants the vast majority of areas that experienced unhealthy air did so because of one or both of two pollutants - ______ and _________________, PM 10 Clean Skies legislation currently being considered would mandate additional reductions of _______% from current emission levels from power plants through a c_____ and t_________ program Of the six pollutants (NO X, Ozone, SO X, PM 10, CO, lead) ground level _________ has been the slowest to achieve reductions
 ground level _________ has been the slowest to achieve reductions")
5
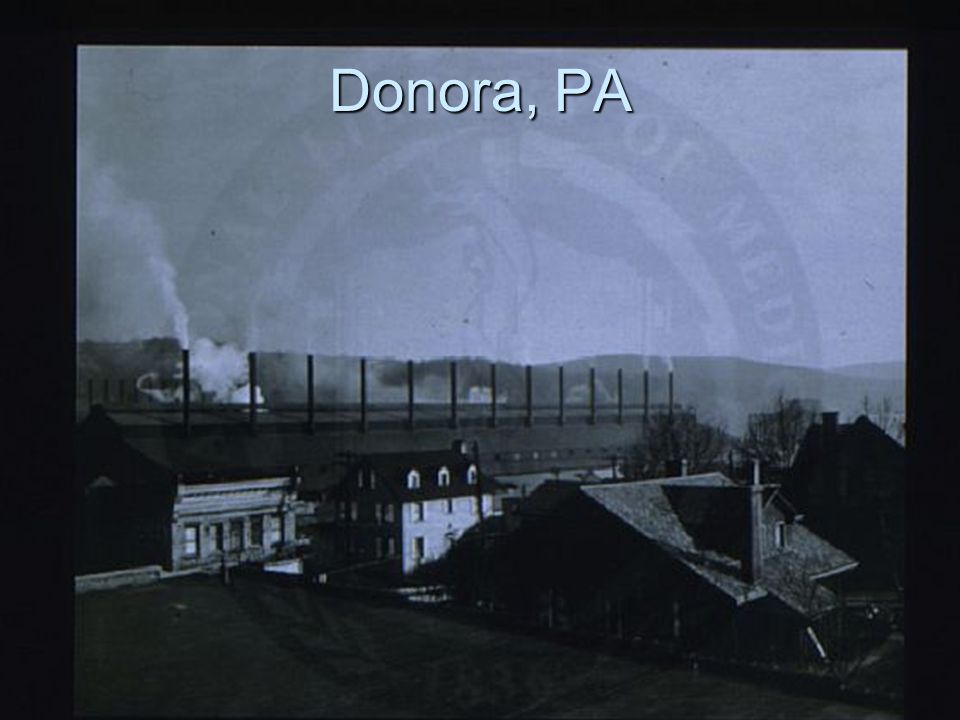
Air pollution Episodes Meuse Valley, Belgium, 1930 – zinc smelters, 60-70 deaths Donora, Pennsylvania, 1948 – 23 deaths over Halloween weekend London, England, 1952 – 4000 deaths

6
L’Indépendance Belge 6-12-1930 Le Peuple 6-12-1930 De Standaard 7-12-1930 Le Soir 12-12-1930 De Standaard 8-12-1930 Le Soir 11-12-1930

7
Meuse Valley, Belgium, 1930 – zinc smelters, 60-70 deaths

8
Donora, Pennsylvania, 1948 – 23 deaths over Halloween weekend

9
Donora, PA

11
Central London during the killer smog, December 1952. At this point, visibility is less than 30 feet. During the height of the smog, people could not see their own hands or feet, and buses had to be led by policemen walking with flares. Credit: 'When Smoke Ran Like Water', by Devra Davis, Perseus Books "Night at Noon." London's Piccadilly Circus at midday, during a deadly smog episode, this time in the winter of 1955. Credit: 'When Smoke Ran Like Water', by Devra Davis, Perseus Books Research by Rutgers University's Paul Lioy and others shows that as the amount of smoke and pollutants in the air shot up during the week of Dec. 5, 1952, so did the death rate in greater London. Estimates say the smog killed anywhere from 4,000 to 11,000 people. Credit: Paul Lioy, Rutgers University London, England, 1952 – 4000 deaths

12
Smog: Sulfur Dioxide, Acidic Aerosols and Soot (particulates)
")
13
Primary vs. secondary standards Primary standard - Primary standard - to protect p___________ h________ with an adequate margin of safety Secondary standard - Secondary standard -to protect public w_________________ (plants, animals, and property) CE 326 Principles of Environmental Engineering, Copyright © 2009 Tim Ellis, Iowa State University
 CE 326 Principles of Environmental Engineering, Copyright © 2009 Tim Ellis, Iowa State University.")
14
Primary vs. secondary pollutants Primary pollutant - discharged d__________ into the atmosphere (e.g., automobile exhaust) Secondary pollutant -f______________ in the atmosphere through a variety of chemical reactions (e.g., p____________ s_________) CE 326 Principles of Environmental Engineering, Copyright © 2009 Tim Ellis, Iowa State University
 Secondary pollutant -f______________ in the atmosphere through a variety of chemical reactions (e.g., p____________ s_________) CE 326 Principles of Environmental Engineering, Copyright © 2009 Tim Ellis, Iowa State University.")
15
Stationary vs. mobile sources Stationary Sources Contribute approximately 40% of total air pollution Contribute approximately 40% of total air pollution 98% of SO X,98% of SO X, 95% of particulates,95% of particulates, 56% of total hydrocarbons,56% of total hydrocarbons, 53% of NO X, and53% of NO X, and 22% of CO22% of CO CE 326 Principles of Environmental Engineering, Copyright © 2009 Tim Ellis, Iowa State University

16
Stationary vs. mobile sources Mobile Sources Contribute approximately 60% of total air pollution Contribute approximately 60% of total air pollution 78% of CO,78% of CO, 47% of NO X,47% of NO X, 44% of total hydrocarbons,44% of total hydrocarbons, 5% of particulates, and5% of particulates, and 2% of SO X2% of SO X CE 326 Principles of Environmental Engineering, Copyright © 2009 Tim Ellis, Iowa State University

17
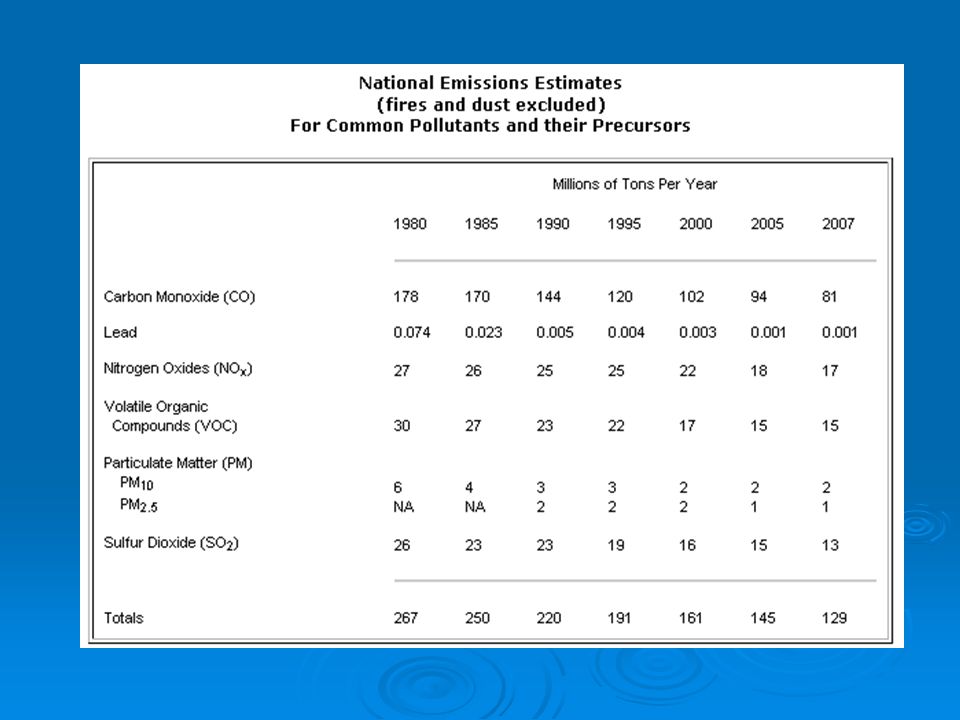
Source: WRI Estimate Based on Data from "National Air Quality and Emissions Trends Report, 1995," 1996, EPA 454/R-96-005. CE 326 Principles of Environmental Engineering, Copyright © 2009 Tim Ellis, Iowa State University National Emissions Inventory from EPASee:

19
Effects of air pollution Damage to h_______ h_______ and w_______ Damage to v_____________ and a__________ Damage to m_________ and s_________ A___________ A___________ D_________ and r__________ D_________ and r__________ D__________ c__________ a__________ D__________ c__________ a__________ I________ c__________ a__________ I________ c__________ a__________ E________________ c____________ E________________ c____________ Damage to the atmosphere, soil, and water CE 326 Principles of Environmental Engineering, Copyright © 2009 Tim Ellis, Iowa State University

20
Air Pollution Effects Statue damaged by acid rain Melon leaves damaged by ozone Feedlot

21
Definitions c__________ pollutant – pollutant that is regulated based on health or environmental criteria NAAQS - National A_______________ A_______ Quality Standards - revised in 1987, set air quality standards. SIP – State I_________________ Plan to achieve air quality standard AQR – Air Q__________ R_________________ – areas that have air quality that meets primary standards is classified as an attainment area, if not, then it’s a non-attainment area. NESHAPs – National E____________ Standards for H___________ Air P______________ MACT – Maximum Achievable C________________ T_________________ also BACT – best available control technology) – the best available control equipment that is technologically feasible and is currently available. NSPS – New S_____________ P_________________ Standards CE 326 Principles of Environmental Engineering, Copyright © 2009 Tim Ellis, Iowa State University
 – the best available control equipment that is technologically feasible and is currently available. NSPS – New S_____________ P_________________ Standards CE 326 Principles of Environmental Engineering, Copyright © 2009 Tim Ellis, Iowa State University.")
22
Seven Major Pollutants of Concern 1.Particulates 2.Sulfur Oxides (SO X ) 3.Ozone 4.Nitrogen Oxides (NO X ) 5.Carbon Monoxide (CO and other hyrdrocarbons) 6.Volatile Organic Compounds (VOCs) 7.Lead (& others: mercury, other inorganic metals, radon, HCl) CE 326 Principles of Environmental Engineering, Copyright © 2009 Tim Ellis, Iowa State University
 3.Ozone 4.Nitrogen Oxides (NO X ) 5.Carbon Monoxide (CO and other hyrdrocarbons) 6.Volatile Organic Compounds (VOCs) 7.Lead (& others: mercury, other inorganic metals, radon, HCl) CE 326 Principles of Environmental Engineering, Copyright © 2009 Tim Ellis, Iowa State University")
Similar presentations