Download presentation
Presentation is loading. Please wait.

1
“The Dark Side of the SDSS” Bob Nichol ICG, Portsmouth Thanks to all my collaborators on SDSS and other teams

2
Outline A very brief overview of Dark Energy A very brief overview of Dark Energy A very brief overview of the SDSS A very brief overview of the SDSS SDSS searches for the “Dark Side” SDSS searches for the “Dark Side” SDSS SNe ISW effect Cosmic magnification Baryon acoustic oscillations (BAO) Future experiments Future experiments
 Future experiments Future experiments")
4
WMAP: Universe at 380,000 yrs Largest oscillations that are causally connected

5
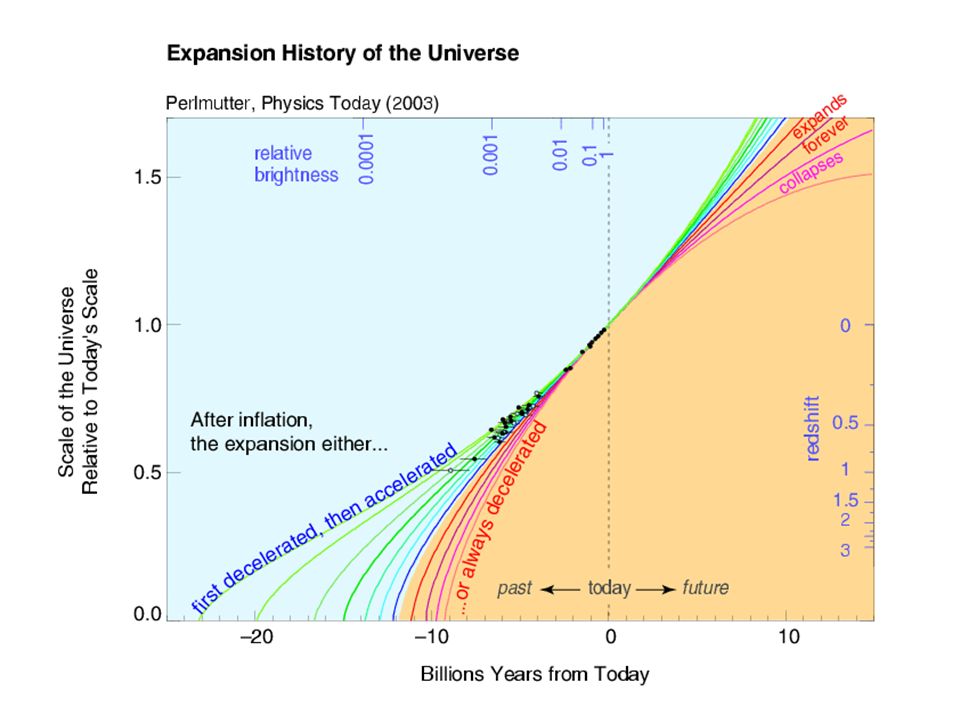
(DARK) MATTER (DARK) ENERGY CMB SN SNe and CMB force us into a Universe ~75% DE and ~25% DM. But is this true? What is DE?

6
Understanding Dark Energy (The billion dollar question) To confirm DE we need to observe it in as many ways as possible, but there are only two broad avenues: Geometrical tests (distances, volumes) Growth of structure (cluster counts) To determine what DE is, we can make progress on two simple questions: Is DE just a cosmological constant (w(z)=-1)? (Push observations to higher redshifts) Is DE a new form of stress-energy with negative effective pressure or a breakdown of General Relativity at large distances? (Study DE using different probes) As we don’t know much, all observations are important
 Is DE a new form of stress-energy with negative effective pressure or a breakdown of General Relativity at large distances. (Study DE using different probes) As we don’t know much, all observations are important.")
7
Fairbairn & Goobar 2005 DGP model for 5D gravity Also, Sawicki & Carroll (2005) & Koyama (2006) show there are noticeable differences in the evolution of structure in DGP models. This maybe testable! DGP Cosmologies

8
SDSS SNe - solidify the low z data BAO - push to high z ISW & lensing - higher z and structure formation Redshift Evolution Not just the smallest error bars

9
SDSS DR4: 849k spectra, 6670 sq degs Done 07/2005: ~700,000 redshifts, 8000 sq degs Extension (2005-2008): Legacy, SNe, Galaxy
: Legacy, SNe, Galaxy")
10
Type Ia supernovae (SNe) Type Ia supernovae (SNe) spectroscopically confirm and obtain “well-measured” light curves of ~200 SN Ia from z = 0.05 to ~ 0.4 spectroscopically confirm and obtain “well-measured” light curves of ~200 SN Ia from z = 0.05 to ~ 0.4 bridge low-z (z<0.05; LOSS, SNF) and high-z (0.3<z<1.0; ESSENCE, SNLS) sources bridge low-z (z<0.05; LOSS, SNF) and high-z (0.3<z<1.0; ESSENCE, SNLS) sources understand and minimize systematics of SN Ia as distance indicators understand and minimize systematics of SN Ia as distance indicators SN Ib/c, II, rare types SN Ib/c, II, rare types Other transients Other transients SDSSII SNe Survey Exploring DE & SNe at an epoch when DE dominates Riess et al. (2004) compilation Astier et al. (2005)
 compilation Astier et al. (2005).")
11
Use the SDSS 2.5m telescope September 1 - November 30 of 2005-2007 September 1 - November 30 of 2005-2007 Scan 300 square degrees of the sky every 2 days Scan 300 square degrees of the sky every 2 days discover supernovae and obtain multi-color light curves discover supernovae and obtain multi-color light curves Survey Area NS ARC HET MDM WHT Subaru (NTT) Follow-up
 Follow-up")
12
Color-type SN candidates using nightly g r i data: make template light curves from multi-epoch spectra (Peter Nugent) and other sets of spectra of well-observed historical SNe (SUSPECT database) Ia, Ia-pec, II-P, II-L, IIb, Ibc, Ibc-hypernova fit for redshift, extinction, stretch for Ia Able to type with >90% efficiency after ~2 - 4 epochs Photometric Typing Ia II SN2005hy II
 and other sets of spectra of well-observed historical SNe (SUSPECT database) Ia, Ia-pec, II-P, II-L, IIb, Ibc, Ibc-hypernova fit for redshift, extinction, stretch for Ia Able to type with >90% efficiency after ~2 - 4 epochs Photometric Typing Ia II SN2005hy II")
13
Team of 15 “hand-scanner” visually inspected 144,000 objects selecting nearly 10k SN targets!

14
126 spectroscopically confirmed SN Ia 13 spectroscopically probable SN Ia 6 SN Ib/c (3 hypernovae) 10 SN II (4 type IIn) 5 AGN ~hundreds of other unconfirmed SNe with good light curves (galaxy spectroscopic redshifts measured for ~25 additional Ia candidates) Focused primarily on Ia Results from 2005 = 0.21
 10 SN II (4 type IIn) 5 AGN ~hundreds of other unconfirmed SNe with good light curves (galaxy spectroscopic redshifts measured for ~25 additional Ia candidates) Focused primarily on Ia Results from 2005 = 0.21")
15
2005 spectroscopically confirmed + probable SN Ia

16
preliminary light curves deep co-added reference image search image

17
MDM ARCHET ARC

18
Preliminary No reddening =0.27 Important training set for next generation of imaging surveys e.g. DES will detect 3000 SN by ~2010 w) = 0.1 from SDSS+ESSENCE+WMAP+LSS (statistical errors only, constant w, flat Universe) SDSS data on host galaxies will allow study the scattering in this relation in greater detail Lambda = 0.74
 = 0.1 from SDSS+ESSENCE+WMAP+LSS (statistical errors only, constant w, flat Universe) SDSS data on host galaxies will allow study the scattering in this relation in greater detail Lambda =")
19
Late-time Integrated Sachs Wolfe (ISW) Effect DE also effects the growth of structure i.e. Poisson equation with dark energy: DE also effects the growth of structure i.e. Poisson equation with dark energy: In a flat, matter-dominated universe (CMB tells us this), then density fluctuations grow as: In a flat, matter-dominated universe (CMB tells us this), then density fluctuations grow as: Therefore, for a flat geometry, changes in the gravitational potential are a direct physical measurement of Dark Energy as they should be non-evolving if DE=0 Therefore, for a flat geometry, changes in the gravitational potential are a direct physical measurement of Dark Energy as they should be non-evolving if DE=0
, then density fluctuations grow as: In a flat, matter-dominated universe (CMB tells us this), then density fluctuations grow as: Therefore, for a flat geometry, changes in the gravitational potential are a direct physical measurement of Dark Energy as they should be non-evolving if DE=0 Therefore, for a flat geometry, changes in the gravitational potential are a direct physical measurement of Dark Energy as they should be non-evolving if DE=0.")
21
Experimental Set-up See also: Nolta et al, Boughn and Crittenden, Myers et al, Ashfordi et al

22
WMAP vs SDSS WMAP W band temperatures across 50% of SDSS area Density of Luminous Red Galaxies (LRGs) selected from the SDSS
 selected from the SDSS")
23
ISW and the SDSS Searching for a detection Searching for a detection LRG selection to z~0.8 (Eisenstein et al. 2001) LRG selection to z~0.8 (Eisenstein et al. 2001) 5300 sq degrees 5300 sq degrees Achromatic (no contamination) Achromatic (no contamination) Errors from 5000 CMB skies Errors from 5000 CMB skies Compared to a null result Compared to a null result >95% for all samples Low redshift sample contaminated by stars Low redshift sample contaminated by stars Individually >2 per redshift slice Individually >2 per redshift slice 4 redshift shells (not significant overlap) 4 redshift shells (not significant overlap) Yellow: “smoothed clean”, Black: “Clean”, Red: Q, Blue: W, Green: V Overall, we have detected signal at 5
 LRG selection to z~0.8 (Eisenstein et al. 2001) 5300 sq degrees 5300 sq degrees Achromatic (no contamination) Achromatic (no contamination) Errors from 5000 CMB skies Errors from 5000 CMB skies Compared to a null result Compared to a null result >95% for all samples Low redshift sample contaminated by stars Low redshift sample contaminated by stars Individually >2 per redshift slice Individually >2 per redshift slice 4 redshift shells (not significant overlap) 4 redshift shells (not significant overlap) Yellow: smoothed clean , Black: Clean , Red: Q, Blue: W, Green: V Overall, we have detected signal at 5 .")
24
ISW Predictions Halo model. Biasing of b=1,2,3 & 4 for LRGs Halo model. Biasing of b=1,2,3 & 4 for LRGs Plus SZ on small scales Plus SZ on small scales Data prefers DE model over null hypothesis at the >99% confidence for all combinations Data prefers DE model over null hypothesis at the >99% confidence for all combinations The measurement is very sensitive to n(z) assumed and m The measurement is very sensitive to n(z) assumed and m Scranton et al 2003
 assumed and m The measurement is very sensitive to n(z) assumed and m Scranton et al")
25
“It is one of the ultimate discoveries in basic science”, said Don Kennedy, editor-in-chief of Science, “It stirs our imagination even though it challenges our ability to understand.” “No longer are scientists trying to confirm the existence of dark energy. Now they are trying to find out what dark energy is made of, and what it tells us about the birth and evolution of the universe.”

26
Future ISW directions dg/dz is a very powerful probe dg/dz is a very powerful probe Only probe of DE clustering (Hu & Scranton 2004; Pogosian 2004) and highly complementary to geometrical measures of DE (SNe etc) Only probe of DE clustering (Hu & Scranton 2004; Pogosian 2004) and highly complementary to geometrical measures of DE (SNe etc) Circa 2006 (SDSS) Circa 2006 (SDSS) 8000 sq degrees (≥3 per redshift) Tighter redshift intervals (> 5 bins) Beyond Beyond ASTRO-F all-sky out to z~1.5 (>4.5 detection if there!) UKIDSS+VISTA all-sky (LRG selection to z>1) QSO catalogs (z out to 3) Cooray, Huterer, Baumann 2003
 and highly complementary to geometrical measures of DE (SNe etc) Only probe of DE clustering (Hu & Scranton 2004; Pogosian 2004) and highly complementary to geometrical measures of DE (SNe etc) Circa 2006 (SDSS) Circa 2006 (SDSS) 8000 sq degrees (≥3 per redshift) Tighter redshift intervals (> 5 bins) Beyond Beyond ASTRO-F all-sky out to z~1.5 (>4.5 detection if there!) UKIDSS+VISTA all-sky (LRG selection to z>1) QSO catalogs (z out to 3) Cooray, Huterer, Baumann 2003")
27
Dark Energy Survey (DES) 5000 sq deg multiband survey of SGP using CTIO, 40 sq deg time domain search for SNe The survey will study the expansion history of the universe and the growth of density perturbations using four distinct techniques: 1. 1.4000 sq deg survey in collaboration with the SPT 2. 2.weak lensing study 3. 3.galaxy angular power spectrum distance measurement study 4. 4.SNe Ia distance measurement study Each will independently constrain the dark energy eqn of state ~10% ISW with DES+Planck is as good as SNAP for non-constant w (Pogosian et al. 2005)
.")
28
Cosmic Magnification Gravitational magnification increases flux received from galaxies and hence allows us to see fainter galaxies, resulting in an increased apparent galaxy number density. But, it also magnifies the solid angle of the projected lensed sky which results in a decrease in the apparent galaxy number density. Therefore a competition between the two! more flux more solid angle

29
Lensing the background quasars by M101 Note, quasars lots behind M101

30
more sources come in than diluted less source come in than diluted Effects cancel

31
Hunting for quasars Quasi-stellar sources: by definition they look like stars! Traditional approaches have used UVX approach to finding quasars, i.e., quasars are “very blue” so can be isolated in color-color space using simple hyper-planes (see Richards et al. 2002). However, there is significant contamination (~40%), thus demanding spectroscopic follow-up which is very time- consuming.
. However, there is significant contamination (~40%), thus demanding spectroscopic follow-up which is very time- consuming..")
32
Probabilistic approach Use Kernel Density Estimation (KDE) to map color-color space occupied by known stars and quasars (“training sets”) Use cross-validation to “optimal” smooth the 4-D SDSS color space and obtain PDFs Fast implementation via KD-trees (Gray & Moore) ~16,000 known quasars and ~500000 stars Using a non-parametric Bayes classifier (NBC)
 to map color-color space occupied by known stars and quasars ( training sets ) Use cross-validation to optimal smooth the 4-D SDSS color space and obtain PDFs Fast implementation via KD-trees (Gray & Moore) ~16,000 known quasars and ~ stars Using a non-parametric Bayes classifier (NBC)")
33
additional cut 95% complete 95% pure Stars QSOs F stars

34
Blue points = data Black line = best fit Red line = best fit + alpha Grey shading = 1sigma 195,000 quasars 13.5 million galaxies 8 detection Now fully consistent with LCDM

36
Baryon Oscillation Gravity squeezes the gas, pressure pushes back! They oscillate Gravity squeezes the gas, pressure pushes back! They oscillate When the Universe cools below 3000K these sound waves are frozen in When the Universe cools below 3000K these sound waves are frozen in Courtesy of Wayne Hu

37
Cosmic Microwave Background Effect of this sound wave already discovered in relic light of the early universe That was the Universe at 400,000 years. Can we see these sound waves today?

38
700,000 light years 500 Million Light Years Credit: SDSS A slice of the SDSS

39
The Correlation Function The correlation function is the probability of finding pairs at a given separation, above that of a random distribution. Excess of galaxies separated by 500 million light years

40
What does it mean? We have detected the sound wave in the Universe at two very different epochs (400,000 yrs after Big Bang and present-day). This is important because our theory of gravitational structure formation predicts that such features should have been preserved. Detecting the sound wave in the galaxies is the “SMOKING GUN” that our theory is correct. Better yet, the sound wave is an object of fixed size, a “standard ruler” or “cosmic yardstick”. This means that we can measure its apparent size anywhere in the Universe, and determine how far it is away because we know its true size.
. This is important because our theory of gravitational structure formation predicts that such features should have been preserved. Detecting the sound wave in the galaxies is the SMOKING GUN that our theory is correct. Better yet, the sound wave is an object of fixed size, a standard ruler or cosmic yardstick . This means that we can measure its apparent size anywhere in the Universe, and determine how far it is away because we know its true size..")
41
FLAT GEOMETRY CREDIT: WMAP & SDSS websites CMB Looking back in time in the Universe FLAT GEOMETRY SDSS GALAXIES

42
Looking back in time in the Universe FLAT GEOMETRY CREDIT: WMAP & SDSS websites SDSS GALAXIES CMB Looking back in time in the Universe OPEN GEOMETRY

43
Looking back in time in the Universe FLAT GEOMETRY CREDIT: WMAP & SDSS websites CMB Looking back in time in the Universe CLOSED GEOMETRY SDSS GALAXIES

44
UNIVERSE IS FLAT TO 1% PRECISION

45
WFMOS over an order of magnitude increase in mapping efficiency of 2dF A quantum leap in spectroscopic efficiency. Thousands of fibres over a 1.5 degree field-of-view on an 8-meter class telescope: over an order of magnitude increase in mapping efficiency of 2dF z~1 survey with 2 million galaxies with twice LRG volume 1% accuracy KAOS purple book (Seo, Eisenstein, Blake, Glazebrook) Will get w to <5% and w’ to <20%
 Will get w to <5% and w’ to <20%.")
46
For Lambda, SNAP does slightly better than KAOS, but for other equations of state, comparable errors on w. Combining methods really help and will control systematics (angular- diameter distance compared to luminosity distance) Blake & Glazebrook (2003) give w ~ 0.1 Same philosophy as 2dF, get started as soon as possible with interesting constraints within first two years (commissioning predicted to be 2011) Many other DE experiments (AP, cluster counts, n(z) etc.) Many other physics experiments (neutrino mass, reciprocity relation) Many astrophysics experiments (galaxy evolution, galactic studies)
 Blake & Glazebrook (2003) give w ~ 0.1 Same philosophy as 2dF, get started as soon as possible with interesting constraints within first two years (commissioning predicted to be 2011) Many other DE experiments (AP, cluster counts, n(z) etc.) Many other physics experiments (neutrino mass, reciprocity relation) Many astrophysics experiments (galaxy evolution, galactic studies).")
47
WFMOS: Feasibility Study KAOS was highlighted in the Gemini Aspen process Gemini commissioned a feasibility study for the design of a wide-field MOS (WFMOS) to perform a KAOS-like survey (AAO, NOAO, Johns Hopkins, Oxford, Durham, Portsmouth, CADC, Arizona) Decision by summer 2005 Baseline design: ~5000 fibres, ~1.5deg FOV, high and low res spectrographs, Subaru Study includes, amongst other things: Detailed modeling of the observing strategies, eg z bins, galaxy targets, etc (see Bassett et al. 2004), Revisit predictions and comparisons with other surveys Better numerical simulations (Durham and Arizona) Better cost and risk estimates (eg cost savings in software) Discuss of location of WFMOS and technical issues eg. SDSS low res spectrographs at JHU Recent review was very successful and recommends advancing
, Revisit predictions and comparisons with other surveys Better numerical simulations (Durham and Arizona) Better cost and risk estimates (eg cost savings in software) Discuss of location of WFMOS and technical issues eg. SDSS low res spectrographs at JHU Recent review was very successful and recommends advancing.")
48
Dark Energy Survey (DES) 5000 sq deg multiband survey of SGP using CTIO, 40 sq deg time domain search for SNe The survey will study the expansion history of the universe and the growth of density perturbations using four distinct techniques: 1. 1.4000 sq deg survey in collaboration with the SPT 2. 2.weak lensing study 3. 3.galaxy angular power spectrum distance measurement study 4. 4.SNe Ia distance measurement study Each will independently constrain the dark energy eqn of state ~10% DES will be great for ISW and cosmic magnification as well

49
Conclusions SDSS continues for 3 more years and has been successful in finding many hundreds of SNe. The quality and quantity of SDSS data has provide several complementary detections of dark energy and dark matter, e.g., the ISW effect provided direct physical evidence that DE exists Detected cosmic magnification and consistent with LCDM. Powerful new probe of the Universe SDSS has detected the baryon oscillations in the local Universe, the “missing link” between CMB and LSS. Now have a “standard ruler”

Similar presentations
 Professor Bob Nichol (ICG, Portsmouth)>")


>")


