Download presentation
Presentation is loading. Please wait.

2
Introduction to Statistics for the Social Sciences SBS200, COMM200, GEOG200, PA200, POL200, or SOC200 Lecture Section 001, Spring 2015 Room 150 Harvill Building 8:00 - 8:50 Mondays, Wednesdays & Fridays. http://courses.eller.arizona.edu/mgmt/delaney/d15s_database_weekone_screenshot.xlsx
3
Schedule of readings Before next exam (February 13 th ) Please read chapters 1 - 4 in Ha & Ha textbook Please read Appendix D, E & F online On syllabus this is referred to as online readings 1, 2 & 3 Please read Chapters 1, 5, 6 and 13 in Plous Chapter 1: Selective Perception Chapter 5: Plasticity Chapter 6: Effects of Question Wording and Framing Chapter 13: Anchoring and Adjustment
 Please read chapters in Ha & Ha textbook Please read Appendix D, E & F online On syllabus this is referred to as online readings 1, 2 & 3 Please read Chapters 1, 5, 6 and 13 in Plous Chapter 1: Selective Perception Chapter 5: Plasticity Chapter 6: Effects of Question Wording and Framing Chapter 13: Anchoring and Adjustment")
5
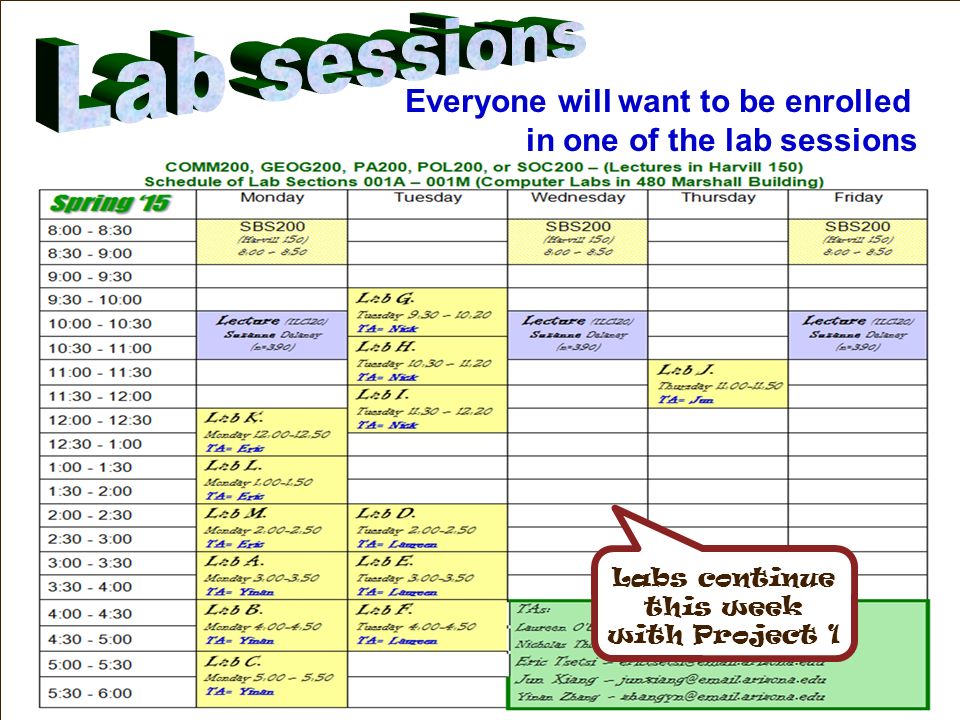
Everyone will want to be enrolled in one of the lab sessions Labs continue this week with Project 1

6
One positive correlation One negative correlation One t-test

8
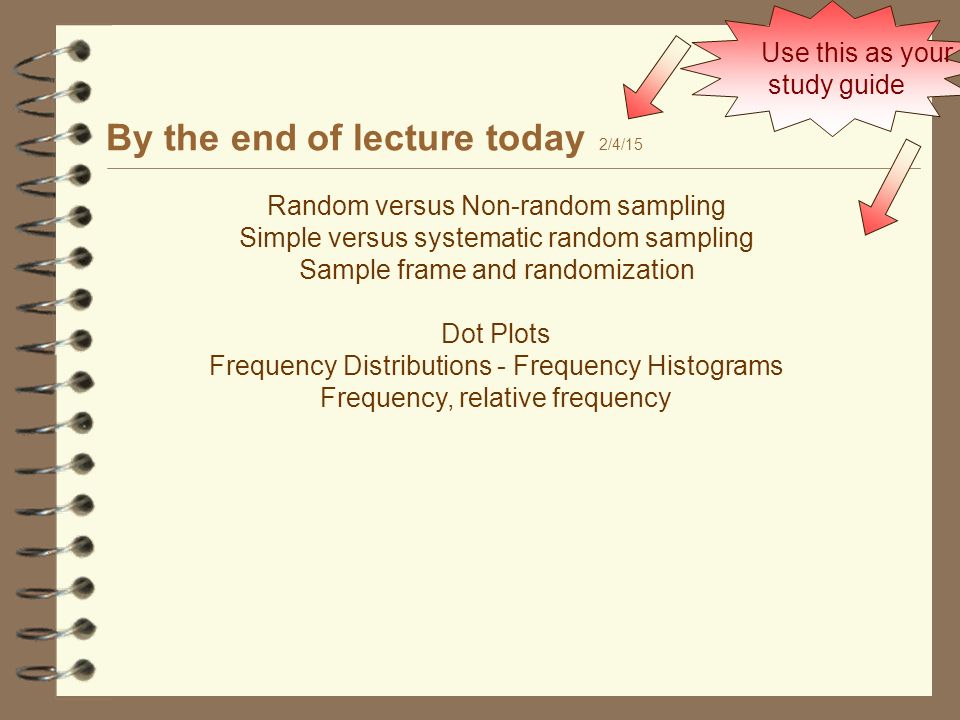
By the end of lecture today 2/4/15 Use this as your study guide Random versus Non-random sampling Simple versus systematic random sampling Sample frame and randomization Dot Plots Frequency Distributions - Frequency Histograms Frequency, relative frequency

9
Homework due Friday, Feb 6 th On class website: please print and complete homework worksheet # 5 Describing Data Visually using MS Excel

10
http://2016.election-polls.org/President/Republican-Primary/?political_poll=1058 Who is most popular? a. Chris Christy b. Dr. Ben Carson c. Jeb Bush d. Mike Huckabee e. Mitt Romney f. Rand Paul g. Rick Perry h. Scott Walker i. Ted Cruz j. Undecided We asked 400 Republicans “Who is your favorite candidate?” Data from January 30 th 2015

11
http://2016.election-polls.org/President/Republican-Primary/?political_poll=1058 Who is your favorite candidate Candidate Frequency Mitt Romney84 Jeb Bush68 Dr. Ben Carson 60 Scott Walker44 Ted Cruz36 Mike Huckabee36 Chris Christy28 Undecided20 Rand Paul16 Rick Perry 8 Homework Preview Simple Frequency Table – Qualitative Data We asked 400 Republicans “Who is your favorite candidate?” Relative Frequency.2100.1700.1500.1100.0900.0700.0500.0400.0200 Just divide each frequency by total number Please note: 80 /400 =.2100 68 /400 =.1700 60 /.400 =.1500 Percent 21% 17% 15% 11% 9% 7% 5% 4% 2% If one million Republicans voted today how many would vote for each candidate? Number expected to vote 210,000 170,000 150,000 110,000 90,000 70,000 50,000 40,000 20,000 Just multiply each relative frequency by 100 Please note:.2100 x 100 = 21%.1700 x 100 = 17%.1500 x 100 = 15% Just multiply each relative frequency by one million Please note:.2100 x million = 210,000.1700 x million = 170,000.1500 x million = 150,000 Data from January 30 th 2015

12
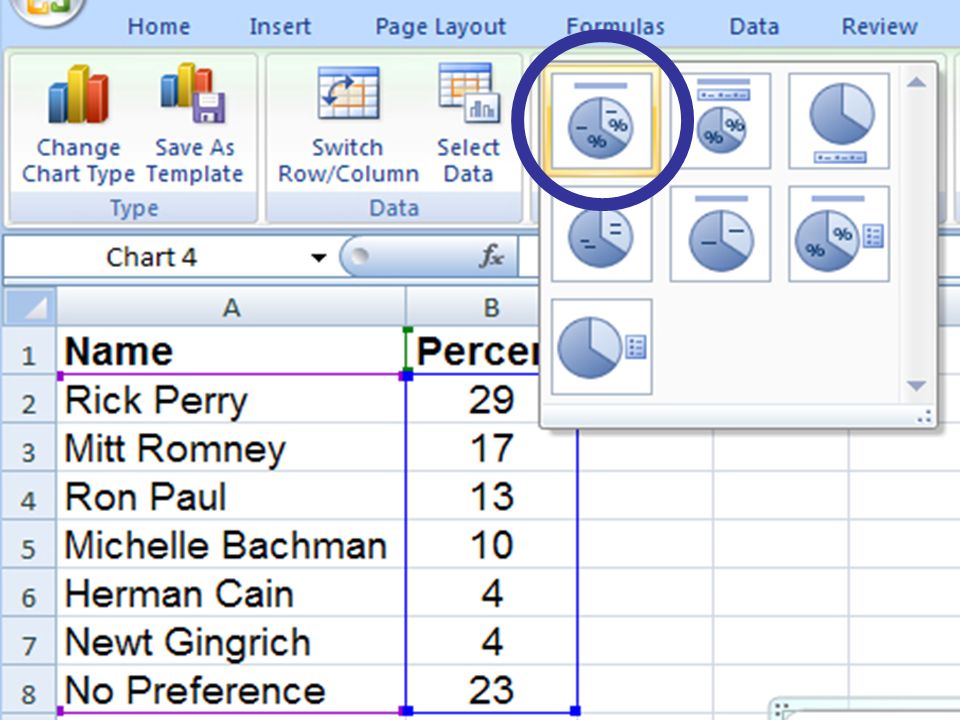
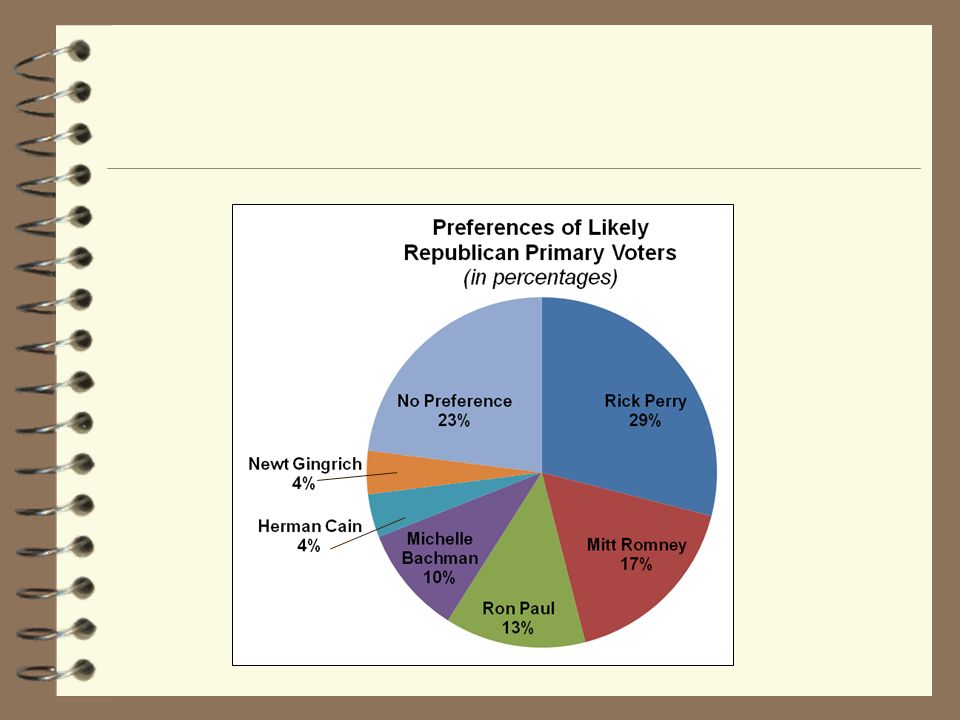
Data based on Gallup poll on 8/24/11 Who is your favorite candidate Candidate Frequency Rick Perry29 Mitt Romney17 Ron Paul13 Michelle Bachman10 Herman Cain 4 Newt Gingrich 4 No preference23 Homework Preview Simple Frequency Table – Qualitative Data We asked 100 Republicans “Who is your favorite candidate?” Relative Frequency.2900.1700.1300.1000.0400.2300 Just divide each frequency by total number Please note: 29 /100 =.2900 17 /100 =.1700 13 /100 =.1300 4 /100 =.0400 Percent 29% 17% 13% 10% 4% 23% If 22 million Republicans voted today how many would vote for each candidate? Number expected to vote 6,380,000 3,740,000 2,860,000 2,200,000 880,000 5,060,000 Just multiply each relative frequency by 100 Please note:.2900 x 100 = 29%.1700 x 100 = 17%.1300 x 100 = 13%.0400 x 100 = 4% Just multiply each relative frequency by 22 million Please note:.2900 x 22m = 6,667k.1700 x 22m = 3,740k.1300 x 22m = 2,860k.0400 x 22m= 880k Data from August 24 th 2011 Data from August 24 th 2011

16
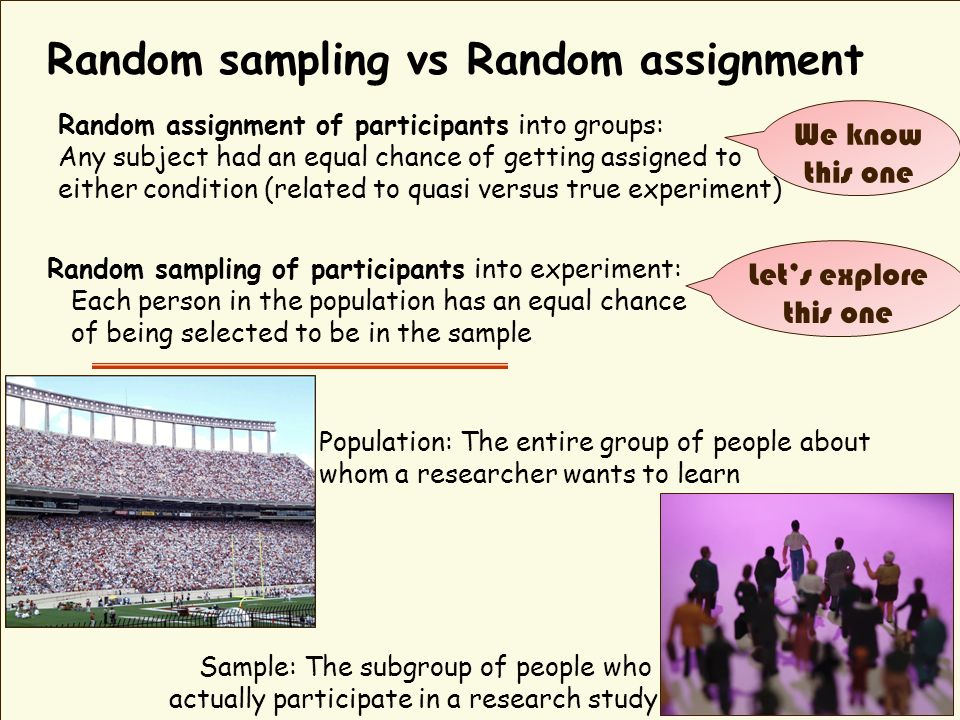
Random sampling vs Random assignment Random sampling of participants into experiment: Each person in the population has an equal chance of being selected to be in the sample Population: The entire group of people about whom a researcher wants to learn Sample: The subgroup of people who actually participate in a research study Random assignment of participants into groups: Any subject had an equal chance of getting assigned to either condition (related to quasi versus true experiment) We know this one Let’s explore this one
 We know this one Let’s explore this one")
17
Sample versus population (census) How is a census different from a sample? Census measures each person in the specific population Sample measures a subset of the population and infers about the population – representative sample is good What’s better? Use of existing survey data U.S. Census Family size, fertility, occupation The General Social Survey Surveys sample of US citizens over 1,000 items Same questions asked each year

18
Parameter – Measurement or characteristic of the population Usually unknown (only estimated) Usually represented by Greek letters (µ) Population (census) versus sample Parameter versus statistic pronounced “mu ” pronounced “mew ” Statistic – Numerical value calculated from a sample Usually represented by Roman letters (x) pronounced “x bar ”
 Usually represented by Greek letters (µ) Population (census) versus sample Parameter versus statistic pronounced mu pronounced mew Statistic – Numerical value calculated from a sample Usually represented by Roman letters (x) pronounced x bar")
19
Descriptive statistics - organizing and summarizing data Descriptive or inferential? Inferential statistics - generalizing beyond actual observations making “inferences” based on data collected What is the average height of the basketball team? In this class, percentage of students who support the death penalty? Based on the data collected from the students in this class we can conclude that 60% of the students at this university support the death penalty Measured all of the players and reported the average height Measured all of the students in class and reported percentage who said “yes” Measured only a sample of the players and reported the average height for team Measured only a sample of the students in class and reported percentage who said “yes” To determine this we have to consider the methodologies used in collecting the data

20
Descriptive statistics - organizing and summarizing data Descriptive or inferential? Inferential statistics - generalizing beyond actual observations making “inferences” based on data collected Men are in general taller than women Shoe size is not a good predictor of intelligence Blondes have more fun The average age of students at the U of A is 21 Measured all of the citizens of Arizona and reported heights Measured all of the shoe sizes and IQ of students of 20 universities Asked 500 actresses to complete a happiness survey Asked all students in the fraternities and sororities their age

21
Descriptive statistics - organizing and summarizing data Descriptive vs inferential statistics Inferential statistics - generalizing beyond actual observations making “inferences” based on data collected To determine this we have to consider the methodologies used in collecting the data

22
Simple random sampling: each person from the population has an equal probability of being included Sample frame = how you define population Sample frame = how you define population =RANDBETWEEN(1,115) Let’s take a sample …a random sample Question: Average weight of U of A football player Sample frame population of the U of A football team Or, you can use excel to provide number for random sample Random number table – List of random numbers Random number table – List of random numbers 64 Pick 64 th name on the list (64 is just an example here) Pick 24 th name on the list
 Let’s take a sample …a random sample Question: Average weight of U of A football player Sample frame population of the U of A football team Or, you can use excel to provide number for random sample Random number table – List of random numbers Random number table – List of random numbers 64 Pick 64 th name on the list (64 is just an example here) Pick 24 th name on the list")
23
Systematic random sampling: A probability sampling technique that involves selecting every technique that involves selecting every kth person from a sampling frame Other examples of systematic random sampling 1) check every 2000 th light bulb 2) survey every 10 th voter You pick the number
 check every 2000 th light bulb 2) survey every 10 th voter You pick the number")
24
Stratified sampling: sampling technique that involves dividing a sample into subgroups (or strata) and then selecting samples from each of these groups - sampling technique can maintain ratios for the different groups Average number of speeding tickets 17.7% of sample are Pre-business majors 4.6% of sample are Psychology majors 4.6% of sample are Psychology majors 2.8% of sample are Biology majors 2.8% of sample are Biology majors 2.4% of sample are Architecture majors 2.4% of sample are Architecture majors etc etc Average cost for text books for a semester 12% of sample is from California 7% of sample is from Texas 6% of sample is from Florida 6% from New York 4% from Illinois 4% from Ohio 4% from Pennsylvania 3% from Michigan etc
 and then selecting samples from each of these groups - sampling technique can maintain ratios for the different groups Average number of speeding tickets 17.7% of sample are Pre-business majors 4.6% of sample are Psychology majors 4.6% of sample are Psychology majors 2.8% of sample are Biology majors 2.8% of sample are Biology majors 2.4% of sample are Architecture majors 2.4% of sample are Architecture majors etc etc Average cost for text books for a semester 12% of sample is from California 7% of sample is from Texas 6% of sample is from Florida 6% from New York 4% from Illinois 4% from Ohio 4% from Pennsylvania 3% from Michigan etc")
25
Cluster sampling: sampling technique divides a population sample into subgroups (or clusters) by region or physical space. Can either measure everyone or select samples for each cluster Textbook prices Southwest schools Southwest schools Midwest schools Midwest schools Northwest schools Northwest schools etc etc Average student income, survey by Old main area Old main area Near McClelland Around Main Gate etc Patient satisfaction for hospital 7 th floor (near maternity ward) 7 th floor (near maternity ward) 5 th floor (near physical rehab) 5 th floor (near physical rehab) 2 nd floor (near trauma center) 2 nd floor (near trauma center) etc etc
 7 th floor (near maternity ward) 5 th floor (near physical rehab) 5 th floor (near physical rehab) 2 nd floor (near trauma center) 2 nd floor (near trauma center) etc etc.")
26
Snowball sampling: a non-random technique in which one or more members of a population are located and used to lead the researcher to other members of the population Used when we don’t have any other way of finding them - also vulnerable to biases Convenience sampling: sampling technique that involves sampling people nearby. A non-random sample and vulnerable to bias Judgment sampling: sampling technique that involves sampling people who an expert says would be useful. A non-random sample and vulnerable to bias Non-random sampling is vulnerable to bias

27
You’ve gathered your data…what’s the best way to display it??

28
141720252129 162527181613 112119242011 202816131714 14168171711 11141719248 16122592017 1114161822 1418231215 1013151111 Describing Data Visually 81114171924 81214172025 91215172025 101315172025 111316172027 111316172128 111416182129 1114161822 1114161823 1114161924 Lists of numbers too hard to see patterns Organizing numbers helps Graphical representation even more clear This is a dot plot

29
Describing Data Visually 81214171924 81214172025 91315172025 101315172025 111316172027 111316172128 111416182129 1114161822 1114161823 1114161924 Measuring the “frequency of occurrence” Then figure “frequency of occurrence” for the bins We’ve got to put these data into groups (“bins”)
")
30
Frequency distributions Frequency distributions an organized list of observations and their frequency of occurrence How many kids are in your family? What is the most common family size?

31
Another example: How many kids in your family? 3 4 8 2 2 1 4 1 14 2 Number of kids in family 1313 1414 2424 2828 214

Similar presentations


 - Room 201 s c r e e n Row A Row B Row C Row D Row E Row F Row G Row H 131211109 87 Row A 14131211109.>")

