Download presentation
Presentation is loading. Please wait.

1
{ The Hills Fuel Poverty Review An overview of recommendations and their implications for practitioners. East Midlands Carbon Action Network, 20 th September, 2012 Lauren Probert, Loughborough University

2
“…that as far as reasonably practicable persons do not live in fuel poverty” WARM HOMES AND ENERGY CONSERVATION ACT 2000

3
UNIT PRICE OF FUEL QUANTITY OF FUEL REQUIRED X HOUSEHOL D INCOME X ≥ FUEL POVERTY CAN BE SAID TO EXIST WHERE TO MAINTAIN AN ADEQUATE LEVEL OF WARMTH IN THE HOME: 10%

4
Uses fixed proportion of income (10%). Proportion based upon 1988 figures. Ratio effect means that any change to spending has 10x more impact than change to income. Factors such as fuel prices (but also temperature regimes and low misreported incomes) have enormous impact and drown out positive impacts of schemes. Only a headcount figure, doesn’t account for depth. Income taken Before Housing Costs. Income not equivalised. Includes those on very high incomes (against principles of WHECA).
 have enormous impact and drown out positive impacts of schemes. Only a headcount figure, doesn’t account for depth. Income taken Before Housing Costs. Income not equivalised. Includes those on very high incomes (against principles of WHECA)..")
5
“The Government is committed to focusing the available resources where they will be most effective in tackling the problems underlying fuel poverty. The Government therefore intends to initiate an independent review of the fuel poverty target and definition before the end of the year.” (p. 62)
.")
9
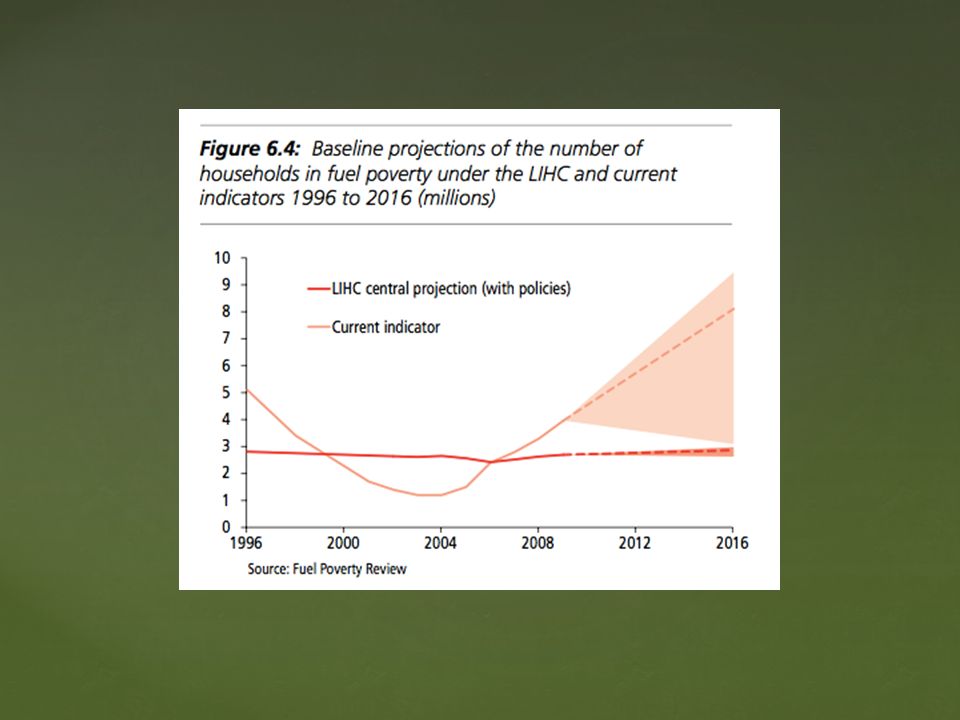
Number of households in fuel poverty (Boardman definition): 4m Number of households in fuel poverty (Hills definition): 2.7m Number of individuals in fuel poverty (Boardman definition): 7.4m Number of individuals in fuel poverty (Hills definition): 7.8m (2009 data)
: 4m Number of households in fuel poverty (Hills definition): 2.7m Number of individuals in fuel poverty (Boardman definition): 7.4m Number of individuals in fuel poverty (Hills definition): 7.8m (2009 data)")
10
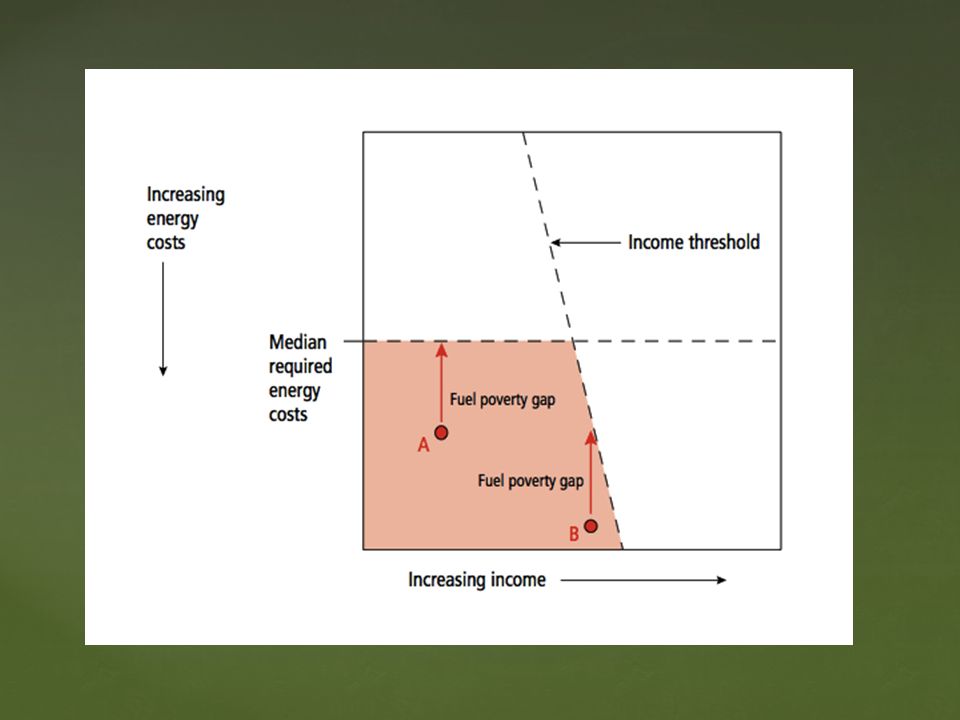
Aggregate fuel poverty gap (2009 data): £1.9 billion. Mean fuel poverty gap (2009 data): £414/household.
: £414/household..")
13
RegionBoardman (%)Hills (%) East England10.8 East Midlands9.710.3 London9.414.1 North East6.76.4 North West17.015.5 South East11.311.0 South West9.7 West Midlands13.712.5 Yorkshire and the Humber11.79.7
Hills (%) East England10.8 East Midlands London North East North West South East South West9.7 West Midlands Yorkshire and the Humber")
14
Uses fixed proportion of income (10%) Proportion based upon 1988 figures. Ratio effect means that any change to spending has 10x more impact than change to income. Factors such as fuel prices (but also temperature regimes and low misreported incomes) have enormous impact and drown out positive impacts of schemes. Only a headcount figure, doesn’t account for depth. Income taken Before Housing Costs. Income not equivalised. Includes those on very high incomes (against principles of WHECA).
 have enormous impact and drown out positive impacts of schemes. Only a headcount figure, doesn’t account for depth. Income taken Before Housing Costs. Income not equivalised. Includes those on very high incomes (against principles of WHECA)..")
15
Consultation Response Deadline: 30 th November 2012 http://www.decc.gov.uk/en/content/cms/consultations/fuel_poverty/fuel_poverty.aspx

16
Will the new definition impact upon practitioners? In practice, proxies are used anyhow. ECO criteria already set! Difficulties in finding the fuel poor (i.e., SPG). May change focus and means of engagement. Maintaining current target will require intensive effort (but are Government likely to support that?) Will the 2016 target change (and reduce priority?)
. May change focus and means of engagement. Maintaining current target will require intensive effort (but are Government likely to support that ) Will the 2016 target change (and reduce priority ).")
17
{ l.probert@lboro.ac.uk Thank you.

Similar presentations


 Oliver Savage Climate Action Team.>")


