Download presentation
Presentation is loading. Please wait.

1
Sea Level Change Measurements: Estimates from Altimeters Understanding Sea Level Rise and Variability June 6-9, 2006 Paris, France R. S. Nerem, University of Colorado and a host of others

2
What Are We Trying to Do? We would like to measure changes in the volume of the ocean water over time We would like to measure changes in the volume of the ocean water over time This is difficult to do, so instead we measure changes in the level of the top surface This is difficult to do, so instead we measure changes in the level of the top surface When averaged globally, gives us changes in global mean sea level When averaged globally, gives us changes in global mean sea level If possible, correct this for changes in the volume of the ocean basins (GIA, etc.) If possible, correct this for changes in the volume of the ocean basins (GIA, etc.)
 If possible, correct this for changes in the volume of the ocean basins (GIA, etc.).")
3
Why T/P and Jason? Every component of these measurement systems are of the highest possible fidelity (dual-frequency, POD, atmospheric delays (ionosphere, troposphere), tidal aliasing, etc.) Every component of these measurement systems are of the highest possible fidelity (dual-frequency, POD, atmospheric delays (ionosphere, troposphere), tidal aliasing, etc.) Altimeters in sun-synchronous orbits have undesirable tidal aliasing characteristics, especially for detecting climate signals Altimeters in sun-synchronous orbits have undesirable tidal aliasing characteristics, especially for detecting climate signals Nevertheless, combinations of sun-synchronous altimeters (ERS, etc.) with T/P and Jason have been used successfully to study sea level change in the polar regions above ±66° latitude. Nevertheless, combinations of sun-synchronous altimeters (ERS, etc.) with T/P and Jason have been used successfully to study sea level change in the polar regions above ±66° latitude.
, tidal aliasing, etc.) Every component of these measurement systems are of the highest possible fidelity (dual-frequency, POD, atmospheric delays (ionosphere, troposphere), tidal aliasing, etc.) Altimeters in sun-synchronous orbits have undesirable tidal aliasing characteristics, especially for detecting climate signals Altimeters in sun-synchronous orbits have undesirable tidal aliasing characteristics, especially for detecting climate signals Nevertheless, combinations of sun-synchronous altimeters (ERS, etc.) with T/P and Jason have been used successfully to study sea level change in the polar regions above ±66° latitude. Nevertheless, combinations of sun-synchronous altimeters (ERS, etc.) with T/P and Jason have been used successfully to study sea level change in the polar regions above ±66° latitude..")
4
TOPEX/Poseidon and Jason 10-day Groundtrack

5
TOPEX Sea Level: January 1998

6
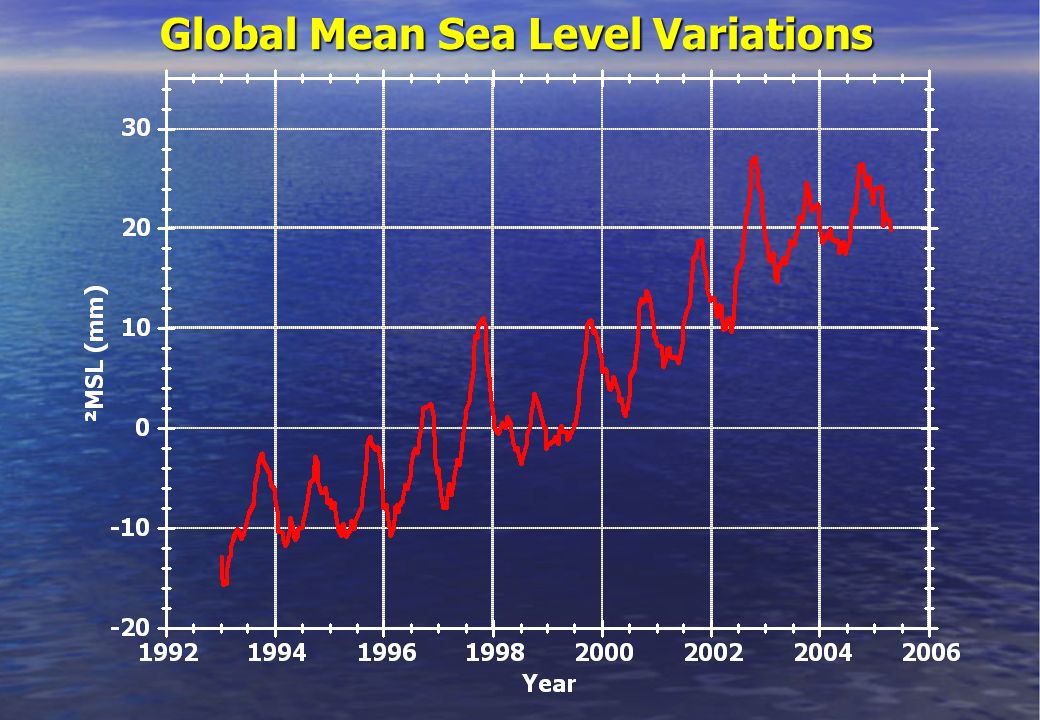
Global Mean Sea Level Variations

8
Seasonal variations removed

9
Global Mean Sea Level Variations Seasonal variations removed GIA correction applied (0.3 mm/year) Rate = 3.2 ± 0.4 mm/year http://sealevel.colorado.edu
 Rate = 3.2 ± 0.4 mm/year")
10
Glacial Isostatic Adjustment -7.0 -2.0 -1.5 -1.0 -0.5 0 0.5 1.0 1.5 2.0 25.0 Present-Day Radial Deformation (mm/year) [Milne, 2005]
![Glacial Isostatic Adjustment Present-Day Radial Deformation (mm/year) [Milne, 2005]](http://images.slideplayer.com/25/7689427/slides/slide_10.jpg "Glacial Isostatic Adjustment Present-Day Radial Deformation (mm/year) [Milne, 2005]")
11
Effect of High Latitude Altimeter Data

12
T/P/Jason GMSL Trends

13
Total versus Thermosteric Sea Level Change [Willis et al., 2005]
![Total versus Thermosteric Sea Level Change [Willis et al., 2005]](http://images.slideplayer.com/25/7689427/slides/slide_13.jpg "Total versus Thermosteric Sea Level Change [Willis et al., 2005]")
14
Altimeter - Thermosteric Sea Level

15
Sea Level Trend versus Latitude (1993-2005)
")
16
Sea Level Variations versus Latitude

17
Global Sea Level Trends: 1993-2005

18
Global Mean Sea Level Variations Seasonal variations removed GIA correction applied (0.3 mm/year) Rate = 3.2 ± 0.4 mm/year http://sealevel.colorado.edu
 Rate = 3.2 ± 0.4 mm/year")
19
GPS ANTENNA (JPL) WVR (JPL) BUBBLER (NOAA) ACOUSTIC (NOAA) EQUIP SHED MET SENSORS Point Arguello, CA + 54 m + 27 m + 6 m LASER SENSOR (CU) Platform Harvest Calibration Site
 WVR (JPL) BUBBLER (NOAA) ACOUSTIC (NOAA) EQUIP SHED MET SENSORS Point Arguello, CA + 54 m + 27 m + 6 m LASER SENSOR (CU) Platform Harvest Calibration Site")
20
Harvest Altimeter Bias Results [Haines et al., 2006]
![Harvest Altimeter Bias Results [Haines et al., 2006]](http://images.slideplayer.com/25/7689427/slides/slide_20.jpg "Harvest Altimeter Bias Results [Haines et al., 2006]")
21
Comparison of T/P and Jason-1 Map of Jason-1 relative bias (relative to global mean of 15.0 cm) –A single calibration site can never accurately determine the true global average –SSH bias affected by multiple sources of geographically correlated errors (SSB, orbit, troposphere, etc) [Chambers, 2006]
![Comparison of T/P and Jason-1 Map of Jason-1 relative bias (relative to global mean of 15.0 cm) –A single calibration site can never accurately determine the true global average –SSH bias affected by multiple sources of geographically correlated errors (SSB, orbit, troposphere, etc) [Chambers, 2006]](http://images.slideplayer.com/25/7689427/slides/slide_21.jpg "Comparison of T/P and Jason-1 Map of Jason-1 relative bias (relative to global mean of 15.0 cm) –A single calibration site can never accurately determine the true global average –SSH bias affected by multiple sources of geographically correlated errors (SSB, orbit, troposphere, etc) [Chambers, 2006]")
22
Tide Gauges Available for Altimeter Calibration

23
Tide Gauges versus Satellite Altimetry

24
TOPEX and Jason Tide Gauge Calibrations TOPEX Jason

25
Error Analysis of the Trend Formal error = 0.05 mm/year Formal error = 0.05 mm/year After accounting for serial correlation of residuals, the error scales to 0.2 mm/year After accounting for serial correlation of residuals, the error scales to 0.2 mm/year Tide gauge calibration error = 0.4 mm/year (dominated by errors in the land motion corrections) Tide gauge calibration error = 0.4 mm/year (dominated by errors in the land motion corrections) This gives a total error in the trend of 0.44 mm/year This gives a total error in the trend of 0.44 mm/year Thus our final trend estimate is +3.2 ± 0.4 mm/year over 1993-2005 Thus our final trend estimate is +3.2 ± 0.4 mm/year over 1993-2005 Ignores effects of decadal variability, other smaller error sources Ignores effects of decadal variability, other smaller error sources
 Tide gauge calibration error = 0.4 mm/year (dominated by errors in the land motion corrections) This gives a total error in the trend of 0.44 mm/year This gives a total error in the trend of 0.44 mm/year Thus our final trend estimate is +3.2 ± 0.4 mm/year over Thus our final trend estimate is +3.2 ± 0.4 mm/year over Ignores effects of decadal variability, other smaller error sources Ignores effects of decadal variability, other smaller error sources")
26
Estimating Biases Between Instruments

27
What Have We Learned from Altimetry? A great leap forward has occurred in sea level change science in the last decade, largely due to the influx of satellite altimeter measurements. A great leap forward has occurred in sea level change science in the last decade, largely due to the influx of satellite altimeter measurements. Satellite altimetry has observed an average increase in sea level of 3.2 mm/year over 1993-2005, which probably reflects an acceleration versus the 20th century rate (~1.8 mm/year). Satellite altimetry has observed an average increase in sea level of 3.2 mm/year over 1993-2005, which probably reflects an acceleration versus the 20th century rate (~1.8 mm/year). Roughly half the current rise may be attributed to thermal expansion, leaving half to the addition of water to the oceans (likely from melting of mountain glaciers and polar ice). Roughly half the current rise may be attributed to thermal expansion, leaving half to the addition of water to the oceans (likely from melting of mountain glaciers and polar ice). Large spatial variability in the sea level rise signal has been observed. Large spatial variability in the sea level rise signal has been observed. Together, altimetry and satellite gravity measurements provide a powerful means of determining the amount of sea level change and the causes of the change. Together, altimetry and satellite gravity measurements provide a powerful means of determining the amount of sea level change and the causes of the change.
. Satellite altimetry has observed an average increase in sea level of 3.2 mm/year over , which probably reflects an acceleration versus the 20th century rate (~1.8 mm/year). Roughly half the current rise may be attributed to thermal expansion, leaving half to the addition of water to the oceans (likely from melting of mountain glaciers and polar ice). Roughly half the current rise may be attributed to thermal expansion, leaving half to the addition of water to the oceans (likely from melting of mountain glaciers and polar ice). Large spatial variability in the sea level rise signal has been observed. Large spatial variability in the sea level rise signal has been observed. Together, altimetry and satellite gravity measurements provide a powerful means of determining the amount of sea level change and the causes of the change. Together, altimetry and satellite gravity measurements provide a powerful means of determining the amount of sea level change and the causes of the change..")
28
Sea Level Change Satellite Missions Pending approval In orbitApproved 00010203040506070809101112 13 14 JASON-2/OSTM TOPEX/POSEIDON JASON-1 Envisat RA-2 Medium accuracy RA (SSH) from high-inclination orbit High accuracy RA (SSH) from mid-inclination orbit CRYOSAT-2 OceanSat-3 AltiKa ERS-2 RA GMES S-3 ICESAT Geosat Follow-On NPOESS GRACE Ice Altimetry Temporal Gravity (ocean mass) GRACE follow-on ? ICESAT-2 ? Dreams Jason-3 ?

29
Jason-3: New Orbit? The current T/P/J-1/J-2 orbit has a high 1336 km altitude (increased s/c costs), a relatively low 66° inclination, and moderate spatial resolution (10-day repeating orbit). The current T/P/J-1/J-2 orbit has a high 1336 km altitude (increased s/c costs), a relatively low 66° inclination, and moderate spatial resolution (10-day repeating orbit). Lower altitude (800-1000 km) orbits exist that have better latitude coverage (~78°), good tidal aliasing characteristics, and variable repeat periods (10-21 days), which would provide a lower-cost mission with broader scientific applications. Lower altitude (800-1000 km) orbits exist that have better latitude coverage (~78°), good tidal aliasing characteristics, and variable repeat periods (10-21 days), which would provide a lower-cost mission with broader scientific applications. While continuing with Jason-3 in the T/P orbit is highly desirable for sea level change applications, alternative orbits could be considered. While continuing with Jason-3 in the T/P orbit is highly desirable for sea level change applications, alternative orbits could be considered.
, a relatively low 66° inclination, and moderate spatial resolution (10-day repeating orbit). The current T/P/J-1/J-2 orbit has a high 1336 km altitude (increased s/c costs), a relatively low 66° inclination, and moderate spatial resolution (10-day repeating orbit). Lower altitude ( km) orbits exist that have better latitude coverage (~78°), good tidal aliasing characteristics, and variable repeat periods (10-21 days), which would provide a lower-cost mission with broader scientific applications. Lower altitude ( km) orbits exist that have better latitude coverage (~78°), good tidal aliasing characteristics, and variable repeat periods (10-21 days), which would provide a lower-cost mission with broader scientific applications. While continuing with Jason-3 in the T/P orbit is highly desirable for sea level change applications, alternative orbits could be considered. While continuing with Jason-3 in the T/P orbit is highly desirable for sea level change applications, alternative orbits could be considered..")
30
Jason-3: New Orbit Considerations Sun-synchronous orbits undesirable Sun-synchronous orbits undesirable Non-repeating orbits undesirable Non-repeating orbits undesirable Continuation of the T/P/J-1/J-2 sea level time series Continuation of the T/P/J-1/J-2 sea level time series Tide gauge calibration of data from a new orbit (offset with Jason-2) Tide gauge calibration of data from a new orbit (offset with Jason-2) Reference mean sea surface, geoid gradients Reference mean sea surface, geoid gradients Tidal aliasing characteristics Tidal aliasing characteristics Tide modeling errors Tide modeling errors Tradeoffs of temporal/spatial sampling (repeat period) Tradeoffs of temporal/spatial sampling (repeat period) Latitudinal coverage (inclination) Latitudinal coverage (inclination) Altitude Altitude
 Tide gauge calibration of data from a new orbit (offset with Jason-2) Reference mean sea surface, geoid gradients Reference mean sea surface, geoid gradients Tidal aliasing characteristics Tidal aliasing characteristics Tide modeling errors Tide modeling errors Tradeoffs of temporal/spatial sampling (repeat period) Tradeoffs of temporal/spatial sampling (repeat period) Latitudinal coverage (inclination) Latitudinal coverage (inclination) Altitude Altitude")
31
Conclusions We have made some great progress in sea level change science using satellite altimetry, but longer datasets are needed to study climate signals. We have made some great progress in sea level change science using satellite altimetry, but longer datasets are needed to study climate signals. The 13-year continuous satellite record of sea level change is at significant risk, with the possibility of gaps in the future, and no concrete plans for ensuring the record after Jason-2 (20 years). The 13-year continuous satellite record of sea level change is at significant risk, with the possibility of gaps in the future, and no concrete plans for ensuring the record after Jason-2 (20 years). While it is highly desirable to continue in the T/P orbit, alternative orbits with lower altitude and higher inclination exist that could be considered to continue the T/P/J-1/J-2 sea level time series. While it is highly desirable to continue in the T/P orbit, alternative orbits with lower altitude and higher inclination exist that could be considered to continue the T/P/J-1/J-2 sea level time series. Calibration of the altimeter instruments using tide gauges is an indispensable component of any altimeter-based sea level monitoring program. Calibration of the altimeter instruments using tide gauges is an indispensable component of any altimeter-based sea level monitoring program.
. The 13-year continuous satellite record of sea level change is at significant risk, with the possibility of gaps in the future, and no concrete plans for ensuring the record after Jason-2 (20 years). While it is highly desirable to continue in the T/P orbit, alternative orbits with lower altitude and higher inclination exist that could be considered to continue the T/P/J-1/J-2 sea level time series. While it is highly desirable to continue in the T/P orbit, alternative orbits with lower altitude and higher inclination exist that could be considered to continue the T/P/J-1/J-2 sea level time series. Calibration of the altimeter instruments using tide gauges is an indispensable component of any altimeter-based sea level monitoring program. Calibration of the altimeter instruments using tide gauges is an indispensable component of any altimeter-based sea level monitoring program..")
Similar presentations
>")
, Mallorca, SPAIN. 2 National Oceanography Centre, Southampton,>")
 Rise Estimates Average of Trends (Douglas et.>")


 Satellite Altimetry>")
 Satellite Altimetry IMCS Building Room 214C 732-932-6555 ext 251 609-933-7753.>")


