Download presentation
Presentation is loading. Please wait.

1
Concentrated Poverty and Regional Equity Kathy Pettit Tom Kingsley November 15,2012 1

2
National Neighborhood Indicators Partnership (NNIP) Collaborative effort since 1995 Urban Institute & local partners; now 37 cities Local partners build and operate neighborhood information systems for their communities UI coordinates network and plans joint activities Local success required three innovations 1. Data and technology 2. Institutions 3.Using information for change

3
National Neighborhood Indicators Partners Atlanta Austin Baltimore Boston Camden Chattanooga Chicago Cleveland Columbus Dallas Denver Des Moines Detroit Grand Rapids Hartford Indianapolis Kansas City Louisville Memphis Miami Milwaukee Minneapolis-St. Paul Nashville New Haven New Orleans New York City Oakland Philadelphia Pinellas County Pittsburgh Portland Providence Sacramento Saint Louis San Antonio Seattle Washington, DC

4
Data from Local Sources Neighborhood level Employment Births, deaths Crimes TANF, Food Stamps Child care Health Schools Parcel level Prop. sales, prices Prop. ownership Code violations Assessed values Tax arrears Vacant/abandoned City/CDC plans

5
Data from Other Sources National Data Sources American Community Survey Local Employment Dynamics Housing + Transportation Costs Home Mortgage Disclosure Act Original Data Collection Property conditions Asset/deficit mapping Community/school surveys Program service data Client surveys Focus groups Ethnography Community journalism

6
New Types of Institutions Mostly outside of local government Nonprofits, university centers, alliances Four include metropolitan planning councils But partner with resident groups, nonprofits, government, and other stakeholders Long-term and multifaceted interests Positioned to maintain trust of data providers and users

7
Shared Mission: Information for Change “Democratizing Information” Facilitate the direct use of data by stakeholders Data serves many varied audiences and purposes But a central focus on strengthening and empowering low-income neighborhoods Information promotes collaboration Acts as a bridge among public agencies, nonprofits, businesses

8
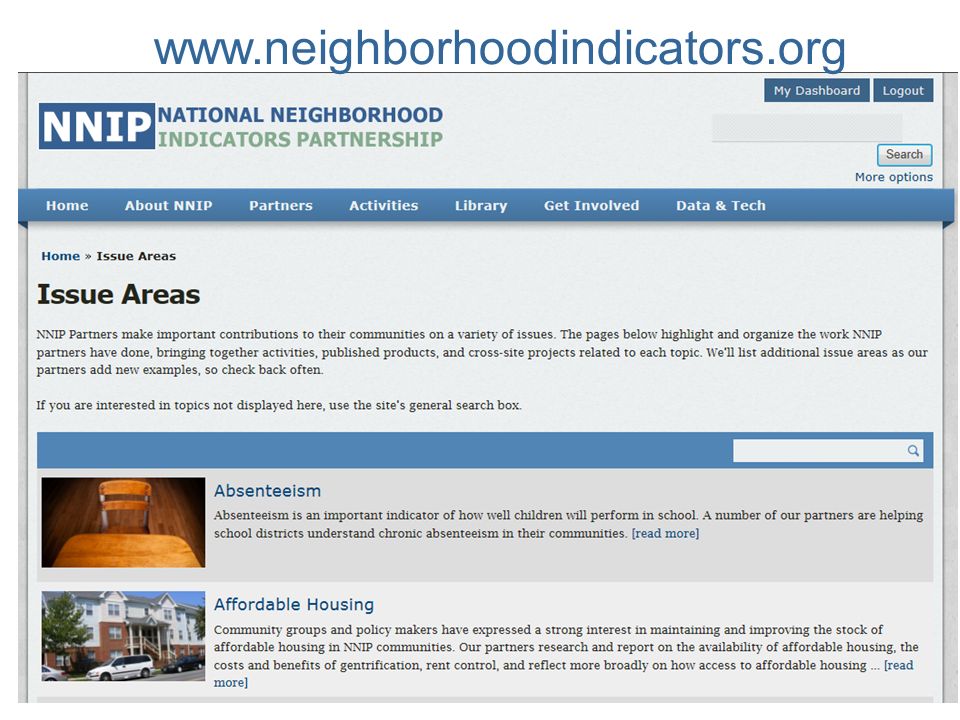
NNIP Web Site

9
www.neighborhoodindicators.org
10
10 NNIP SHARED INDICATORS The Shared Indicators agenda Completed framework paper, indicator selection Have national data now; plan assemble local data over next few years Partners now working on system/protocols for collection Neighborhood needs are urgent Devastating effects - foreclosure crisis, great recession Metro conditions vary widely

11
11 THIS ANALYSIS (100 largest metros) 2000 Census to 2005/09 ACS Imperfections: period and sample size Concentrated poverty Low income neigh. defined as >20% poverty Conditions low-income neighborhoods Taking into account composition change Regional equity (disparity gaps) Between low- and higher-income neighborhoods
 Between low- and higher-income neighborhoods.")
12
12 Concentrated Poverty Went Up Tracts Poor Population 21 24 47 48

13
13 Huge variation across metros – level and change in concentrated poverty

14
14 But composition changed – some tracts improved, some worsened

15
15 In Cleveland, city tracts more likely to improve, suburban tracts more likely to worsen

16
16 Similar Pattern in Baltimore

17
17 Large disparities (gaps): low- vs. higher- income neighborhoods
: low- vs. higher- income neighborhoods")
18
18 Small changes to gaps, 2000-2005/09 Some narrowed, some widened Ave Income ($000) % LF Employed % Homeowners% Access to Car % College Degree
 % LF Employed % Homeowners% Access to Car % College Degree")
19
19 Regional disparity, not closely correlated with concentrated poverty

20
20 FROM DATA TO INFLUENCE Partners: analyses that make a difference Dallas – “Wholeness Index” Disparities, north vs. south Dallas Leaders commit to change, accountability (Pulitzer Prize) Boston – Metropolitan Equity Analysis Showed pattern of disparities across the metro Hard to ignore in later policy/budget decisions Building from examples across cities A more accurate, compelling, national story
 Boston – Metropolitan Equity Analysis Showed pattern of disparities across the metro Hard to ignore in later policy/budget decisions Building from examples across cities A more accurate, compelling, national story.")
21
For more information Web site:www.neighborhoodindicators.orgwww.neighborhoodindicators.org Tom Kingsley: tkingsle@urban.org, (202) 261-5585tkingsle@urban.org Kathy Pettit: kpettit@urban.org, (202) 261-5670kpettit@urban.org
 Kathy Pettit: (202)")
Similar presentations

 WEEK 7: TELECOMMUNICATIONS AND THE CITY. READ: CHAPTER.>")

 Tom Kingsley, The Urban Institute.>")


 SHARON KANDRIS AND MAIA WOLUCHEM NOVEMBER 20, 2014.>")


 Tom Kingsley The Urban Institute.>")

