Download presentation
Presentation is loading. Please wait.

2
Wi’07Bafna Proteomics via Mass Spectrometry (a bioinformatics perspective) Vineet Bafna www.cse.ucsd.edu/~vbafna
 Vineet Bafna")
3
Wi’07Bafna Nobel Citation 2002

4
Wi’07Bafna Nobel Citation, 2002

5
Wi’07Bafna Proteomics via MS Enzymatic Digestion (Trypsin) + Fractionation Q: Sufficient to identify peptides?
 + Fractionation Q: Sufficient to identify peptides")
6
Wi’07Bafna Peptide MS Instrument software usually detects peaks, and computes features (peak, area, m/z…) m/z
 m/z")
7
Wi’07Bafna Single Stage MS Mass Spectrometry

8
Wi’07Bafna MS versus Micro-array cDNA sample Protein/Peptide? sample Unlike micro-array, peptide id is not trivial at the end of the MS experiment! Identification is an important part of pre- processing

9
Wi’07Bafna MS based proteomics Identification – Identify all the proteins in the proteome, specific organelles, specific pathways, complexes… Quantitation – Is a protein differentially-expressed in certain conditions? Others – Protein 3D structure, protein protein interactions,… We will consider an informatics-centered perspective

10
Wi’07Bafna Protein Identification The preferred mode is through tandem mass spectrometry of peptides. Is identifying peptides sufficient? Rough probability for co-occurrence of a 15-aa peptide? With higher accuracy instruments, it may be possible to do intact proteins as well.

11
Wi’07Bafna Tandem MS of peptides Secondary Fragmentation Ionized parent peptide

12
Wi’07Bafna The peptide backbone H...-HN-CH-CO-NH-CH-CO-NH-CH-CO-…OH R i-1 RiRi R i+1 AA residue i-1 AA residue i AA residue i+1 N-terminus C-terminus The peptide backbone breaks to form fragments with characteristic masses.

13
Wi’07Bafna Ionization The peptide backbone breaks to form fragments with characteristic masses. Ionized parent peptide H...-HN-CH-CO-NH-CH-CO-NH-CH-CO-…OH R i-1 RiRi R i+1 AA residue i-1 AA residue i AA residue i+1 N-terminus C-terminus H+H+

14
Wi’07Bafna Fragment ion generation H...-HN-CH-CO NH-CH-CO-NH-CH-CO-…OH R i-1 RiRi R i+1 AA residue i-1 AA residue i AA residue i+1 N-terminus C-terminus The peptide backbone breaks to form fragments with characteristic masses. Ionized peptide fragment H+H+

15
Wi’07Bafna Tandem MS for Peptide ID 147 K 1166 L 260 1020 E 389 907 D 504 778 E 633 663 E 762 534 L 875 405 F 1022 292 G 1080 145 S 1166 88 y ions b ions 100 0 2505007501000 [M+2H] 2+ m/z % Intensity
![Wi’07Bafna Tandem MS for Peptide ID 147 K 1166 L E D E E L F G S y ions b ions [M+2H] 2+ m/z % Intensity](http://images.slideplayer.com/25/7685979/slides/slide_15.jpg "Wi’07Bafna Tandem MS for Peptide ID 147 K 1166 L E D E E L F G S y ions b ions [M+2H] 2+ m/z % Intensity")
16
Wi’07Bafna Peak Assignment 147 K 1166 L 260 1020 E 389 907 D 504 778 E 633 663 E 762 534 L 875 405 F 1022 292 G 1080 145 S 1166 88 y ions b ions 100 0 2505007501000 y2y2 y3y3 y4y4 y5y5 y6y6 y7y7 b3b3 b4b4 b5b5 b8b8 b9b9 [M+2H] 2+ b6b6 b7b7 y9y9 y8y8 m/z % Intensity Peak assignment implies Sequence (Residue tag) Reconstruction!
![Wi’07Bafna Peak Assignment 147 K 1166 L E D E E L F G S y ions b ions y2y2 y3y3 y4y4 y5y5 y6y6 y7y7 b3b3 b4b4 b5b5 b8b8 b9b9 [M+2H] 2+ b6b6 b7b7 y9y9 y8y8 m/z % Intensity Peak assignment implies Sequence (Residue tag) Reconstruction!](http://images.slideplayer.com/25/7685979/slides/slide_16.jpg "Wi’07Bafna Peak Assignment 147 K 1166 L E D E E L F G S y ions b ions y2y2 y3y3 y4y4 y5y5 y6y6 y7y7 b3b3 b4b4 b5b5 b8b8 b9b9 [M+2H] 2+ b6b6 b7b7 y9y9 y8y8 m/z % Intensity Peak assignment implies Sequence (Residue tag) Reconstruction!")
17
Wi’07Bafna Ion types, and offsets P = prefix residue mass S = Suffix residue mass b-ions = P+1 – (NH2-CHR-CO-..-NH-CHR-CO(+)) y-ions = S+19 – (NH3(+)-CHR-CO-..NH-CHR-COOH) a-ions = P-27, and so on.. H...-HN-CH-CO-NH-CH-CO-NH-CH-CO-…OH R i-1 RiRi R i+1 AA residue i-1 AA residue i AA residue i+1 N-terminus C-terminus H+H+

18
Wi’07Bafna MS Quiz: Why aren’t all tandem MS peaks of the same intensity? Do the intensities for a peptide vary from spectrum to spectrum?

19
Wi’07Bafna Database Searching for peptide ID For every peptide from a database – Reject if it has the wrong mass, else: – Generate a hypothetical spectrum – Compute a correlation between observed and experimental spectra – Choose the best Database searching is very powerful and is the de facto standard for MS. – Sequest, Mascot, Inspect, and many others …SARLSQETFSDLWKLLPENNVLSPLP….

20
Wi’07Bafna So what’s new? The Id picture is very simplistic. Only 20-30% of spectra are conclusively identified. Many reasons: – Spectra are noisy. – Databases are incomplete. Sometimes, we need to do a de novo interpretation – Post-translational modifications. – Instrument performance is critical. The algorithms for identification must be sensitive to these issues. We present a systematic look at identification software.

21
Wi’07Bafna Modules for Peptide Id Interpretation (D) Input Spectrum Output: all that can be extracted from the spectrum (peptides/tags/parent mass/charge) Indexing/Filtering Input: Db (set of peptides) Output: pre-processing of the database, peptide subset. Scoring Input; peptide set, spectrum Output: ranked list of scores Validation Significance of the top hit. I/F SVD Db

22
Wi’07Bafna De novo interpretation of mass spectra The so called de novo algorithms focus exclusively on the D module. There is no database (I/F). Limited scoring and validation Important when no database exists! – Also important for db search I/F SVD
. Limited scoring and validation Important when no database exists. – Also important for db search I/F SVD.")
23
Wi’07Bafna De Novo Interpretation: Example S G E K 0 88 145 274 402 b-ions 420 333 276 147 0 y-ions b y y 2 100500400300200 M/Z b 1 1 2

24
Wi’07Bafna The simplest case Suppose only (and all) the prefix ions were visible. Would identification be easy? We have two problems: – There is a mix of b and y ions. Separating them is critical! – Other ions besides b,y, including neutral losses, noise and so on. We need to account for them. S G E K 0 88 145 274 402 b-ions 420 333 276 147 0 y-ions 88 145 402 274 S G E K

25
Wi’07Bafna Separating b-, and y-ions is solved using a combinatorial formulation (forbidden pairs) Separating b,y from all others is solved using a statistical approach. Together, they form the basis for a de novo sequencer.

26
Wi’07Bafna De Novo Interpretation: Example S G E K 0 88 145 274 402 b-ions 420 333 276 147 0 y-ions b y y 2 100500400300200 M/Z b 1 1 2 Ion Offsets b=P+1 y=S+19=M-P+19

27
Wi’07Bafna Computing possible prefixes We know the parent mass M=401. Consider a mass value 88 Assume that it is a b-ion, or a y-ion If b-ion, it corresponds to a prefix of the peptide with residue mass 88-1 = 87. If y-ion, y=M-P+19. – Therefore the prefix has mass P=M-y+19= 401-88+19=332 Compute all possible Prefix Residue Masses (PRM) for all ions.
 for all ions..")
28
Wi’07Bafna Putative Prefix Masses Prefix Mass M=401 by 8887332 145144275 147146273 276275144 S G E K 0 87 144 273 401 Only a subset of the prefix masses are correct. The correct mass values form a ladder of amino-acid residues

29
Wi’07Bafna Spectral Graph Each prefix residue mass (PRM) corresponds to a node. Two nodes are connected by an edge if the mass difference is a residue mass. 87 144 G

30
Wi’07Bafna Spectral Graph Each peak, when assigned to a prefix/suffix ion type generates a unique prefix residue mass. Spectral graph: – Each node u defines a putative prefix residue M(u). – (u,v) in E if M(v)-M(u) is the residue mass of an a.a. (tag) or 0. – Paths in the spectral graph correspond to a interpretation 300100 401 200 0 S G E K 273 87146144275 332
. – (u,v) in E if M(v)-M(u) is the residue mass of an a.a. (tag) or 0. – Paths in the spectral graph correspond to a interpretation S G E K")
31
Wi’07Bafna Re-defining de novo interpretation Find a subset of nodes in spectral graph s.t. – 0, M are included – Each peak contributes at most one node (interpretation)(*) – Each adjacent pair (when sorted by mass) is connected by an edge (valid residue mass) – An appropriate objective function (ex: the number of peaks interpreted) is maximized 300100 401 200 0 S G E K 273 87146144275 332 87 144 G
(*) – Each adjacent pair (when sorted by mass) is connected by an edge (valid residue mass) – An appropriate objective function (ex: the number of peaks interpreted) is maximized S G E K G.")
32
Wi’07Bafna Two problems Too many nodes. – A. Only a small fraction correspond to b/y ions (leading to true PRMs). – B. Even if the b/y ions were correctly predicted, each peak generates multiple possibilities, only one of which is correct. We need to find a path that uses each peak only once (algorithmic problem). – In general, the forbidden pairs problem is NP-hard 300100 401 200 0 S G E K 273 87146144275 332
. – B. Even if the b/y ions were correctly predicted, each peak generates multiple possibilities, only one of which is correct. We need to find a path that uses each peak only once (algorithmic problem). – In general, the forbidden pairs problem is NP-hard S G E K")
33
Wi’07Bafna However,.. The b,y ions have a special non-interleaving property Consider pairs (b 1,y 1 ), (b 2,y 2 ) – Note that b 1 +y 1 = b 2 +y 2 – If (b 1 y 2
, (b 2,y 2 ) – Note that b 1 +y 1 = b 2 +y 2 – If (b 1 y 2.")
34
Wi’07Bafna Non-Intersecting Forbidden pairs 300 100 400 200 0 S G E K If we consider only b,y ions, ‘forbidden’ node pairs are non-intersecting, The de novo problem can be solved efficiently using a dynamic programming technique. 87 332
35
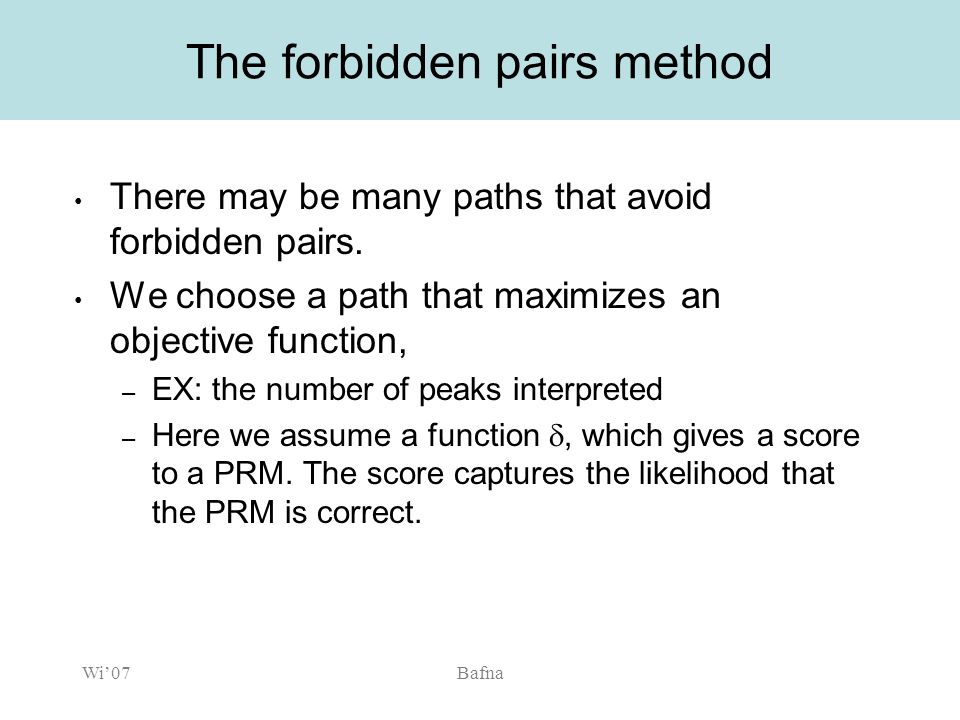
Wi’07Bafna The forbidden pairs method There may be many paths that avoid forbidden pairs. We choose a path that maximizes an objective function, – EX: the number of peaks interpreted – Here we assume a function , which gives a score to a PRM. The score captures the likelihood that the PRM is correct.

36
Wi’07Bafna The forbidden pairs method Sort the PRMs according to increasing mass values. For each node u, f(u) represents the forbidden pair Let m(u) denote the mass value of the PRM. 300100 400 200 0 87 332 u f(u)
 represents the forbidden pair Let m(u) denote the mass value of the PRM u f(u).")
37
Wi’07Bafna D.P. for forbidden pairs Consider all pairs u,v – m[u] M/2 Define S(u,v) as the best score of a forbidden pair path from 0->u, v- >M Is it sufficient to compute S(u,v) for all u,v? 300100 400 200 0 87 332 uv
 as the best score of a forbidden pair path from 0->u, v- >M Is it sufficient to compute S(u,v) for all u,v uv.")
38
Wi’07Bafna D.P. for forbidden pairs Note that the best interpretation is given by 300100 400 200 0 87 332 uv

39
Wi’07Bafna D.P. for forbidden pairs Denote the forbidden pair of node v by f(v). – What is f(f(v))? Note that we have one of two cases. 1. Either u v) 2. Or, u > f(v) (and f(u) < v) Case 1. – Extend v, do not touch f(u) 300100 400 200 0 u f(u) vw
). Note that we have one of two cases. 1. Either u v) 2. Or, u > f(v) (and f(u) < v) Case 1. – Extend v, do not touch f(u) u f(u) vw.")
40
Wi’07Bafna The complete algorithm for all u /* increasing mass values from 0 to M/2 */ for all v /* decreasing mass values from M to M/2 */ if (u > f[v]) else if (u < f[v]) If (u,v) E /* maxI is the score of the best interpretation */ maxI = max {maxI,S[u,v]}
![Wi’07Bafna The complete algorithm for all u /* increasing mass values from 0 to M/2 */ for all v /* decreasing mass values from M to M/2 */ if (u > f[v]) else if (u < f[v]) If (u,v) E /* maxI is the score of the best interpretation */ maxI = max {maxI,S[u,v]}](http://images.slideplayer.com/25/7685979/slides/slide_40.jpg "Wi’07Bafna The complete algorithm for all u /* increasing mass values from 0 to M/2 */ for all v /* decreasing mass values from M to M/2 */ if (u > f[v]) else if (u < f[v]) If (u,v) E /* maxI is the score of the best interpretation */ maxI = max {maxI,S[u,v]}")
41
Wi’07Bafna De Novo: Second issue Given only b,y ions, a forbidden pairs path will solve the problem. However, recall that there are MANY other ion types. – Typical length of peptide: 15 – Typical # peaks? 50-150? – #b/y ions? – Most ions are “Other” a ions, neutral losses, isotopic peaks….

42
Wi’07Bafna De novo: Weighting nodes in Spectrum Graph Factors determining if the ion is b or y – Intensity – Support ions b- and y-ions are the most likely ions to lose water/ammonia – Isotopic peaks

43
Wi’07Bafna Offset frequency function b, and y-ions show offsets due to neutral losses

44
Wi’07Bafna De novo: Weighting nodes A probabilistic network to model support ions (Pepnovo)
")
45
Wi’07Bafna De Novo Interpretation Summary The main challenge is to separate b/y ions from everything else (weighting nodes), and separating the prefix ions from the suffix ions (Forbidden Pairs). As always, the abstract idea must be supplemented with many details. – Noise peaks, incomplete fragmentation – A PRM is first scored on its likelihood of being correct, and the forbidden pair method is applied subsequently.

46
Wi’07Bafna Db search versus de novo interpretation FilterValidationScore De novo Db 55M peptides 1.Traditional db search simply have the scoring module. 2.De novo is useful when the peptide is not in the database, but not as accurate. 3.It can be thought of as a database search over a much larger database. 4.PT modifications change the picture.

47
Wi’07Bafna Filtering FilterValidationScoreextension De novo Db 55M peptides Candidate Peptides (700) 1.Db indexing/filtering is a key mechanism for reducing the search space
 1.Db indexing/filtering is a key mechanism for reducing the search space")
48
Wi’07Bafna Filtering Define a filter as a computational tool that rapidly screens a database, removing much of it but retaining the true peptide. Can you suggest commonly used filters? 1. Parent mass 2. Trypsin digested peptides

49
Wi’07Bafna Parent Mass filter Sort all peptides in the database by their parent mass. Search only the peptides that are within some mass tolerance. The filter does not work when you have modifications.

50
Wi’07Bafna The dynamic nature of the proteome The proteome of the cell is changing Various extra-cellular, and other signals activate pathways of proteins. A key mechanism of protein activation is PT modification These pathways may lead to other genes being switched on or off Mass Spectrometry is key to probing the proteome

51
Wi’07Bafna Db search for putatively modified peptides. Ex:YFDSTDYNMAK 2 5 =32 possibilities, with 2 types of modifications! In contrast, de novo search space does not change significantly. Phosphorylation? oxidation For each peptide, generate all mods. Score each modification Is parent mass still a good filter?

52
Wi’07Bafna Enzymatic digestion rules as a filter Consider only tryptic peptides – Trypsin cleaves after R,K (not if RP, or KP) Tryptic peptide filters may not be very effective – Missed cleavage – End-point degradation – Endogenous peptide activity
 Tryptic peptide filters may not be very effective – Missed cleavage – End-point degradation – Endogenous peptide activity")
53
Wi’07Bafna Example of non-tryptic peptide analysis Experiment: a massive oversampling of a proteome (14M spectra of a prokaryotic genome) Plot the absolute postion of the most N-terminal peptide (not-necessarily tryptic) (Gupta et al., 2007) Two peaks are seen, at position 2, and position ~22
 Plot the absolute postion of the most N-terminal peptide (not-necessarily tryptic) (Gupta et al., 2007) Two peaks are seen, at position 2, and position ~22")
54
Wi’07Bafna Signal Peptide discovery

55
Wi’07Bafna PT modifications/processing The problem was not intractable, but impractical. Identifications of modified peptides was not routine, and is left to specialized cases. Better filtering technology makes it practical to explore modifications on a large scale. Increase in time is modest with increasing number of modifications. The technology can only improve. Should be possible to improve speed by another order of magnitude.

56
Wi’07Bafna We will filter databases via a trick from sequence searching

57
Wi’07Bafna Sequence Search Basics Q: Given k words (s i has length l i ), and a database of size n, find all matches to these words in the database string. How fast can this be done? 1:POTATO 2:POTASSIUM 3:TASTE P O T A S T P O T A T O dictionary database

58
Wi’07Bafna Dict. Matching & string matching How fast can you do it, if you only had one word of length m? – Trivial algorithm O(nm) time – Pre-processing O(m), Search O(n) time. Dictionary matching – Trivial algorithm (l 1 +l 2 +l 3 …)n – Using a keyword tree, l p n (l p is the length of the longest pattern) – Aho-Corasick: O(n) after preprocessing O(l 1 +l 2..) We will consider the most general case
 time – Pre-processing O(m), Search O(n) time. Dictionary matching – Trivial algorithm (l 1 +l 2 +l 3 …)n – Using a keyword tree, l p n (l p is the length of the longest pattern) – Aho-Corasick: O(n) after preprocessing O(l 1 +l 2..) We will consider the most general case.")
59
Wi’07Bafna Sequence tag filters Basics 1. De novo sequencing can be used to get partial sequence information from the spectra. 2. Exact matching for sequence is fast. 3. We can search a database (size n) with k substrings (of any length) in time that is proportional to n, but independent of the size or number of substrings. Aho-Corasick trie data-structure.
 with k substrings (of any length) in time that is proportional to n, but independent of the size or number of substrings. Aho-Corasick trie data-structure..")
60
Wi’07Bafna Dictionary matching YAK S N N F F AT YFAK YFNS FNTA …..Y F R A Y F N T A….. In each step, either f, or l is incremented. Total time is 2n, independent of automaton size. f l

61
Wi’07Bafna Tag-based filtering A tag is a short peptide with a prefix and suffix mass Efficient: An average tripeptide tag matches Swiss-Prot ~700 times Tagging is related to de novo sequencing yet different. Objective: Compute a subset of short strings, at least one of which must be correct. Longer tags=> better filter. Analogy: Using tags to search the proteome is similar to moving from full Smith-Waterman alignment to BLAST

62
Wi’07Bafna Tag generation W R A C V G E K D W L P T L T TAG Prefix Mass AVG 0.0 WTD 120.2 PET 211.4 Using local paths in the spectrum graph, construct peptide tags. Use the top ten tags to filter the database Tagging is related to de novo sequencing yet different. Objective: Compute a subset of short strings, at least one of which must be correct. Longer tags=> better filter.

63
Wi’07Bafna Tag-based search Tags (from multiple spectra) are used to construct a trie For each string match, attempt to extend, matching the prefix and suffix mass using flanking sequence (and PTMs) Retain best matches for detailed scoring
 are used to construct a trie For each string match, attempt to extend, matching the prefix and suffix mass using flanking sequence (and PTMs) Retain best matches for detailed scoring")
64
Wi’07Bafna Tag based search (dictionary matching) YFD DST STD TDY YNM Y M FD N Y M FD N …..YFDSTGSGIFDESTMTKTYFDSTDYNMAK…. De novo trie scan

65
Wi’07Bafna Speed & Sensitivity FilteredPeptides: # peptides that pass the filter Time: Scan time + filteredpeptides * Scoring-time For sequence tag filters, the scan time can be amortized out, by combining scan for many spectra all at once. – Build one automaton from multiple spectra Thus, filter efficiency is key to speed. Filter sensitivity is also important

66
Wi’07Bafna Given: – tag with prefix and suffix masses xyz – match in the database Compute if a suffix and prefix match with allowable modifications. How fast can this be done? Compute a candidate peptide with most likely attachment point. Fast Extension xyz

67
Wi’07Bafna Filtering Database filtering is a critical (and relatively unexplored) strategy for MS searches. De novo sequencing to get tags is an effective strategy Are other forms of filtering possible? – Alg. Question: given a spectrum, find all peptides that match a subset of theoretical fragments. How quickly can you do that?

68
Wi’07Bafna Overview FilterSignificanceScoreextension De novo Db 55M peptides Candidate Peptides (700)
")
69
Wi’07Bafna Scoring Input: – Candidate peptide with attached modifications – Spectrum Output: – Score function: – Key: the score must normalize for length, as variable modifications can change peptide length.

70
Wi’07Bafna Score function Score is a log-odds function. Numerator: Prob. That the spectrum was generated by n theoretical fragments from the peptide. Denominator: Probability that the spectrum was generated by n randomly generated peaks

71
Wi’07Bafna Probabilistic Scoring Empirically computed Depends upon tolerance Theoretical fragments Peaks i-th peak j-th frag.

72
Wi’07Bafna Overview FilterValidationScoreextension De novo Db 55M peptides Candidate Peptides (700)
")
73
Wi’07Bafna P-value computation The score function allows us to rank peptides. The top scoring one may not be the correct one. We consider a collection of +ve (top scoring correct one), and -ve spectra. Consider a bunch of other scores that help separate the +ve from the -ve.
, and -ve spectra. Consider a bunch of other scores that help separate the +ve from the -ve..")
74
Wi’07Bafna Quality scores and p-values Features: Score S: as computed Explained Intensity I: fraction of total intensity explained by annotated peaks. Explained peaks: fraction of top 25 peaks annotated. b-y score B: fraction of b+y ions annotated -score : difference between the best and second best Choose a final score as a (linear) combination of the features. The weights can be trained using a discriminative strategy.
 combination of the features. The weights can be trained using a discriminative strategy..")
75
Wi’07Bafna Separating power of features

76
Wi’07Bafna Computing confidence values Discriminative training of feature weights is used to maximize the separation. The distribution of -ve example scores can supply a confidence value.

77
Wi’07Bafna Common ID Tools Sequest – De Novo + Filtering: Parent Mass, Enzyme specificity – Scoring: Simple cross-correlation of theoretical and experimental peaks – Validation: Xcorr (based on difference between best and second best) Mascot: Similar MS-BLAST – Uses 3rd party de novo prediction – Filtering using Blast code – Limited scoring – Validation at the protein level
 Mascot: Similar MS-BLAST – Uses 3rd party de novo prediction – Filtering using Blast code – Limited scoring – Validation at the protein level")
78
Wi’07Bafna Identification summary While MS technologies are important for proteomics in general, they are the key technology for identification. They can probe the proteome dynamically, and help identify mutations and modifications. The algorithms are continually improved by improved versions of one or more modules.

79
Wi’07Bafna Modifications While we discussed modification in general, identification and validation of modifications remains an important theme. Larger modifications are interesting in themselves (such that glycan chains in glycosylation), and might be identified using MS ABRF delta mass resource
, and might be identified using MS ABRF delta mass resource.")
80
Wi’07Bafna Isotopic Profiles

81
Wi’07Bafna Mass Measurement? VAPEEHPVLLTEAPLNPK (Mol. Mass=1953)
")
82
Wi’07Bafna Mass-Charge ratio The charge is due to a proton (H+) which has a mass of ~1 Da The X-axis is (M+Z)/Z – Z=1 implies that peak is at M+1 – Z=2 implies that peak is at (M+2)/2 M=1000, Z=2, peak position is at 501 – Suppose you see a peak at 501. Is the mass 500, or is it 1000?

83
Wi’07Bafna Isotopic peaks Ex: Consider peptide SAM Mass = 308.12802 You should see: Instead, you see 308.13 310.13

84
Wi’07Bafna Isotopes C-12 is the most common. Suppose C-13 occurs with probability 1% EX: SAM – Composition: C11 H22 N3 O5 S1 What is the probability that you will see a single C-13? 308309 MS spectrum for SAM

85
Wi’07Bafna All atoms have isotopes Isotopes of atoms – O16,18, C-12,13, S32,34…. – Each isotope has a frequency of occurrence If a molecule (peptide) has a single copy of C-13, that will shift its peak by 1 Da With multiple copies of a peptide, we have a distribution of intensities over a range of masses (Isotopic profile). How can you compute the isotopic profile of a peak?
 has a single copy of C-13, that will shift its peak by 1 Da With multiple copies of a peptide, we have a distribution of intensities over a range of masses (Isotopic profile). How can you compute the isotopic profile of a peak .")
86
Wi’07Bafna Isotope Calculation Denote: – N c : number of carbon atoms in the peptide – P c : probability of occurrence of C-13 (~1%) – Then +1 N c =50 +1 N c =200
 – Then +1 N c =50 +1 N c =200")
87
Wi’07Bafna Isotope Calculation Example Suppose we consider Nitrogen, and Carbon N N : number of Nitrogen atoms P N : probability of occurrence of N-15 Pr(peak at M) Pr(peak at M+1)? Pr(peak at M+2)? How do we generalize? How can we handle Oxygen (O-16,18)?
. How do we generalize. How can we handle Oxygen (O-16,18) .")
88
Wi’07Bafna General isotope computation Definition: – Let p i,a be the abundance of the isotope with mass i Da above the least mass – Ex: P 0,C : abundance of C-12, P 2,O : O-18 etc. Characteristic polynomial Prob{M+i}: coefficient of x i in (x) (a binomial convolution)
 (a binomial convolution).")
89
Wi’07Bafna Quiz How can you determine the charge on a peptide? Difference between the first and second isotope peak is 1/Z Proposal: Given a mass, predict a composition, and the isotopic profile Do a ‘goodness of fit’ test to isolate the peaks corresponding to the isotope Compute the difference

90
Wi’07Bafna Isotopic Profile Application In DxMS, hydrogen atoms are exchanged with deuterium The rate of exchange indicates how buried the peptide is (in folded state) Consider the observed characteristic polynomial of the isotope profile t1, t2, at various time points. Then The estimates of p 1,H can be obtained by a deconvolution Such estimates at various time points should give the rate of incorporation of Deuterium, and therefore, the accessibility.

91
Wi’07Bafna Quantitation via MS

92
Wi’07Bafna Quantitation The intensity of the peak depends upon – Abundance, ionization potential, substrate etc. Two peptides with the same abundance can have very different intensities. Assumption: relative abundance can be measured by comparing the ratio of a peptide in 2 samples.

93
Wi’07Bafna Quantitation issues The two samples might be from a complex mixture. How do we identify identical peptides in two samples? In micro-array this is possible because the cDNA is spotted in a precise location? Can we have a ‘location’ for proteins/peptides MS based quantitation must be coupled with quantitation

94
Wi’07Bafna 2D Gel based separation Intact proteins are used Iso-electric focusing and Mol Weight used to separate. Intensity of spot is used to measure abundance. Problems: All 3 measurements are not that precise (low reproducibility) Labor intensive Many proteins do not get separated.
 Labor intensive Many proteins do not get separated..")
95
Wi’07Bafna LC-MS based separation As the peptides elute (separated by physiochemical properties), spectra is acquired. HPLC ESI TOF Spectrum (scan) p1 p2 pn p4 p3
 p1 p2 pn p4 p3.")
96
Wi’07Bafna LC-MS Maps time m/z I Peptide 2 Peptide 1 x x x x x x x x x x x x x x time m/z Peptide 2 elution A peptide/feature can be labeled with the triple (M,T,I): – monoisotopic M/Z, centroid retention time, and intensity An LC-MS map is a collection of features
: – monoisotopic M/Z, centroid retention time, and intensity An LC-MS map is a collection of features")
97
Wi’07Bafna Peptide Features Isotope pattern Elution profile Peptide (feature) Capture ALL peaks belonging to a peptide for quantification !
 Capture ALL peaks belonging to a peptide for quantification !")
98
Wi’07Bafna Relative abundance using MS Differential Isotope labeling (ICAT/SILAC) External standards (AQUA) Direct Map comparison
 External standards (AQUA) Direct Map comparison")
99
Wi’07Bafna ICAT Introduced by Aebersold ICAT reagent is attached to particular amino-acids (Cys) Affinity purification leads to simplification of complex mixture “diseased” Cell state 1 Cell state 2 “Normal” Label proteins with heavy ICAT Label proteins with light ICAT Combine Fractionate protein prep - membrane - cytosolic Proteolysis Isolate ICAT- labeled peptides Nat. Biotechnol. 17: 994-999,1999

100
Wi’07Bafna Differential analysis using ICAT ICAT pairs at known distance diseased normal

101
Wi’07Bafna ICAT issues The tag is heavy, and decreases the dynamic range of the measurements. The tag might break off Only Cysteine containing peptides are retrieved Non-specific binding to strepdavidin

102
Wi’07Bafna Serum ICAT data

103
Wi’07Bafna Serum ICAT data 8 0 22 24 30 32 38 40 46 16 Instead of pairs, we see entire clusters at 0, +8,+16,+22 What is going on?

104
Wi’07Bafna SILAC A different isotope labeling strategy Mammalian cells do not ‘manufacture’ all amino- acids. Where do they come from? Labeled amino-acids are added to amino-acid deficient culture, and are incorporated into all proteins as they are synthesized No chemical labeling or affinity purification is performed. Leucine can be used (10% abundance vs 2% for Cys)
.")
105
Wi’07Bafna SILAC vs ICAT Leucine is higher abundance than Cys No affinity tagging done Fragmentation patterns for the two peptides are identical – Identification is easier Ong et al. MCP, 2002

106
Wi’07Bafna Incorporation of Leu-d3 at various time points Doubling time of the cells is 24 hrs. Peptide = VAPEEHPVLLTEAPLNPK What is the charge on the peptide?

107
Wi’07Bafna Quantitation on controlled mixtures

108
Wi’07Bafna Identification MS/MS of differentially labeled peptides

109
Wi’07Bafna Questions The quantitation of peptides also depends upon the amount mixed right in the beginning (what if you mixed more of one sample?) How can you control for such errors? What happens when you see singletons (unpaired features)? – In ICAT, it can be a non-Cys peptide (chemical noise), OR – Under-expressed Cys-peptide – How can you differentiate between the two cases?
. – In ICAT, it can be a non-Cys peptide (chemical noise), OR – Under-expressed Cys-peptide – How can you differentiate between the two cases .")
110
Wi’07Bafna Map comparison The retention time and M/Z are a signature for the peptide. Can we use this signature to compare the intensity of the same peptide in two samples? T M/Z

111
Wi’07Bafna Map 1 (normal) Map 2 (diseased) Map Comparison for Quantification
 Map 2 (diseased) Map Comparison for Quantification")
112
Wi’07Bafna Data reduction (feature detection) Features Each feature is represented by – Monoisotopic M/Z, centroid retention time, aggregate intensity
 Features Each feature is represented by – Monoisotopic M/Z, centroid retention time, aggregate intensity")
113
Wi’07Bafna Comparison of features across maps Hard to reduce features to single spots Matching paired features is critical M/Z is accurate, but time is not. A time scaling might be necessary

114
Wi’07Bafna Time scaling: Alignment Each time scan is a vector of intensities. Two scans in different runs can be scored for similarity (using a dot product) Compute an alignment to match scans against each other. Advantage: does not rely on feature detection. Disadvantage: Might not handle affine shifts in time scaling, but is better for local shifts
 Compute an alignment to match scans against each other. Advantage: does not rely on feature detection. Disadvantage: Might not handle affine shifts in time scaling, but is better for local shifts.")
115
Wi’07Bafna Spectral comparison The dot product is the standard technique for comparing two spectra Bin the peaks by partitioning the masses. Each mass bin gets an aggregate intensity corresponding to the peaks that fall in it. The normalized dot-product of the resulting vectors measures the similarity partitions Vector v 1 v1v1 v2v2

116
Wi’07Bafna Basic geometry What is ||x|| 2 ? What is x/||x|| Dot product x=(x 1,x 2 ) y
 y")
117
Wi’07Bafna Matching runs Compute a matching of the vectors with the best score. What should the indel penalties be like? v1v1 w1w1 v2v2 vjvj wiwi w i T v j

118
Wi’07Bafna Time scaling: Approach 2 (geometric matching) Match features based on M/Z, and (loose) time matching. Objective f (t 1 -t 2 ) 2 Let t 2 ’ = a t 2 + b. Select a,b so as to minimize f (t 1 -t’ 2 ) 2
 2 Let t 2 ’ = a t 2 + b. Select a,b so as to minimize f (t 1 -t’ 2 ) 2.")
119
Wi’07Bafna Geometric Matching Pair up everything with identical m/z – Very loose constraints on time. Give every pair a cost equal to the time difference Iterate over all (a,b), to find one that mimimizes the minimum cost matching.
, to find one that mimimizes the minimum cost matching..")
120
Wi’07Bafna Comparing the different approaches Time scaling via Geometric matching depends critically upon reliable feature identification. Time scaling via spectral comparison depends upon coordinated elution of peptide features

121
Wi’07Bafna Quantitation Summary Once we have features matched across runs, we have data identical to microarrays. Features can be ‘identified’ in separate MS2 experiments Feature detection, LC-MS mapping/ICAT decouple the identification from the quantitation The difficulty of producing such data makes it a challenging problem for bioinformatics run feature intensity (Identification via MS2)
.")
122
Wi’07Bafna Other applications of MS

123
Wi’07Bafna MS application: Protein-protein interaction Proteins combine to form functional complexes. An antibody is a special kind of protein that can recognize a specific protein Use an antibody to recognize a protein in a complex. Isolate & Purify the complex that binds to the antibody. Identify all the proteins in the complex via mass spectrometry.

124
Wi’07Bafna MS application:Protein Structure Use chemical cross-linkers to link spatially proximal residues. Denature and digest the protein. Identify the cross-linked peptides. This provides extra structural constraints which help predict structure.

125
Wi’07Bafna Cross-linking Cross-links are ‘fixed’ length polymers that bind to amino- acids. How can they help predict structure? Protocol – Cross-link native protein – Denature, digest – MS/MS (identify cross- linked peptides) Potentially valuable, but not widely used
 Potentially valuable, but not widely used.")
126
Wi’07Bafna Identifying Cross-linked peptides Identify all peptide pairs, whose mass explains the parent mass. Given a list of peptide pairs, find the pair, and the linked position that best explains the MS2 data. What is the number of possible candidate pairs. Fragmentation in the presence of linkers is poorly understood How do you separate cross- linked peptides from singly linked, and non-cross-linked peptides?

127
Wi’07Bafna Overlap peptides and shotgun based identification

128
Wi’07Bafna Motivation Database search of MS/MS spectra works well whenever the protein sequence is known and the protein is not modified/mutated BUT: – Not all protein sequences are available Examples include proteins from snake and scorpion venom Integrilin, a successful blood clot prevention drug distributed by Millenium, was derived from rattlesnake venom Sequences are still determined by Edman sequencing – Database search is likely to fail if the analyzed protein contains unexpected post-translational modifications or mutations.

129
Wi’07Bafna Shotgun Assembly How to use the redundant information in MS/MS spectra from overlapping peptides to construct a de-novo interpretation of the protein sequence? Non-specific proteases or sets of proteases with different specificities result in very rich digestion patterns:

130
Wi’07Bafna Unanticipated modifications

131
Wi’07Bafna MS-Alignment Dynamic Programming can be used to capture mass-offsets (putative PTMs). In large data-sets, true PTMs should be over-represented. Tsur et al.’ Nat. Bio. 2005

132
Wi’07Bafna PTM Frequency Matrix 50,000 spectra from a sample of IKKb were searched in blind mode, and identifications with p- value <0.05 were retained Cell shading indicates the number of annotations with modification ( , a)
")
133
Wi’07Bafna PTM Frequency Matrix Oxidation Methylation Sodium Double oxidation Dimethylation

134
Wi’07Bafna PTM selection: Output

135
Wi’07Bafna Filtering -correct annotations M+17 (from oxidized methionine, incorrect mass) A+14 (from methylated lysine, incorrect placement)
 A+14 (from methylated lysine, incorrect placement)")
136
Wi’07Bafna Overlapping peptides

137
Wi’07Bafna Features for robust PTM identification A number of features are used to validate mass-shifts obtained from MS-alignment, including – evidence from overlapping peptides, – number of spectra. – Delta scores from other possibilities, – Evidence from multiple sites, de-novo identifications etc. – These features are used to train an SVM. Validation is done at spectrum, peptide, and site levels Final searches performed using a fixed false discovery rates on a random database.

138
Wi’07Bafna Blind Search of a lens data-set Human lenses are a rich source of modified proteins: – Lens proteins do not turnover, but accumulate modifications over time – Hundreds of papers in the last 20 years reporting crystallin modifications – Yates‘ lab pioneered use of various proteases for high-throughput PTM validation/discovery in lenses (MacCoss et al, 2003) – Sample from a 93-year old patient – Wilmarth et al. (Jnl. Prot. Res.,06)
.")
139
Wi’07Bafna Modifications on cataractous lens LocationModification Mass Putative annotation S,T-18dehydration Q-17deamidation W-2cross-linking H14methylation M,W16oxidation S,H28double methylation N-term42acetylation N-term43carbamylation K,non-terminal43carbamylation W44carboxylation R55unknown K58carboxymethylation K72carboxyethylation LocationModification mass TypePutative annotationComment M-48Chem. artifactloss of methane sulfenic acidreported on same site W4PTMkynureninereported in cataractous lenses S30/73unknown W32PTMformylkynureninereported in cataractous lenses N-term57unknowncarboxyamidomethylationIn-vivo N-term modification? N-term271unknown Table 1: Rediscovered all modifications previously identified by database search except deamidation on N/Q (+1 Da). Table 2: Identified 6 new modification events
. Table 2: Identified 6 new modification events.")
140
Wi’07Bafna Lens: Unknown modifications Unknown modification R+55 was found on both data-sets, and assigned to overlapping sets of sites. Some evidence for Q+161 (glycosylation?) in a few spectra
 in a few spectra.")
141
Wi’07Bafna Spectra for putative R+55 modification

142
Wi’07Bafna 2. Selecting modifications (summary) A ‘strength in numbers’ approach: The more spectra, the better. – A recent unpublished search with ~18M spectra reveals ~500 modified sites, with a 2% FDR Overlapping peptides are strong evidence (incorrect matches unlikely to overlap) These and other features are being used in an automated tool for identifying modified sites.
 A ‘strength in numbers’ approach: The more spectra, the better. – A recent unpublished search with ~18M spectra reveals ~500 modified sites, with a 2% FDR Overlapping peptides are strong evidence (incorrect matches unlikely to overlap) These and other features are being used in an automated tool for identifying modified sites..")
143
Wi’07Bafna Eukaryotic genes A eukaryotic gene has a complex structure. A gene may be transcribed (translated) into many alternative isoforms. A ‘typical’ exon is ~150bp. A ‘typical’ tryptic peptide is ‘15’ aa. What is the probability that a typical peptide crosses a splice junction? ATG 5’ UTR intronexon 3’ UTR Translation start
 into many alternative isoforms. A ‘typical’ exon is ~150bp. A ‘typical’ tryptic peptide is ‘15’ aa. What is the probability that a typical peptide crosses a splice junction. ATG 5’ UTR intronexon 3’ UTR Translation start.")
144
Wi’07Bafna Searching spliced-exon graph Instead of searching 6 frame translations, we search a compact representation of putative exons, and exon-pairs! Each putative exon is a node. Splicing and SNPs are represented by edges The tag based search extends efficiently to spliced-exon graphs.

145
Wi’07Bafna Genomic Search Results ~18M spectra from a kidney cell line were searched against a human splice-exon graph. Validation of 39,000 exons and 11,000 introns Novel or extended exons in 16 genes, confirm translation of 224 hypothetical proteins. Discover over 40 alternative splicing events. 308 coding SNPs. Tanner et al., Genome Research

146
Wi’07Bafna Retinoblastoma gene (novel 3’ Exon)
")
147
Wi’07Bafna EX: Novel Exons intron

148
Wi’07Bafna Validating hypothetical protein

149
Wi’07Bafna Conclusion Key technology for proteomics Leading technology for protein identification, PT modifications, and protein level quantitation Applications to protein structure, interactions, pathways and other proteomic problems

Similar presentations

 A2 is online We considered the basics of sequence alignment –Opt score.>")

 Data Kay Hofmann – Protein Evolution Group Week 5: Proteomics.>")


>")


