Download presentation
Presentation is loading. Please wait.

1
Chapter Three Climate and Vegetation

2
SEASONS How many season are there? Winter Spring Summer Fall

3
WHERE DO SEASONS COME FROM? Earth’s tilt on it’s axis at a 23.5 degree angle in relation to the sun Earth’s tilt on it’s axis at a 23.5 degree angle in relation to the sun Earth rotates once every 24 hrs Earth rotates once every 24 hrs Earth makes one revolution around the sun every 365.25 days Earth makes one revolution around the sun every 365.25 days

4
SEASONS Earth’s axis always points to the same spot in the sky Earth’s axis always points to the same spot in the sky Revolution and tilt cause the seasons Revolution and tilt cause the seasons (different parts of the earth receive direct rays from the sun for more hours at certain times of the year) (different parts of the earth receive direct rays from the sun for more hours at certain times of the year)
 (different parts of the earth receive direct rays from the sun for more hours at certain times of the year)")
5
Season Diagram

6
SEASONS Summer: days are longer and sun’s energy is stronger Summer: days are longer and sun’s energy is stronger Winter: days are shorter and sun’s energy is weaker Winter: days are shorter and sun’s energy is weaker Spring & Fall: daylight and darkness are equal length sun’s energy is evenly distributed Spring & Fall: daylight and darkness are equal length sun’s energy is evenly distributed

7
SOLSTICES The two times a year that the earth’s poles point at their greatest angle toward or away from the sun The two times a year that the earth’s poles point at their greatest angle toward or away from the sun

8
SOLSTICES Summer Solstice: June 21 st. Beginning of Summer, longest day of the year Summer Solstice: June 21 st. Beginning of Summer, longest day of the year Winter Solstice: December 21 st Beginning of Winter, shortest day of the year Winter Solstice: December 21 st Beginning of Winter, shortest day of the year

9
EQUINOX Twice a year Twice a year Days and nights are equal in length Days and nights are equal in length Sun’s rays are directly on the equator Sun’s rays are directly on the equator

10
EQUINOX Vernal (spring) equinox about March 21 signals the beginning of Spring Vernal (spring) equinox about March 21 signals the beginning of Spring Autumnal equinox about September 22 signals the beginning of autumn Autumnal equinox about September 22 signals the beginning of autumn
 equinox about March 21 signals the beginning of Spring Vernal (spring) equinox about March 21 signals the beginning of Spring Autumnal equinox about September 22 signals the beginning of autumn Autumnal equinox about September 22 signals the beginning of autumn")
11
WHAT CAUSES WEATHER? Amount of solar energy Amount of solar energy How air masses absorb and distribute the energy How air masses absorb and distribute the energy Landforms / bodies of water Landforms / bodies of water Water Vapor (determines if there will be precipitation) Water Vapor (determines if there will be precipitation) Cloud cover Cloud cover Elevation Elevation
 Water Vapor (determines if there will be precipitation) Cloud cover Cloud cover Elevation Elevation.")
12
PRECIPITATION Convectional- hot climates, hot climates, Afternoon rain Orographic- Orographic- mountain areas, more rain mountain areas, more rain on windward side and a rain shadow on leeward side rain shadow on leeward side Frontal- Frontal- mid-latitude frontal storms with cold dense air masses pushing lighter warm air masses upward; lighter warm air masses upward; thunderstorms thunderstorms

13
WEATHER EXTREMES Hurricanes Hurricanes form over warm tropical waters, takes days to develop form over warm tropical waters, takes days to develop can cover 100’s of miles can cover 100’s of miles winds from 75- 200 mph winds from 75- 200 mph

14
Tornadoes Tornadoes develop very quickly develop very quickly wind speeds up to 300 mph wind speeds up to 300 mph small diameters (about 300 ft.) small diameters (about 300 ft.) can stay on ground for hours can stay on ground for hours can cause massive damage can cause massive damage WEATHER EXTREMES
 small diameters (about 300 ft.) can stay on ground for hours can stay on ground for hours can cause massive damage can cause massive damage WEATHER EXTREMES")
15
Blizzards- heavy snowstorms; winds more than 32 mph; reduced visibility Blizzards- heavy snowstorms; winds more than 32 mph; reduced visibility Droughts- long period of time without water; leads to crop failures and water shortages Droughts- long period of time without water; leads to crop failures and water shortages Floods- when water flows over land faster than the land can absorb it Floods- when water flows over land faster than the land can absorb it

16
CLIMATE Climate reflects the seasonal patterns of weather for a location over a long period of time Climate reflects the seasonal patterns of weather for a location over a long period of time Global climatic changes may be natural or man-made Global climatic changes may be natural or man-made

17
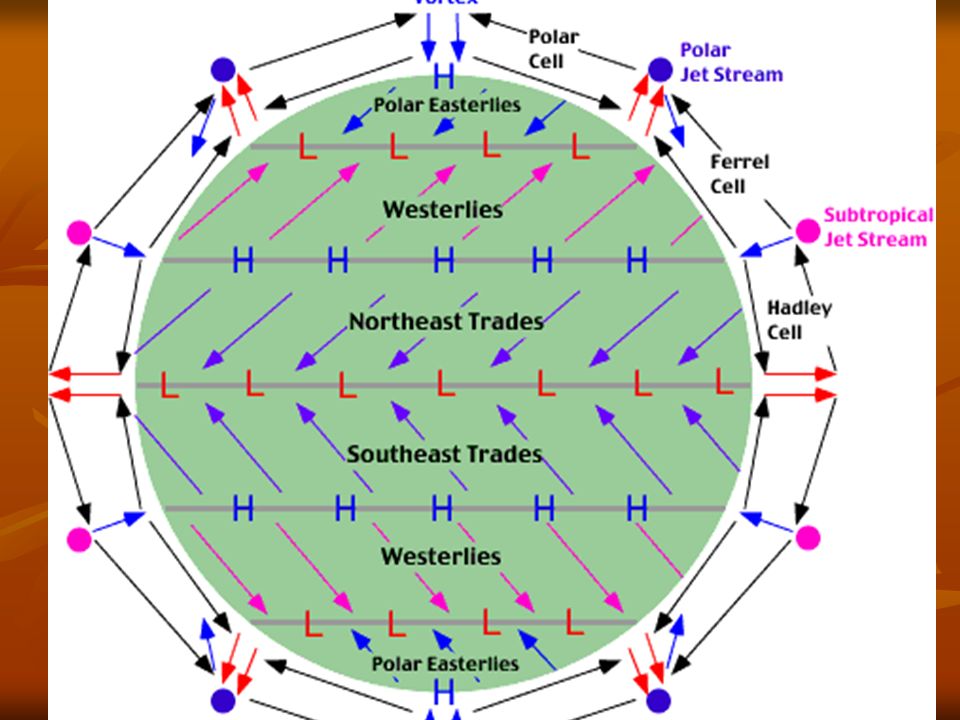
FACTORS AFFECTING CLIMATE I. Wind Currents Because of earth’s rotation the winds blow at an angle. Northern hemisphere to the right Northern hemisphere to the right Southern hemisphere to the left Southern hemisphere to the left Coriolis Effect – bending of the wind Coriolis Effect – bending of the wind

18
CLIMATE FACTORS Trade Winds: Low lat. – Southeasterly & Northeasterly Westerlies: Mid Lat. – carry weather across the US from W to E Westerlies: Mid Lat. – carry weather across the US from W to E Polar Easterlies: High Lat. Bring cold air from the poles Polar Easterlies: High Lat. Bring cold air from the poles

20
CLIMATE FACTORS II. Ocean Currents- rivers flowing in the ocean II. Ocean Currents- rivers flowing in the ocean Currents are circular Currents are circular Warm waters flow away from the equator toward the poles & cold water flows back toward the equator Warm waters flow away from the equator toward the poles & cold water flows back toward the equator affect temperature & amount of precipitation of an area. affect temperature & amount of precipitation of an area.

21
III. Latitude Zones -Biggest effect on climate! Low/Tropics - areas near the equator that remain warm, 23½° N - 23½°S Low/Tropics - areas near the equator that remain warm, 23½° N - 23½°S Mid/Temperate - usually has four different seasons 23½° -66° N & 23½° – 66° S Mid/Temperate - usually has four different seasons 23½° -66° N & 23½° – 66° S High/Polar - areas near the poles that receive little solar energy and are cold most of the time. 66° - 90° N & 66° - 90° S High/Polar - areas near the poles that receive little solar energy and are cold most of the time. 66° - 90° N & 66° - 90° S CLIMATE FACTORS

22
IV. Elevation- distance above sea level IV. Elevation- distance above sea level As altitude increases, air temp drops about 3.5 degrees for every 1000 feet As altitude increases, air temp drops about 3.5 degrees for every 1000 feet Above 12,000 feet climate Above 12,000 feet climate is like the Arctic is like the Arctic

23
CLIMATE FACTORS V. Topography V. Topography Continental Location – coastline more stable. Interior more extremes. Continental Location – coastline more stable. Interior more extremes. Landforms have a large influence on climate. Landforms have a large influence on climate. Windward side of mountain wetter & cooler Windward side of mountain wetter & cooler Leeward side are drier and warmer

24
El Niño Warming of the waters off the coast of South America Warming of the waters off the coast of South America Occurs about every 2-7 years Occurs about every 2-7 years Prevailing easterly winds slow or reverse direction changing the ocean’s temperature Prevailing easterly winds slow or reverse direction changing the ocean’s temperature This affects weather worldwide This affects weather worldwide

25
El Niño Normally easterly winds bring rain and push warm ocean toward Asia and Australia Normally easterly winds bring rain and push warm ocean toward Asia and Australia In El Niño years, winds push warm water and heavy rains toward Americas. We get floods and Australia and Asia get droughts In El Niño years, winds push warm water and heavy rains toward Americas. We get floods and Australia and Asia get droughts

26
La Niña Occurs when the winds blow opposite El Niño Occurs when the winds blow opposite El Niño Winds blow the warmer water to the lands on the western Pacific Rim Winds blow the warmer water to the lands on the western Pacific Rim Causes increased rain in Asia & Australia & drought along Pacific coast of USA Causes increased rain in Asia & Australia & drought along Pacific coast of USA

27
GLOBAL WARMING Temperature has increased 1 degree since late 1800’s Temperature has increased 1 degree since late 1800’s Predicted to increase 3-5 degrees this century Predicted to increase 3-5 degrees this century

28
GLOBAL WARMING Causes? Causes? Earth’s natural warming and cooling cycles Earth’s natural warming and cooling cycles Greenhouse effect- layer of gases released by burning of coal and petroleum traps solar energy which causes higher temperatures Greenhouse effect- layer of gases released by burning of coal and petroleum traps solar energy which causes higher temperatures

29
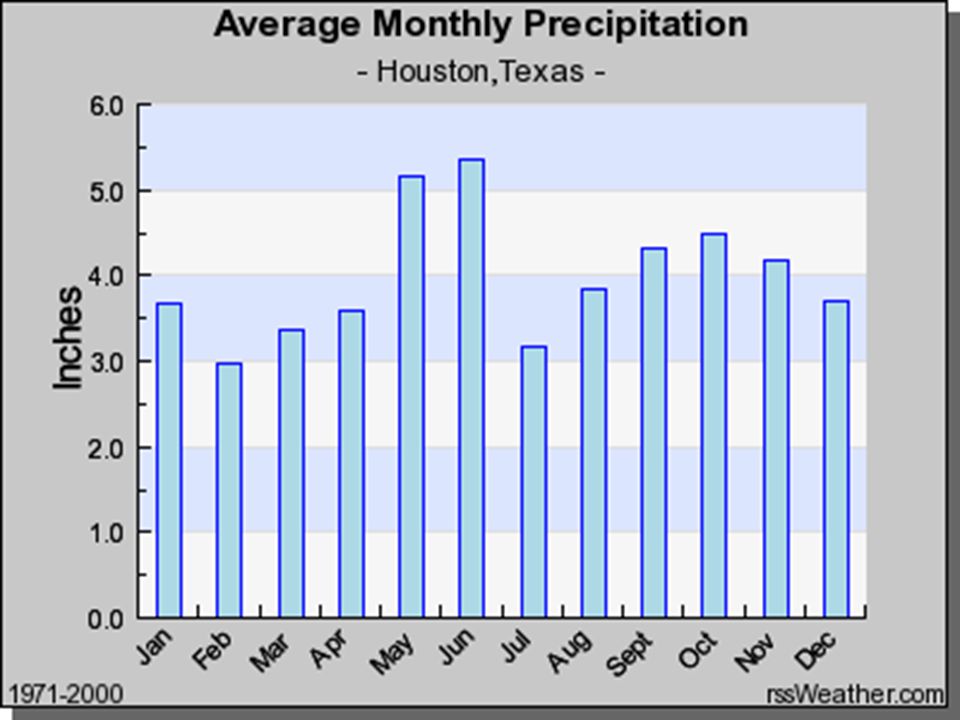
CLIMATE GRAPHS Climate graphs allow us to see how the temperature and rainfall (precipitation) for a particular location have changed on average over one whole year. Climate graphs allow us to see how the temperature and rainfall (precipitation) for a particular location have changed on average over one whole year.
 for a particular location have changed on average over one whole year..")
30
CLIMATE GRAPHS A climate graph is used to display statistics about temperature (how hot or cold it is) and precipitation (rainfall, snow, sleet etc.) gathered for a particular place. The statistics of individual years of weather can vary greatly from one year to the next. Therefore these figures are collected over a long period of time (often 30 years) and an average is calculated. They are climatic statistics rather than weather statistics. A climate graph is used to display statistics about temperature (how hot or cold it is) and precipitation (rainfall, snow, sleet etc.) gathered for a particular place. The statistics of individual years of weather can vary greatly from one year to the next. Therefore these figures are collected over a long period of time (often 30 years) and an average is calculated. They are climatic statistics rather than weather statistics.
 and an average is calculated. They are climatic statistics rather than weather statistics. A climate graph is used to display statistics about temperature (how hot or cold it is) and precipitation (rainfall, snow, sleet etc.) gathered for a particular place. The statistics of individual years of weather can vary greatly from one year to the next. Therefore these figures are collected over a long period of time (often 30 years) and an average is calculated. They are climatic statistics rather than weather statistics..")
31
CLIMATE GRAPHS Temperature is always shown on a climate graph as line graph in red. Temperature is a continuous concept. It moves degree by degree rather than jumping from temperature to a much higher Temperature is always shown on a climate graph as line graph in red. Temperature is a continuous concept. It moves degree by degree rather than jumping from temperature to a much higher or lower one. This is best or lower one. This is best shown by a continuous line. shown by a continuous line.

32
CLIMATE GRAPHS Precipitation per month is complete. It is simply a total amount occurring when the amount for each day is added up. There is no direct relationship between one month and the next. This is best shown by a column graph in blue or black. Precipitation per month is complete. It is simply a total amount occurring when the amount for each day is added up. There is no direct relationship between one month and the next. This is best shown by a column graph in blue or black.

33
CLIMATE GRAPHS Climate graphs can then be used to help explain the relationship between climate and vegetation or climate and landuse by humans. They can also have spaces to describe seasons, human activity and many other useful climate related pieces of information. Climate graphs can then be used to help explain the relationship between climate and vegetation or climate and landuse by humans. They can also have spaces to describe seasons, human activity and many other useful climate related pieces of information.

36
WORLD CLIMATE REGIONS Geographers use generalizations about weather conditions over a long period of time to define a climate region. Geographers use generalizations about weather conditions over a long period of time to define a climate region.

37
WORLD CLIMATE REGIONS Two most significant factors in defining different climates are: Two most significant factors in defining different climates are: Temperature Temperature Precipitation Precipitation

38
CLIMATE REGIONS Other factors: Other factors: Location Location Topography Topography Elevation Elevation

39
CLIMATE PATERNS Geographers use several methods to describe climate patterns. Geographers use several methods to describe climate patterns. Most common method uses latitude to define Most common method uses latitude to define

40
GENERAL CLIMATE REGIONS Tropical (low-latitude) Tropical (low-latitude) Dry Dry Mid-latitude Mid-latitude High-latitude High-latitude Highland Highland
 Tropical (low-latitude) Dry Dry Mid-latitude Mid-latitude High-latitude High-latitude Highland Highland")
41
GENERAL CLIMATE REGIONS Dry and Highland climates will occur at several different latitudes Dry and Highland climates will occur at several different latitudes Geographers divide general regions into sub-regions Geographers divide general regions into sub-regions

42
CLIMATE SUB-REGIONS Tropical Tropical Wet- Tropical Wet- little variation in temperature over year; always hot, avg temp 80; little variation in temperature over year; always hot, avg temp 80; sunny mornings and rainy afternoons; sunny mornings and rainy afternoons; avg rainfall 80+ inches; avg rainfall 80+ inches; found in Central and South America, Africa and SW Asia found in Central and South America, Africa and SW Asia

43
CLIMATE SUB-REGIONS Tropical Wet & Dry Tropical Wet & Dry- rainy season in summer and dry season in winter; temps cooler in dry season and warmer in rainy season; rainfall less than tropical wet and mostly in rainy season; found next to tropical wet climates in Africa, Central and South America

44
CLIMATE SUB-REGIONS Semi-arid- Semi-arid- very little precipitation (16 inches/year); very little precipitation (16 inches/year); hot summers and mild to cold winters; hot summers and mild to cold winters; found in interior of continents or in a zone around deserts; found in interior of continents or in a zone around deserts; contains some of the most contains some of the most productive agricultural productive agricultural lands in the world lands in the world
; very little precipitation (16 inches/year); hot summers and mild to cold winters; hot summers and mild to cold winters; found in interior of continents or in a zone around deserts; found in interior of continents or in a zone around deserts; contains some of the most contains some of the most productive agricultural productive agricultural lands in the world lands in the world")
45
CLIMATE SUB-REGIONS Desert- categorized by rainfall and can be hot or cool/cold; Desert- categorized by rainfall and can be hot or cool/cold; less than 10 inches of rain/year; less than 10 inches of rain/year; hot deserts (Sahara & Arabian) have low humidity and high temps during day and cold at night; hot deserts (Sahara & Arabian) have low humidity and high temps during day and cold at night; cool/cold deserts found at mid-latitudes in Northern Hemispheres in rain shadow of mtns.; summer is warm to hot and winters are cool to freezing cool/cold deserts found at mid-latitudes in Northern Hemispheres in rain shadow of mtns.; summer is warm to hot and winters are cool to freezing
 have low humidity and high temps during day and cold at night; hot deserts (Sahara & Arabian) have low humidity and high temps during day and cold at night; cool/cold deserts found at mid-latitudes in Northern Hemispheres in rain shadow of mtns.; summer is warm to hot and winters are cool to freezing cool/cold deserts found at mid-latitudes in Northern Hemispheres in rain shadow of mtns.; summer is warm to hot and winters are cool to freezing")
46
CLIMATE SUB-REGIONS Mediterranean- named for land around Med. Sea; also on west coast of USA and parts of Australia; summers dry and hot and winters are cool and rainy; supports dense population and rich agriculture and rich agriculture

47
CLIMATE SUB-REGIONS Marine West Coast- Marine West Coast- located close to ocean; located close to ocean; mostly cloudy, foggy and damp; mostly cloudy, foggy and damp; temps relatively constant because of ocean winds; temps relatively constant because of ocean winds; found in parts of US west coast and Canada and most of Western Europe; found in parts of US west coast and Canada and most of Western Europe; rain is evenly distributed throughout year rain is evenly distributed throughout year

48
CLIMATE SUB-REGIONS Humid Subtropical- Humid Subtropical- long periods of summer heat and humidity; long periods of summer heat and humidity; found on east coast of continents; subject to hurricanes; found on east coast of continents; subject to hurricanes; winters are mild to cool; winters are mild to cool; SE USA and China SE USA and China are examples are examples

49
CLIMATE SUB-REGIONS Humid Continental- Humid Continental- great variety of temp and precipitation; found in mid-latitude interiors of Northern Hemisphere; great variety of temp and precipitation; found in mid-latitude interiors of Northern Hemisphere; air masses chilled from arctic flow over area and collide with tropical air masses which causes changing weather conditions ; air masses chilled from arctic flow over area and collide with tropical air masses which causes changing weather conditions ; four seasons are experienced four seasons are experienced

50
CLIMATE SUB-REGIONS Subarctic- Subarctic- covered by evergreen forests called taiga; covered by evergreen forests called taiga; huge temp shift from winter to summer; huge temp shift from winter to summer; summers short and cool and winters very cold; temps at or below freezing 5-8 months of the year summers short and cool and winters very cold; temps at or below freezing 5-8 months of the year

51
CLIMATE SUB-REGIONS Tundra- Tundra- flat, treeless lands forming a ring around the Arctic Ocean; flat, treeless lands forming a ring around the Arctic Ocean; exclusive to Northern Hemisphere; exclusive to Northern Hemisphere; less than 15 inches of precipitation per year; less than 15 inches of precipitation per year; summer lasts only a few weeks and temp may reach 40 degrees summer lasts only a few weeks and temp may reach 40 degrees

52
CLIMATE SUB-REGIONS Ice Cap- Ice Cap- snow, ice and permanently frozen climate; snow, ice and permanently frozen climate; so cold it rarely snows; sometimes called polar deserts because they receive less than 10 inches of precipitation per year; so cold it rarely snows; sometimes called polar deserts because they receive less than 10 inches of precipitation per year; coldest temp ever recorded -128.6 coldest temp ever recorded -128.6

53
CLIMATE SUB-REGIONS Highlands- climate varies with elevation, topography and continental location; could be temperate up to arctic climate depends on elevation Highlands- climate varies with elevation, topography and continental location; could be temperate up to arctic climate depends on elevation

54
SOILS AND VEGETATIONS World’s food supply grows in the top 6 inches of soil, topsoil. World’s food supply grows in the top 6 inches of soil, topsoil. Type of vegetation is determined by the depth, mixture and humus content of the soil. Type of vegetation is determined by the depth, mixture and humus content of the soil.

55
VEGETATION REGIONS Vegetation patterns are identified by the ecosystems they support. Vegetation patterns are identified by the ecosystems they support. The ecosystems of a region, called a biome, are divided into: The ecosystems of a region, called a biome, are divided into: ForestGrassland Desert Tundra

56
FORESTS Categorized by the types of trees they support Categorized by the types of trees they support Broadleaf (i.e. Maple & oak called deciduous) Rain forest is covered with broadleafs Needleleaf (i.e. Pine and fir called coniferous)
 Rain forest is covered with broadleafs Needleleaf (i.e. Pine and fir called coniferous).")
57
GRASSLANDS Savannas in tropical regions Savannas in tropical regions Steppes in Northern Hemisphere Steppes in Northern Hemisphere Many names in South America – Pampas, Cerrado, Llanos Many names in South America – Pampas, Cerrado, Llanos

58
Tundra- plants like lichen and mosses are specially adapted to grow there in dry, cold conditions Tundra- plants like lichen and mosses are specially adapted to grow there in dry, cold conditions Desert- plants must be able to conserve water and withstand heat. Plants like cacti and sagebrush are good there. Desert- plants must be able to conserve water and withstand heat. Plants like cacti and sagebrush are good there.

59
FOR TEST Be sure to add Global Wind Currents map on pg 54 to your notes. Be sure to add Global Wind Currents map on pg 54 to your notes. Know how to read a Climate Chart Know how to read a Climate Chart

Similar presentations


 Which is closest to the equator?>")


>")

 CLIMATE VS. WEATHER Climate is the weather pattern in one place over a long period of time Weather is the current atmospheric conditions, including.>")


