Download presentation
Presentation is loading. Please wait.

1
Senegal Change Assessment Ugo Leonardi GLCN Land Cover/Remote Rensing Expert ugoleonardi@yahoo.it

2
Within the F.A.O. LADA (Land Degradation Assessment in Drylands) framework (http://www.fao.org/nr/lada/), an analysis of land cover changes in Senegal from 1990 to 2005 was performed between October 2007 and March 2008. The analysis covered all the classes present in the Senegal 2005 Land Cover legend, but particular attention was given to the more sensitive areas such as Forest, Agricultural land and Urban areas. Land cover changes can be driven by anthropogenic and natural alterations as: climate-related change (long- and short term) burning / fire activities cutting and clearing of forests (deforestation) grazing activities (intensification of rangelands) agricultural encroachments (farming activities) fuel wood consumption urban expansions (urbanization) natural successional processes and regeneration
 framework ( an analysis of land cover changes in Senegal from 1990 to 2005 was performed between October 2007 and March The analysis covered all the classes present in the Senegal 2005 Land Cover legend, but particular attention was given to the more sensitive areas such as Forest, Agricultural land and Urban areas. Land cover changes can be driven by anthropogenic and natural alterations as: climate-related change (long- and short term) burning / fire activities cutting and clearing of forests (deforestation) grazing activities (intensification of rangelands) agricultural encroachments (farming activities) fuel wood consumption urban expansions (urbanization) natural successional processes and regeneration.")
3
CHANGE DETECTION STEPS: 1.Creation of a Radex Mosaic with the 1990 Landsat TM images 2.Visual analysis of the 1990 images with the 2005 Landsat ETM images using the GeoVis “multiple window” tool 3.Assess if the change occurred in a determined area is due to seasonal factors or not. 4.Define the change, drawing a polygon of the changed area on the 1990 image. 5.Classify the polygon representing a land cover change labelling it with the correspondent land cover type in 1990 (for the encoding of the 1990 change was used the 2005 Senegal legend). 6.When the comparative analysis of 1990 images with 2005 was concluded, the polygons representing a change in 1990 have been intersected with the 2005 land cover interpretation, creating a unique shapefile of changes. 7.Aggregation of land cover classes for the data analysis. 8.Data Analysis
. 6.When the comparative analysis of 1990 images with 2005 was concluded, the polygons representing a change in 1990 have been intersected with the 2005 land cover interpretation, creating a unique shapefile of changes. 7.Aggregation of land cover classes for the data analysis. 8.Data Analysis.")
4
The Dataset Landsat TM and ETM are the images used to assess the changes of Senegal land cover. In the figure below, in red are shown the acquisition dates of the 90’s historical images; in blue are the dates of the 2005 images to be compared with the 90’s.

5
Examples of change detection analysis using the GeoVis multiple window tool. The majority of changes occur in Natural Vegetation, which is usually replaced by Agriculture 19902005

6
1990 2005 Other example of changes occuring in Natural Vegetation areas. On the following pictures are shown two examples where natural vegetation is replaced, in 2005, by agricultural areas. Notice also (blue circle) that also the reverse sometimes occurs. This is due to the shifting cultivation practice, but most of the time the change from natural vegetation to agriculture is permanent.
 that also the reverse sometimes occurs. This is due to the shifting cultivation practice, but most of the time the change from natural vegetation to agriculture is permanent..")
7
In this case bare areas in 1990, have been replaced by natural vegetation (mangroves) in 2005. Notice the black strips in the 2005 Landsat 7 image, due to a permanent problem of the sensor. These strips, sometimes made the assessment of the changes impossible.

8
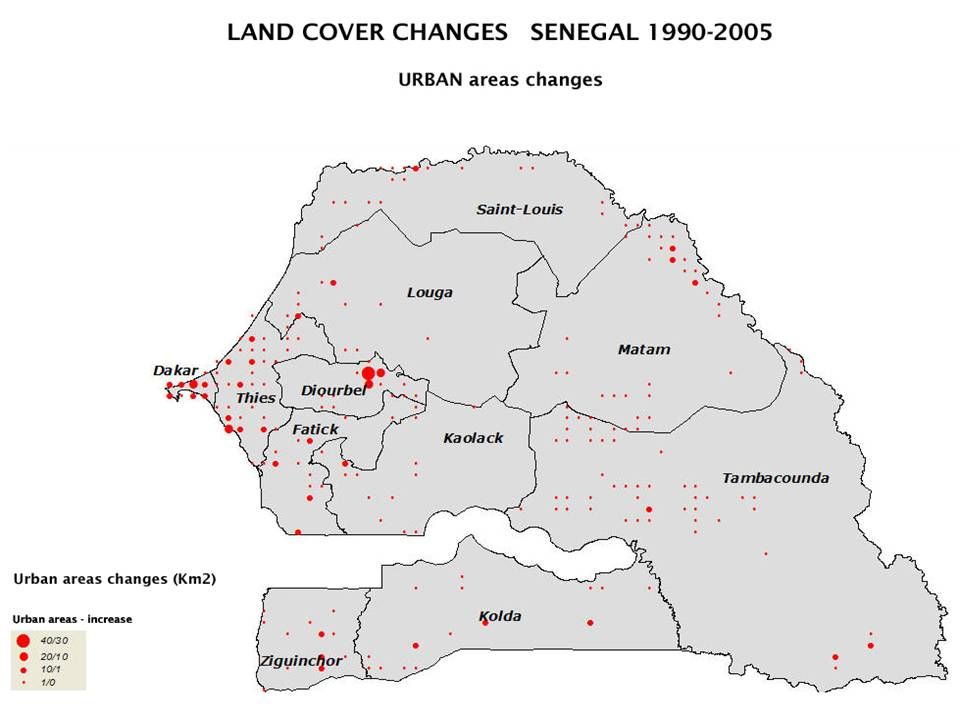
1990 2005 Urban area is another sensitive land cover feature which has been taken into consideration for the Change Assessment of Senegal. On the following pictures are given two examples where both natural vegetation and agricultural areas are replaced, in 2005, by urban areas. Urban areas strongly increased from 1990 to 2005

9
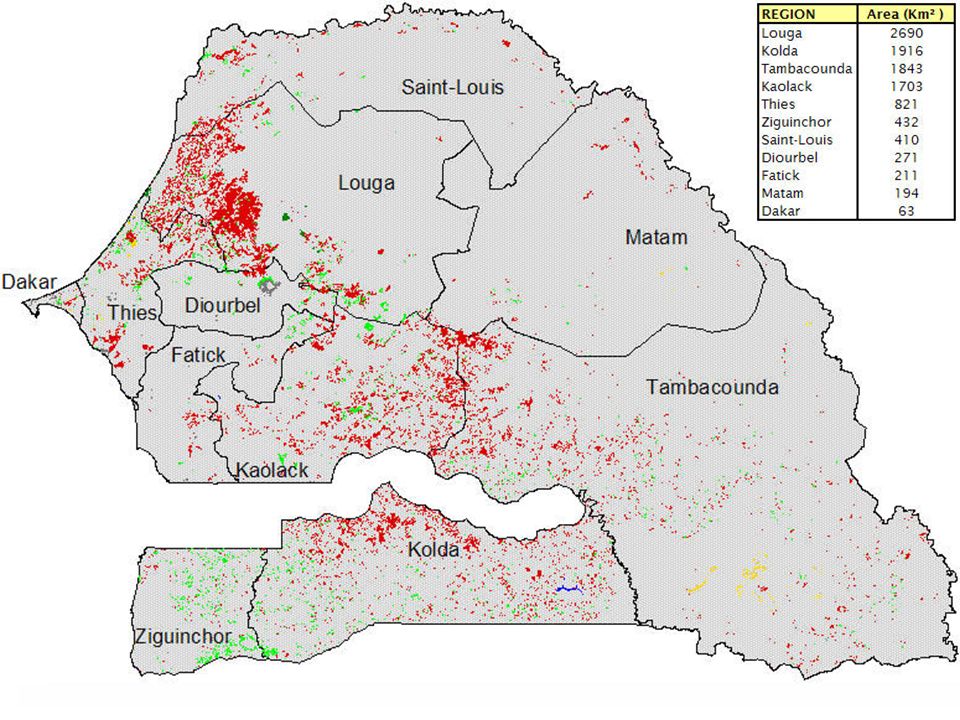
Final shapefile containing polygons with change. The figure below shows in blue color the distribution of the areas where changes occurred in Senegal 19902005

10
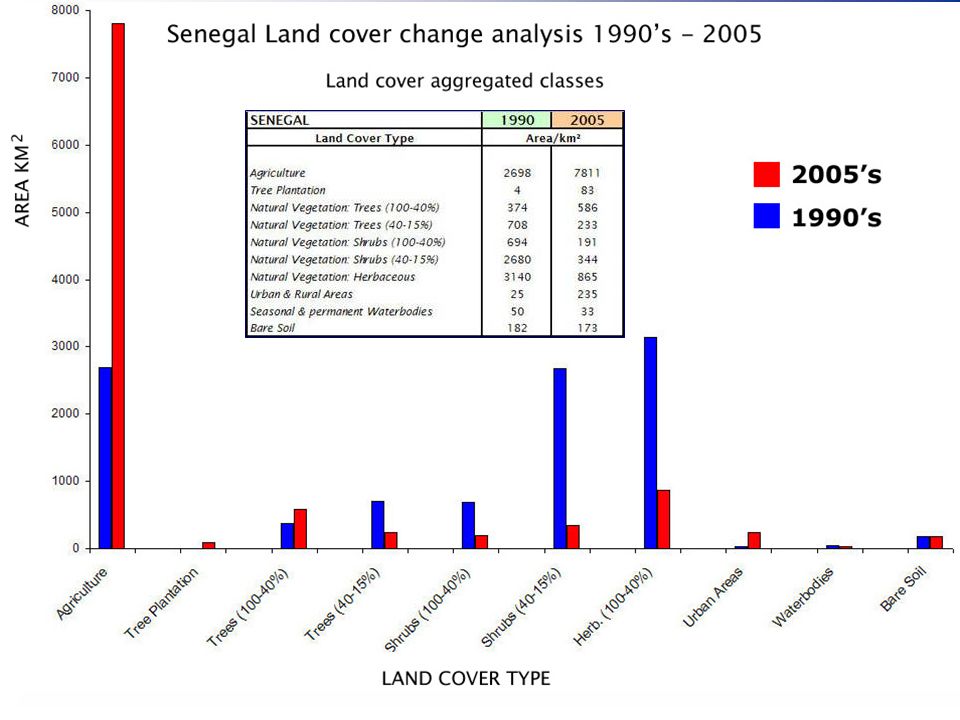
The Thematic Aggregation The land cover change analysis was carried out considering all the land cover classes of the Senegal database. When the visual detection of changes was completed, the Senegal Land Cover legend (version 8.1), used for the labelling, was aggregated on the base of its thematic content. The result is a legend with 10 broader classes, which allows to show up Senegal main features affected by changes. The 10 aggregated classes are: 1. Agriculture in terrestrial and aquatic/regularly flooded land (AG) 2. Forest plantation (TP) 3. Trees closed to open (100-40%) in terrestrial and aquatic/regularly flooded land (NV_TCO) 4. Trees very open (40-15%) in terrestrial and aquatic/regularly flooded land (NV_TVO) 5. Shrubs closed to open (100-40%) in terrestrial and aquatic/regularly flooded land (NV_SCO) 6. Shrubs very open (40-15%) in terrestrial and aquatic/regularly flooded land (NV_SVO) 7. Herbaceous closed to open (100-40%) in terrestrial and aquatic/regularly flooded land (NV_HER) 8. Urban areas (UB) 9. Bare areas (BS) 10. Seasonal/perennial, natural/artificial Water bodies and tidal areas (WAT)
, used for the labelling, was aggregated on the base of its thematic content. The result is a legend with 10 broader classes, which allows to show up Senegal main features affected by changes. The 10 aggregated classes are: 1. Agriculture in terrestrial and aquatic/regularly flooded land (AG) 2. Forest plantation (TP) 3. Trees closed to open (100-40%) in terrestrial and aquatic/regularly flooded land (NV_TCO) 4. Trees very open (40-15%) in terrestrial and aquatic/regularly flooded land (NV_TVO) 5. Shrubs closed to open (100-40%) in terrestrial and aquatic/regularly flooded land (NV_SCO) 6. Shrubs very open (40-15%) in terrestrial and aquatic/regularly flooded land (NV_SVO) 7. Herbaceous closed to open (100-40%) in terrestrial and aquatic/regularly flooded land (NV_HER) 8. Urban areas (UB) 9. Bare areas (BS) 10. Seasonal/perennial, natural/artificial Water bodies and tidal areas (WAT).")
11
THE DATABASE STRUCTURE The shapefile Sen_change_90-05 contains all the Senegal Change Assessment data. It is in UTM projection (Zone 28 – Datum: WGS 84) and its database is composed by 19 fields, described as follow: Auto_id = a unique identification number for each polygon Code_2005 = the 2005 LCCS code Sen_2005 = the 2005 User Label (A in case of single units; A/B in case of mixed units) Code1_05 = the 2005 User Label present as first term of the code (A) Code2_05 = the 2005 User Label present as second term of the code (B), in case on mixed units Agg_1_05 = the 2005 Aggregated code present as first term Agg_2_05 = the 2005 Aggregated code present as second term, in case on mixed units Perc_05 = the Percentage to be considered during the area calculation process. It represents the percentage of cover due to each term composing the code for the 2005 classes. Code_1990 = the 1990 LCCS code Sen_1990 = the 1990 User Label (A in case of single units; A/B in case of mixed units) Code1_90 = the 1990 User Label present as first term of the code (A) Code2_90 = the 1990 User Label present as second term of the code (B), in case on mixed units Agg_1_90 = the 1990 Aggregated code present as first term Agg_2_90 = the 1990 Aggregated code present as second term, in case on mixed units Perc_90 = the Percentage to be considered during the area calculation process. It represents the percentage of cover due to each term composing the code for the 1990 classes. Region = the name of the Senegal Region to which the polygons belong Hectares = the area calculated in hectares. Agr_05 = the percentage of agriculture present in the polygon in 2005 Agr_90 = the percentage of agriculture present in the polygon in 1990
 and its database is composed by 19 fields, described as follow: Auto_id = a unique identification number for each polygon Code_2005 = the 2005 LCCS code Sen_2005 = the 2005 User Label (A in case of single units; A/B in case of mixed units) Code1_05 = the 2005 User Label present as first term of the code (A) Code2_05 = the 2005 User Label present as second term of the code (B), in case on mixed units Agg_1_05 = the 2005 Aggregated code present as first term Agg_2_05 = the 2005 Aggregated code present as second term, in case on mixed units Perc_05 = the Percentage to be considered during the area calculation process. It represents the percentage of cover due to each term composing the code for the 2005 classes. Code_1990 = the 1990 LCCS code Sen_1990 = the 1990 User Label (A in case of single units; A/B in case of mixed units) Code1_90 = the 1990 User Label present as first term of the code (A) Code2_90 = the 1990 User Label present as second term of the code (B), in case on mixed units Agg_1_90 = the 1990 Aggregated code present as first term Agg_2_90 = the 1990 Aggregated code present as second term, in case on mixed units Perc_90 = the Percentage to be considered during the area calculation process. It represents the percentage of cover due to each term composing the code for the 1990 classes. Region = the name of the Senegal Region to which the polygons belong Hectares = the area calculated in hectares. Agr_05 = the percentage of agriculture present in the polygon in 2005 Agr_90 = the percentage of agriculture present in the polygon in")
12
AREA CALCULATION The area calculation is a very sensitive issue since on this data is made the estimation of land cover changes. In order to give an exact estimation of the aggregated classes coverage, the area was calculated considering both terms of the mixed units, and giving them a different weight according to their original code. Fields “Perc_90 “ and “Perc_05” show, for each polygon, the percentage considered for the area calculation, representing the percentage of cover due to each term composing the polygon code. In single units, 100% of polygon coverage was attributed to the aggregated land cover class, whichever it was. In mixed units, the aggregated class area was calculated attributing 60% of polygon coverage to the first term, and 40% of polygon coverage to the second term of the mixed unit. The only exception in area calculation occurs in mixed units where Scattered Isolated agricultural classes are present (always as second term), representing less than 15% of the polygon cover. In this case 85% of polygon coverage was attributed to the first term, and 15% of polygon coverage was attributed to the second term of the mixed unit.
, representing less than 15% of the polygon cover. In this case 85% of polygon coverage was attributed to the first term, and 15% of polygon coverage was attributed to the second term of the mixed unit..")
13
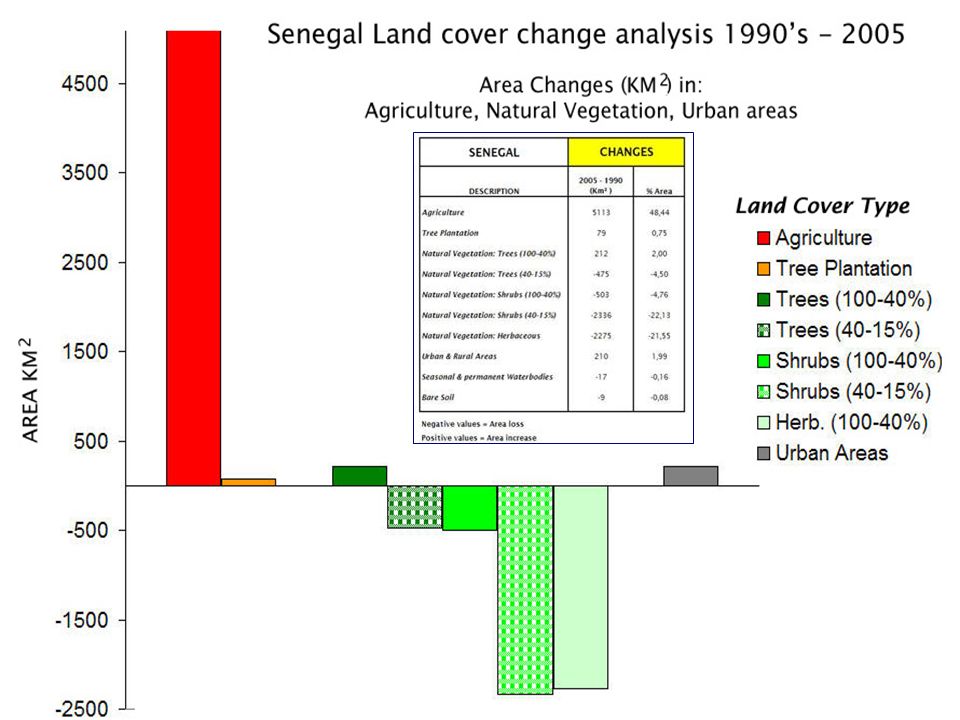
Summary of Changes in Senegal

18
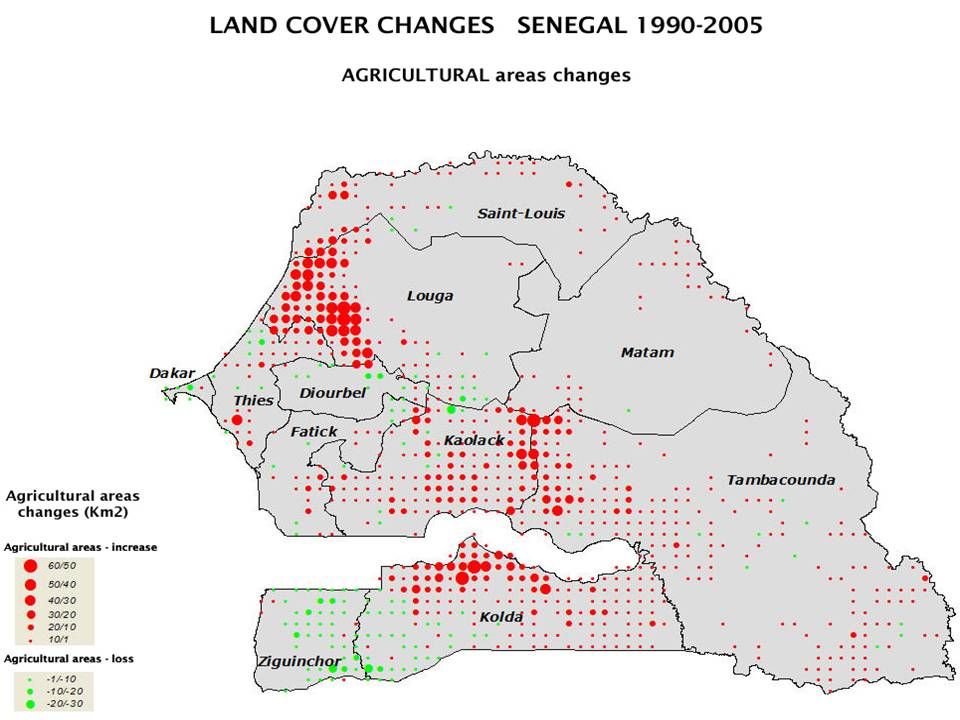
Change areas – Results – Proportional symbols map

23
The database updating In May 2009 the shapefile of the Senegal changes was updated with the final land cover legend.

24
After the updating, the shapefile containing the changes was intersected with the land cover shapefile, in order to run the MadCat standard reports for the statistical analysis of changes. MadCat standard “Changes Basic Report”

25
MadCat standard “Changes Extended Report”

26
Thank You

Similar presentations


, V. Egorov (IKI RAN) and E. Bartholomé (JRC EC)>")


, Italy>")
physical cover on the earth’s surface on the earth’s surface. It includes vegetation and man-made features as.>")


 carried out by FAO Food and Agriculture Organization.>")