Download presentation
Presentation is loading. Please wait.

1
Unit 2 Lesson 1: The Coordinate Plane Objectives: To plot points on a coordinate plane To name points on a coordinate plane

2
Y-axis X-Axis Quadrant IQuadrant II Quadrant IIIQuadrant IV When you have a horizontal and vertical number line set up as the one pictured, this is called a coordinate plane. Origin

3
Naming a point on a plane: (x,y) Coordinates are an ordered pair of numbers that locates a point in the coordinate plane. 2 3 The coordinates of this point is (2,3)
.")
4
Example 1: What are the coordinates of the following points? A: B: C: D: (4,4) 4 4 -3 (-3,-3) (3,-6) (-5,2)
 (-3,-3) (3,-6) (-5,2).")
5
Example 2: Graph each of the following points on the coordinate plane. A: (-5,1) B: (6,5) C: (-5,0) D: (0,0) E: (-1, -4)
 B: (6,5) C: (-5,0) D: (0,0) E: (-1, -4).")
6
Now let’s try it in our classroom’s coordinate plane!

7
Example 3: Make a table for the equation y=2x X-20123 y -4-20246 Now, plot these points on a coordinate plane!

8
X-20123 F(x) Example 4: Make a table for the equation f(x) = -5x +4 1494-6-11 *If your numbers do not fit, you may have to change your scale!*
 Example 4: Make a table for the equation f(x) = -5x *If your numbers do not fit, you may have to change your scale!*")
9
Describing Graphs Objectives: To be able to label and describe an event based on a graph To be able to sketch a graph based on a description of an event

10
Commute: One student walks and takes a bus to get from school to home each day. The graph below, shows the student’s commute by relating the time the student spends commuting and the distance he travels. Describe what the graph shows by labeling each part.

11
Independent Variable vs. Dependent Variable Example: From the Commuter graph Dependent variable: the variable whose value depends on the value of the other variable *This value is always represented on the y-axis Independent variable: the variable whose value does not depend on the value of the other variable *This value is always represented on the x-axis Dependent Variable: Distance Independent Variable: Time Depends on

12
Example 2: Label each section of the graph.

13
Sketching a graph: Travel: A plane is flying from New York to London. Sketch a graph of the plane’s altitude during the flight (the flight includes taking off, cruising altitude, circling the runway, and landing). Label each section.
. Label each section..")
15
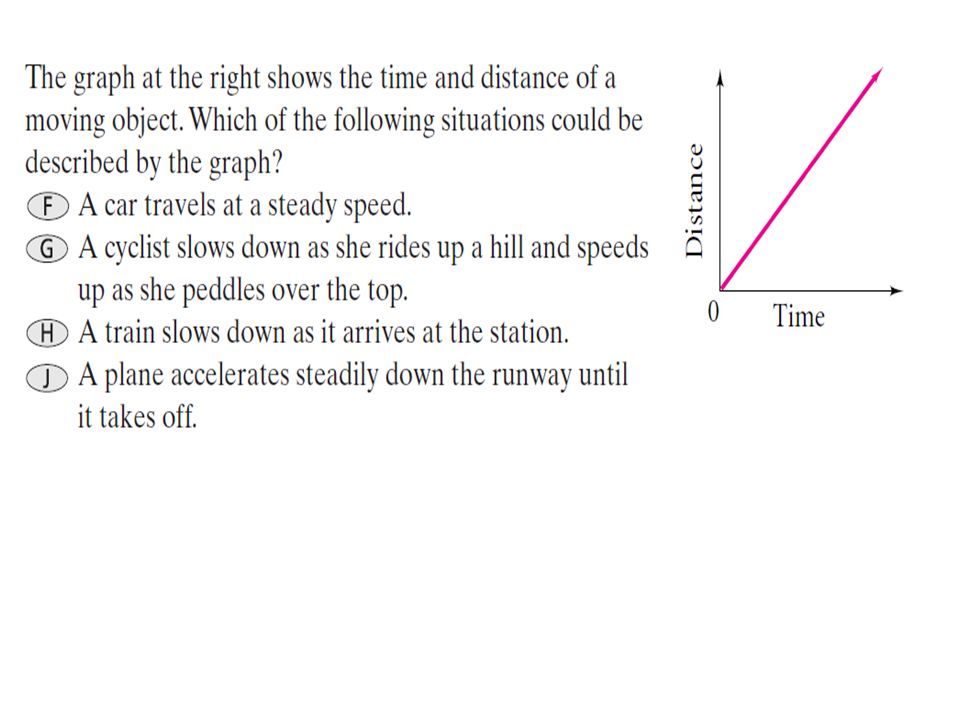
Your friend said that this graph describes a person bicycling up and then down a hill. Explain your friend’s error.

16
Objectives: To determine the domain and range of a relation To describe a graph as increasing, decreasing, or constant

18
Domain and Range of a Relation A relation is a set of ordered pairs (coordinates). The (age, height) ordered pairs below form a relation
 ordered pairs below form a relation.")
19
Domain of a relation: the first coordinates (x or input) in a set of ordered pairs of a relation Domain: {,,,} 14182021 Range: {,,,, } 4.254.404.855.005.25 *Notice we only write 18 once in our domain Range of a relation: the second coordinates (y or output) in a set of ordered pairs of a relation or function
 in a set of ordered pairs of a relation Domain: {,,,} Range: {,,,, } *Notice we only write 18 once in our domain Range of a relation: the second coordinates (y or output) in a set of ordered pairs of a relation or function")
20
Example 2: START OF GUIDED NOTES Find the Domain and Range for the ordered pairs below. a ) (2,3), (3,4), (6,7), (4,10) Domain: {2,3,4,6} Range: {3,4,7,10} b)(3,15), (7,-35), (-1,5), (4,15) Domain: {-1,3,4,7} Range: {-35,5,15}
 (2,3), (3,4), (6,7), (4,10) Domain: {2,3,4,6} Range: {3,4,7,10} b)(3,15), (7,-35), (-1,5), (4,15) Domain: {-1,3,4,7} Range: {-35,5,15}.")
21
100200300400500600 152025303540 Example 2: State the domain and range. a) Domain:Range:
 Domain:Range:")
22
10.511.512.513.514.515.5 403020100-10 Example 3: State the domain and range. Domain:Range:

23
Example 3: a)Find the Domain and Range for the graphs below. b)Describe the intervals as increasing, decreasing, or constant c)Identify the independent and dependent variable a)Domain:Range: b) fromto c) Is the dependent variable. is the independent variable.
Describe the intervals as increasing, decreasing, or constant c)Identify the independent and dependent variable a)Domain:Range: b) fromto c) Is the dependent variable. is the independent variable..")
24
Domain:Range: Description:

25
Domain: Range: Description:

26
Domain: Range: WARM UP:

27
WARM UP: State if the following graph is a function. Then give its domain and range. Function (yes/no): Domain: Range: Description:
: Domain: Range: Description:.")
29
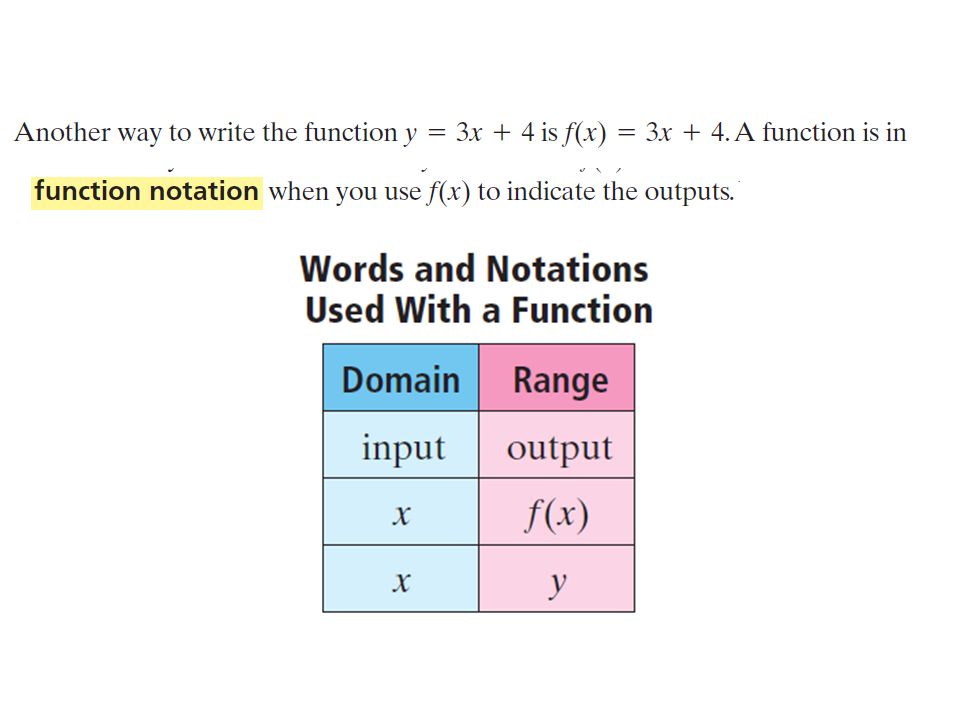
A function is a relation that assigns exactly one output (range) value for each input (domain) value. Example: Y = 3x + 4 OutputInput X (input)Y (output) 1 2 3 4 7 10 13 16
Y (output)")
30
Vertical-Line test: If any vertical line passes through more than one point of the graph, then the relation is not a function. How do we tell if a relation is a function?

31
Example 1: Determine whether the relation is a function. a) { (5,-2), (9,-1), (-4,-2), (7,7) }
 { (5,-2), (9,-1), (-4,-2), (7,7) }")
32
Example 2: Determine whether the relation is a function using a mapping diagram. a) { (-2,-1), (-1,0), (6,3), (-2,1) } TRY ONE:
 { (-2,-1), (-1,0), (6,3), (-2,1) } TRY ONE:.")
33
Does this graph represent a functio n ?

35
State if the following graph is a function. Then give its domain and range. Function: Domain: Range: TRY ONE:

36
Example 2: TRY ONE: Make a table for f(x) = -2x -4 X-2x -4F(x) 0 1 2 3 Domain: Range: Function (yes/no): Graph the points from our table and connect them to form a line.
 = -2x -4 X-2x -4F(x) Domain: Range: Function (yes/no): Graph the points from our table and connect them to form a line.")
38
Reasonable Domain and Range: Miranda earns $7 per hour for babysitting after school and on Saturday. She works no more than 16 hours per week. a)Identify the independent and dependent quantities. b)Find the reasonable domain and range c)Write the reasonable domain and range as inequalities
Identify the independent and dependent quantities. b)Find the reasonable domain and range c)Write the reasonable domain and range as inequalities.")
39
Alexis downloads songs for $.75 each. He has between $3.00 and $6.00 to spend on songs. a)Identify the independent and dependent quantities for this situation b) Find the reasonable domain and range values. c) Write the domain and range as inequalities. TRY ONE:
Identify the independent and dependent quantities for this situation b) Find the reasonable domain and range values. c) Write the domain and range as inequalities. TRY ONE:.")
40
Your turn to practice! We will go over numbers 1-3 in 5 minutes!

41
Exit Slip: State the domain and range of the graph and whether it is a function.

42
Objectives: 1)To find the slope from a graph 2)To find slope from a table of values 3)To find slope from ordered pairs 4)To find the rate of change
To find the slope from a graph 2)To find slope from a table of values 3)To find slope from ordered pairs 4)To find the rate of change")
43
RATE OF CHANGE Change in y Change in x

44
Hours12345 Babysitting Cost 2535455565 Rate of Change= 10 1 = 10 Change in y = 35-25 = 10 Change in x = 2-1 = 1

45
Minutes2030405060 Miles246810 Rate of Change= 2 10 = 1 5 Change in y = 4-2 = 2 Change in x = 30-20 = 10

46
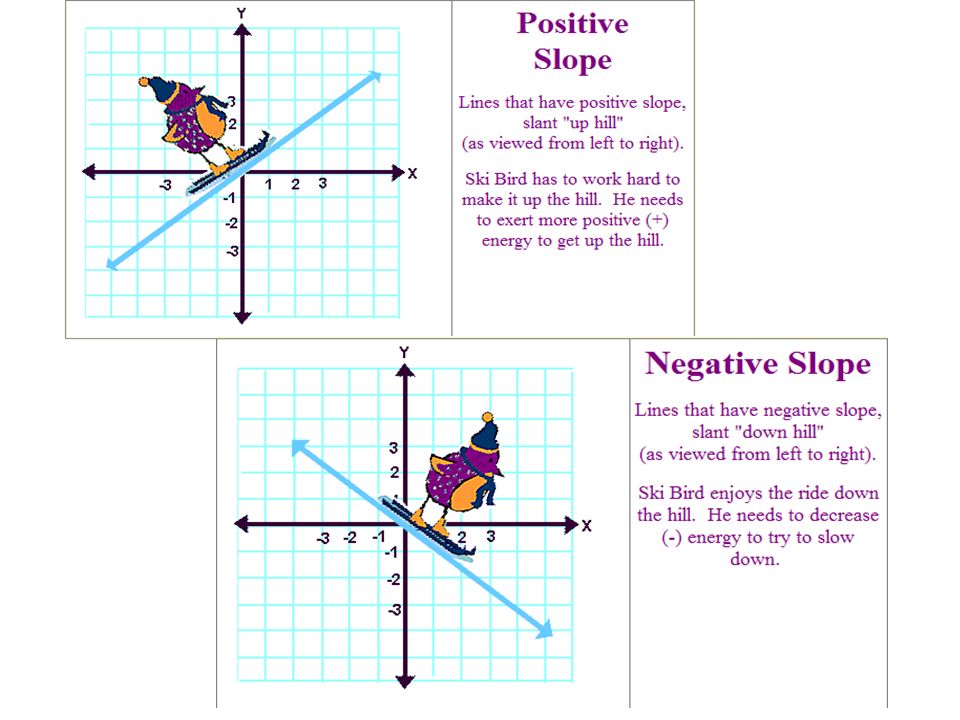
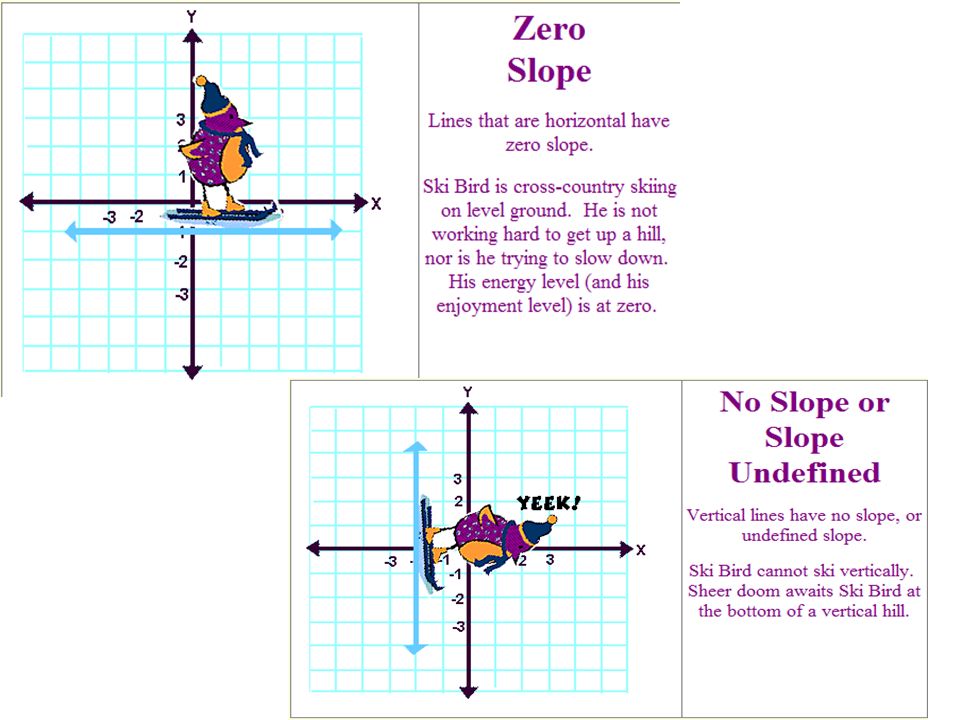
What do you think of when you hear the word slope?

48
Blocks activity

49
Example 2: Find the rate of change and slope from a graph Rise 3 Run 2 Rate of Change= 3 2 Change in y = 3 Change in x = 2 Slope: Rise Run Rise = 3 Run = 2 = 3 2

50
Change in y = -4 Change in x = 5 Slope: Rise = -4 Run 5 Rise =-4 Run = 5 Rate of Change= -4 5

51
Rate of Change: Slope:

52
Rate of Change: Slope:

53
Rate of Change: Slope:

56
Can we find slope some other way? Why, yes! You can! Rate of change: change in y change in x Slope (m): y 2 -y 1 x 2 -x 1
: y 2 -y 1 x 2 -x 1.")
57
Example 3: Find slope from ordered pairs. Ordered pairs: Slope:

58
Ordered pairs: Slope:

59
a) (4,5) and (6,1) Step 1: Write the slope formula M = y 2 -y 1 x 2 -x 1 Step 2: Label your coordinates (4,5)(6,1) x1x1 x2x2 y1y1 y2y2 Step 3: Substitute your values into the formula M = 1-5 6-4 Step 4: Calculate your slope M = 1-5 6-4 M = -4 2 M = -2
 (4,5) and (6,1) Step 1: Write the slope formula M = y 2 -y 1 x 2 -x 1 Step 2: Label your coordinates (4,5)(6,1) x1x1 x2x2 y1y1 y2y2 Step 3: Substitute your values into the formula M = Step 4: Calculate your slope M = M = -4 2 M = -2")
60
b) (-2,4) and (-4,-2) Step 1: Write the slope formula M = y 2 -y 1 x 2 -x 1 Step 2: Label your coordinates(, ) Step 3: Substitute your values into the formula M = Step 4: Calculate your slope M =
 (-2,4) and (-4,-2) Step 1: Write the slope formula M = y 2 -y 1 x 2 -x 1 Step 2: Label your coordinates(, ) Step 3: Substitute your values into the formula M = Step 4: Calculate your slope M =")
61
Step 1: Write the slope formula M = y 2 -y 1 x 2 -x 1 Step 2: Label your coordinates (5,9)(7,9) x1x1 x2x2 y1y1 y2y2 Step 3: Substitute your values into the formula M = 9-9 7-5 c) (5,9) and (7, 9) Step 4: Calculate your slope M = 9-9 7-5 M = 0 2
(7,9) x1x1 x2x2 y1y1 y2y2 Step 3: Substitute your values into the formula M = c) (5,9) and (7, 9) Step 4: Calculate your slope M = M = 0 2")
62
Example 4: Find slope from a word problem. a) If the temperature of a beverage changes from 200 ô F at a time of 0 minutes to 150 ô F at 10 minutes, what is the rate of change? In other words, what is the slope of the line connecting the points (0,200) and (10,150)?
 If the temperature of a beverage changes from 200 ô F at a time of 0 minutes to 150 ô F at 10 minutes, what is the rate of change. In other words, what is the slope of the line connecting the points (0,200) and (10,150) .")
63
b) Denver’s elevation is 1 mile (5280 ft). The elevation of Loveland Pass, 70 miles west of Denver, is 11,900 ft. What is the average slope of the land from Denver to Loveland Pass? (Use 70 miles to approximate the run).
..")
64
Kurt earns $10 per hour babysitting for his neighbors after school. 1)Complete the table below. 2)Plot the ordered pairs on a graph. Do not forget to label your axes and your scale. 3)Connect the points to form a line. Hours1010123456 Money Earned WARM UP
Complete the table below. 2)Plot the ordered pairs on a graph. Do not forget to label your axes and your scale. 3)Connect the points to form a line. Hours Money Earned WARM UP.")
66
Method #1: Creating a table of values. y = 2x + 2 a)Using the equation above, fill in the table below. b)Then, plot the points and connect them to form a line. x-201234 y
Using the equation above, fill in the table below. b)Then, plot the points and connect them to form a line. x y.")
67
We are going to learn 2 other methods to graph a linear equation

68
Method #2: Example 1: 2x + 5y = 10 a)Find the value of x, if y = 0. b)Find the value of y, if x = 0.
Find the value of y, if x = 0..")
69
X-intercept of a line: the point at which the line crosses the x-axis The x-intercept always has a y coordinate of: Y-intercept of a line: the point at which the line crosses the y-axis The y-intercept always has an x coordinate of:

70
Example 2: Graph the following line by finding the x and y intercepts (make sure you label your axes!): 3x – 6 = 2y
: 3x – 6 = 2y")
72
Method #3: Using slope-intercept form (y = mx + b) Slope = m Y-intercept = b Example 1: Y = 2x – 1 Step 1: Identify the slope and y-intercept. Step 2: Plot the y-intercept on your graph. Step 3: Starting at the y-intercept, draw in the rise and run to plot your next point.

73
Example 2: a) Identify the slope and y-intercept. b) Graph the line.
 Identify the slope and y-intercept. b) Graph the line.")
75
Extension: For the following: a)Identify the slope and y-intercept b)Graph the line X + 3y = 12
Identify the slope and y-intercept b)Graph the line X + 3y = 12")
76
For the following: a)Identify the slope and y-intercept b)Graph the line 1)2)3) Y + 5 = -2x-5x + 10y = 15 3(x-2) = 4(y+3) Extension:
Identify the slope and y-intercept b)Graph the line 1)2)3) Y + 5 = -2x-5x + 10y = 15 3(x-2) = 4(y+3) Extension:")
77
Exit Ticket: Of the three ways we learned in class today to graph a linear equation, which do you prefer? Please explain your answer.

78
Then have practice problems..equation, graph line using the intercepts Then move into y=mx + b (m is the slope, b is the y intercept) JUST GRAPHING Then move to writing equations given: slope and y int, two points, word problems Then graphing given an equation, slope and y int, two points, word problems Parallel and perpendicular lines..and I’m done…
 JUST GRAPHING Then move to writing equations given: slope and y int, two points, word problems Then graphing given an equation, slope and y int, two points, word problems Parallel and perpendicular lines..and I’m done…")
Similar presentations


 x-axis y-axis Quadrant I Quadrant II Quadrant III Quadrant IV (+,+) (+,-) (-,+) (-,-) Origin (0,0) Ordered Pair.>")


