Download presentation
Presentation is loading. Please wait.

1
Cash Back Dividends A Market Differentiator August 2015

2
Cash Back Dividends Paid Millions

3
What It Is Not Annual return of “above market” loan interest and “below market” share rates A periodic one-time payment when the Credit Union has a good year

4
What It Is Incremental annual financial reward for choosing us as their Primary Financial Institution Target Cash Back dividend to mirror publicly held bank average of 40% - 50% of average annual net income

5
Cash Back Dividend Objectives Key brand element True market differentiator Brings concept of member-ownership to life

6
Ingredients to Success Defined capital management strategy Competitive or better interest rates and fees Operational excellence Outstanding service

7
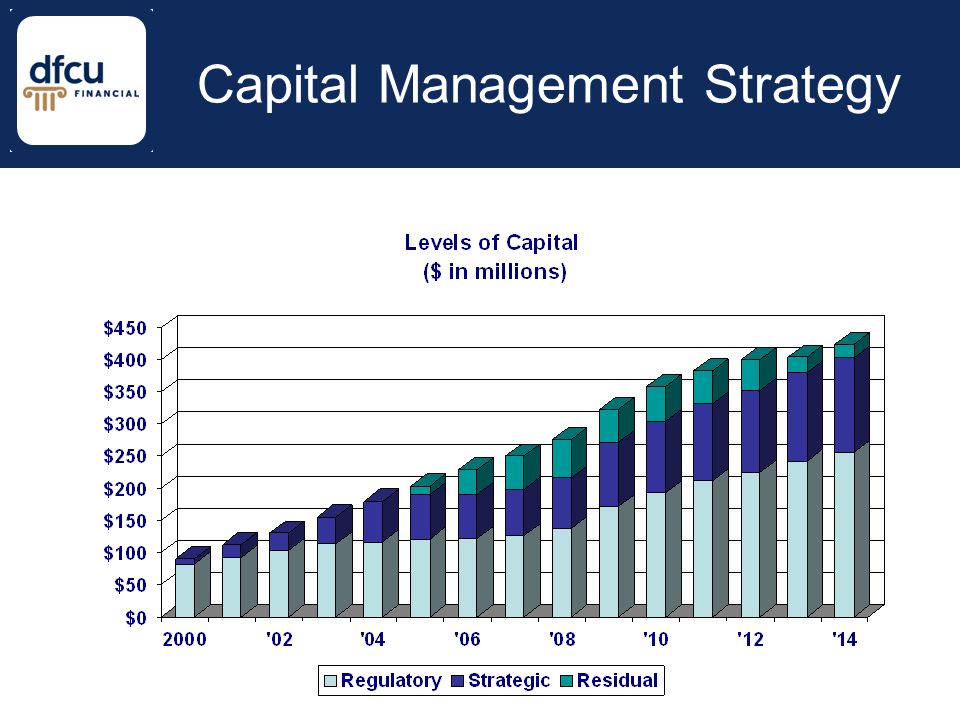
Capital Management Strategy Level I – Regulatory Capital Level II – Strategic Capital Level III - Residual Capital

8
Capital Management Strategy

10
DFCU Financial Story “Achieving Operational Excellence”

11
Michigan Marketplace20002010 % Change Population count 9,938,492 9,938,4929,883,640(0.56) Population state ranking 88 Population change ranking 1351 Household median income 45,51246,2761.68 Household income state ranking 1633 Population ranking includes the District of Columbia
 Population state ranking 88 Population change ranking 1351 Household median income 45,51246, Household income state ranking 1633 Population ranking includes the District of Columbia")
12
DFCU 9 Year Compounded Annual Growth Rate Net Income 7.0% Operating Revenue 5.3% Non-Interest Expense 4.1% Average Assets 8.7% Average Capital 6.9% Excludes Cash Back dividend Compounded growth for years 2006 to 2014

13
DFCU Financial Story Millions $30 $34 $31 $34 $41 $49 $56 $54

14
DFCU Financial Story Core Net Operating Revenue 1.9 Times 2000 Level

15
DFCU Financial Story Core Non-Interest Income 2.6 Times 2000 Level

16
DFCU Financial Story In 2009 CapCom merger and in 2010 MidWest merger Millions Non-Interest Expense (excluding Cash Back dividend) 1.4 Time 2000 Level
 1.4 Time 2000 Level")
17
DFCU Financial Story Note: Efficiency improvement of 23% at Net Operating Revenue of $120 million = $28 million in annual savings

18
DFCU Financial Story Average Assets 3.7 Times 2000 Level

19
DFCU Financial Story 1.69 % 1.66 % 1.69% 1.25 % 1.23 % 1.38 % 1.54% 1.62% 1.47%

20
DFCU Share of Wallet20062014 % Change Number of members 166,865215,13428.9% Loans outstanding per member $7,737$7,318-5.4% Deposits outstanding per member $8,013$14,85385.4% Investments outstanding per member $2,699$5,578106.7% Note: Loan outstandings per member include sold loans that DFCU services

21
Key Ingredients Commit to a brand strategy Agree with board of directors on capital management strategy Tenaciously seek operational excellence

22
Benefits and Risks Benefits Key brand element True market differentiator Brings member ownership to life Annual dividend is discretionary Risks Members come to expect Credit union must be consistently high performing

23
Cash Back Dividend vs. Better Rates and Fees Variable vs. fixed costs Maintaining performance measurement Institutional vs. product level incentive

24
Member Stories

25
Dividend Calculator

26
Dividend Estimator

27
Dividend Qualification Criteria CategoryAgeAmount Minor< 18$100In Average Loan and Deposit Balances Youth18 - 25$1,000In Average Loan and Deposit Balances Adult> 25$5,000In Average Loan and Deposit Balances

28
Questions mark.shobe@dfcufinancial.com

Similar presentations


 FIN 200: Personal Finance Topic 17–Stock Analysis and Valuation Lawrence Schrenk, Instructor.>")


