Download presentation
Presentation is loading. Please wait.

1
The Results of the 2009 Youth Risk Behavior Survey and the 2009 Attitudes and Behaviors Survey

2
A Risk Factor is simply, something in a teens life that increases the potential for them to make an unhealthy choice about their life. A Protective Factor is the opposite; something in a teens life that increases the potential for them to make a healthy choice about their life. Everyone has both risk and protective factors in their life, the goal of the work of the coalition is to increase protective factors and reduce risk factors.

3
The Youth Risk Behavior Survey (YRBS) is given to students throughout the state of Vermont every two years (at participating schools) The survey measures student perceptions around different types of risky behaviors, including alcohol, tobacco, drugs, sexual behaviors, eating disorders, etc. The survey also measures youth assets (positive attributes) in their lives.
 in their lives..")
4
The Attitudes and Behaviors survey, developed by the Search Institute, measures our teens “assets” and determines how our teens perceive themselves with regards to the 40 Developmental Assets, The A & B Survey looks at both internal and external assets. Internal Assets are about “inner” things, such as personal ethics, motivation, etc., and are usually intrinsic in the values demonstrated. External Assets are around our teens, in their environment and their sphere of influence. These might include infrastructure, signage, community resources, people in their lives, and attitudes. These are areas where community coalitions often have more of an opportunity to provide positive change.

5
Inconsistency in how someone answers a question (or questions) can lead to their responses being eliminated. We don’t JUST use this data to inform how we do stuff. We look at other data sources and use that as well. We try to use qualitative as well as quantitative methods for gaining info. about what is important for our youth and our community.

6
Looking at data sources helps “drive” the work of the coalition in the direction that is most necessary, i.e., if there is a rising need for interventions around prescription drugs (as reported by our teens) then we can respond appropriately.
 then we can respond appropriately.")
7
Percent of students who consumed at least one drink of alcohol during the past 30 days What’s important about this slide: students are using more as they get older, and data is showing that the usage is going up over time.

8
Percent of students who binged on alcohol (had five or more drinks of alcohol in a row within a couple of hours) during the past 30 days. What’s important about this slide: Binge drinking continues to be an issue with 37 percent of students binging.

9
Percents of students who first consume alcohol, other than a few sips, prior to age 13. What’s important about this slide: One the whole, early onset seems to be on the decline, the outlier being the 8 th grade students. This might be something we need to take a look at for the future.

10
What’s important about this slide: Our teens are changing their consumption patterns towards consuming liquor as opposed to beer or wine.

11
What’s important about this slide: Girls in our community continue to get alcohol from other people, with a secondary source of giving money to someone else to purchase it for them. We should take a look at who those people might be that they are getting it from.

12
What’s important about this slide: Boys in our community continue to get alcohol from other people, with a secondary source of giving money to someone else to purchase it for them. We should take a look at who those people might be that they are getting it from.

13
Alcohol usage, particularly binge drinking is increasing in our community. Teens are getting alcohol predominantly in the home and from other people. This indicates a good way to do some targeted work in Milton. Teens are providing alcohol to each other! What teens are consuming is changing over to hard liquor. Our restaurants and stores don’t seem to be the place where teens are getting their alcohol. Great job store owners!

14
Percent of students who have ever smoked a whole cigarette

15
Percent of students who smoked cigarettes during the past 30 days What’s important about this slide: on the whole, smoking continues to trend downward. YAY!

16
Percent of students who smoked a whole cigarette prior to age 13 What’s important about this slide: Early onset continues to trend downward, although our 8 th graders again indicate a higher number than the students in higher grades.

17
Percent of students who, during the past seven days, were in the same room with someone who was smoking cigarettes. What’s important about this slide: Consistently, outside of the margin of error, students are reporting increased exposure to secondhand smoke. This is definitely a hot button concern!

18
Percent of students who think most high school students smoke cigarettes (55%+) What’s important about this slide: On the whole, our students indicate that they don’t think that most of their peers are smoking.
 What’s important about this slide: On the whole, our students indicate that they don’t think that most of their peers are smoking.")
19
Tobacco is on the decline in most grades and overall in Milton, this is great news! YIKES!!! Second hand smoke is dramatically higher than it’s been in the past. This is huge! Kids are still being exposed at a young age to smoking and cigarette use. It’s nice to see that on the whole, students see that most of their peers are not smoking.

20
Some things to consider Marijuana, because of it’s prevalence is separated out from some other types of drugs Prescription Drug use/abuse is in here this year! In 2007, the YRBS asked about prescription pain relievers and stimulants in one question. They were separated out this year.

21
Percent of students who used marijuana prior to the age of 13. What’s important about this slide: Early onset of marijuana usage is reducing (again, other than the 8 th grade students) and the numbers continue to be low for early onset with marijuana usage.
 and the numbers continue to be low for early onset with marijuana usage..")
22
Percent of students who used marijuana one or more times during the past 30 days What’s important about this slide: Marijuana usage continues to be an issue for our teens, with other half of our seniors reporting having used it before.

23
Percent of students who used marijuana one or more times during the past 30 days What’s important about this slide: Some of our teens are using marijuana, and there doesn’t seem to be a specific trend from grade to grade in this area.

24
Blue = Percent of students who have ever used a prescription stimulant, such at Ritalin or Adderall, not prescribed to them. Green = Percent of students who have ever used a prescription pain reliever, such as Oxycontin, Vicodin, or other prescription pain killer, not prescribed to them. What’s important about this slide: Prescription drug use is something that is happening in our community, and there seems to be more usage of pain relievers than stimulants.

26
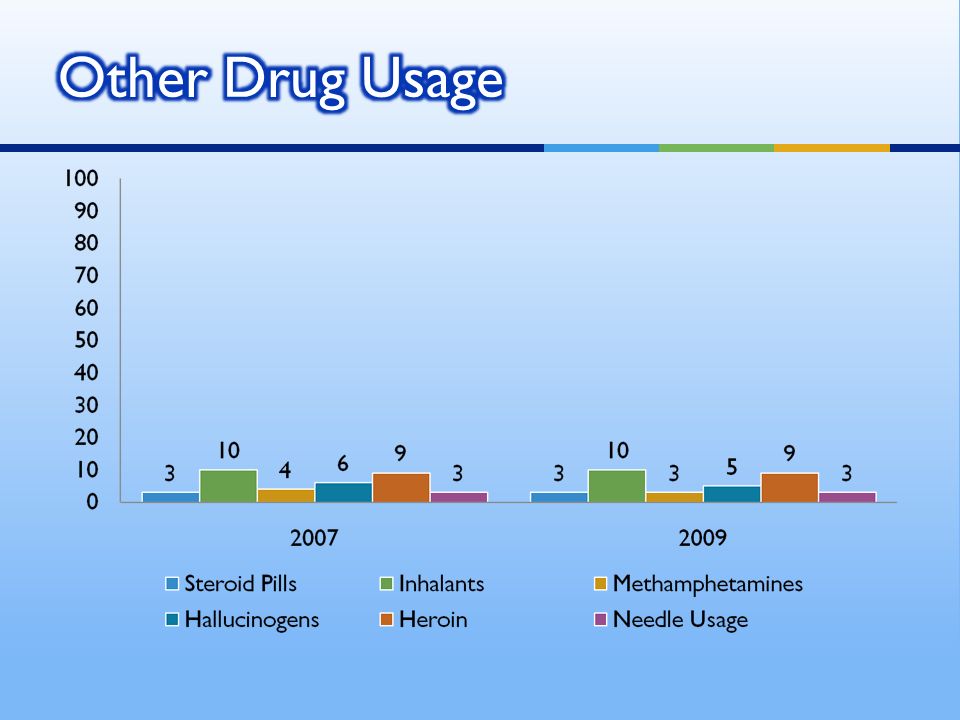
Prescription drug use is becoming something to know more about and our community has an opportunity to address this issue in a timely way. “Harder” drugs continue to be on the very fringes of our population Marijuana is STILL one of our largest issues. Teens are using it, regularly and it’s also regularly available.

27
Some things to keep in mind This survey was given to our CURRENT 7 th -12 th graders (then 6 th -11 th graders) Total sample was 597. This survey indicates both thriving (or protective) and risk factors (yup, that lingo again!) as well as other areas.
 and risk factors (yup, that lingo again!) as well as other areas..")
28
73% of our students indicate that their family life provides a high level of love and support 72% of our students indicate that their best friends model responsible behavior 67% of our students indicate that they are out 2 or fewer nights a week with friends with “nothing special to do.” 71% of our students indicate that they act on their convictions and stand up for his or her beliefs 72% say they tell the truth, even when it’s not easy.

29
52% of students indicate that they care about his or her school. 52% of students indicated that they place a high value on helping other people. 54% of students indicated that they place a high value on promoting equality and reducing hunger and poverty. 48% of students indicated that it is important to not be sexually active or to use alcohol or other drugs. 48% of our students indicate having a high self-esteem. 45% of our students indicate that they can resist negative peer pressure and dangerous situations. 49% of our students indicate that they receive support from three or more nonparent adults. 55% of students indicate that they feel safe at home, school and in the neighborhood. 53% of students indicate that school provides clear rules and consequences. 53% of students indicate that their neighbors take responsibility for monitoring young people’s behavior.

30
15% of our students indicated that they spend 3 or more hours per week in lessons or practice in music, theater or other arts. 24% of students indicated that their parents and other adults model positive, responsible behavior. 29% of students indicated that they spend one or more hours/week in activities in a religious institution. 27% of students indicate that they read for pleasure three or more hours per week. 29% of students indicated that they know how to plan ahead and make choices.

31
What’s important about this slide: Our youth average assets are 18.9 for 2007. This is out of 40 assets that are indicated as important for youth to succeed in life.

32
What’s important about this slide: Our youth average assets are 19.4 for 2009. This is out of 40 assets that are indicated as important for youth to succeed in life. What’s exciting is that it looks like our teens assets are trending upwards!

33
What’s important about this slide: This breaks out the assets by group. Notice the in 2007, the largest number of students fell into the 10-20 and 20-30 brackets.

34
What’s important about this slide: This breaks out the assets by group. This shows that our teens are moving up over time as the bottom group is smallest, second group is larger, third is smaller and fourth is larger.

35
We can create recommendations about how to build assets in our community and for our teens based on the results of their feedback. Ask a coalition staff member to attend a meeting of your club or organization to “spread the wealth” of what our teens are saying. Determine what YOU can do to make a difference for Milton.

Similar presentations

 Highlights from the Healthy Youth Survey Fall 2010.>")
 Highlights from the Healthy Youth Survey Fall 2010.>")
 Highlights from the Healthy Youth Survey Fall 2008.>")
 Highlights from the Healthy Youth Survey Fall 2008.>")
 Highlights from the Healthy Youth Survey Fall 2008.>")
 Highlights from the Healthy Youth Survey Fall 2010.>")
 Highlights from the Healthy Youth Survey Fall 2010.>")
 Highlights from the Healthy Youth Survey Fall 2010.>")
 Highlights from the Healthy Youth Survey Fall 2008.>")


