Download presentation
Presentation is loading. Please wait.

1
R.S. Reddy Department of Physics, Atmospheric Sciences and General Science

2
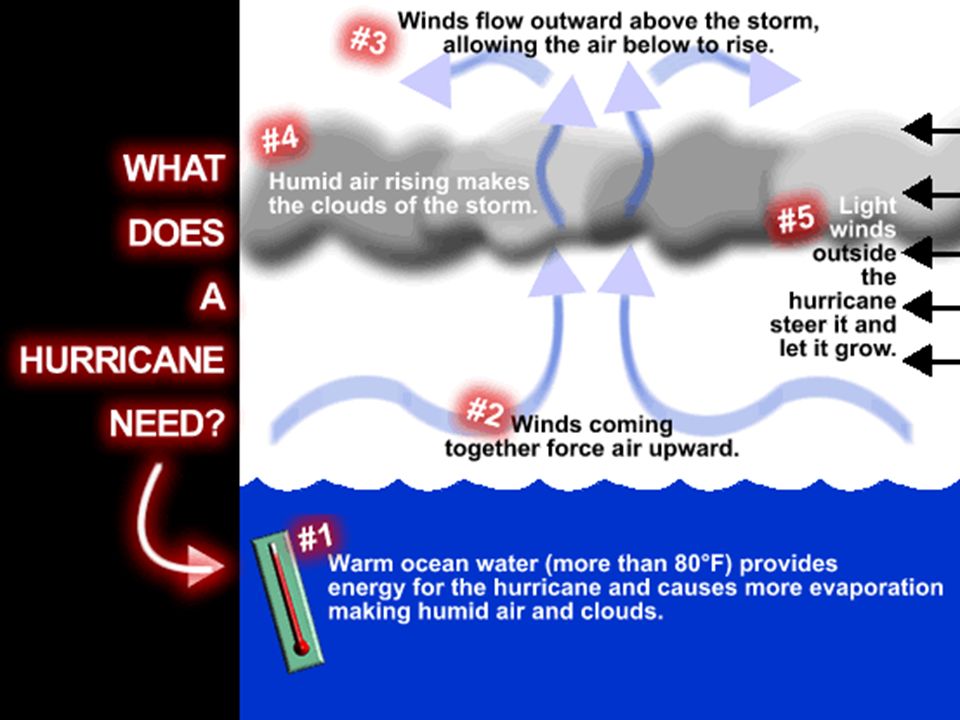
Severe tropical storms Southern Atlantic Ocean, Caribbean Sea, Gulf of Mexico, eastern Pacific Ocean Gather heat and energy – contact with warm ocean waters Evaporation from sea water increases power Rotate counter-clockwise direction Have winds with at least 74 miles per hour

3
Formed from simple complexes of thunder storms Conditions for a hurricane formation: Water must be warmer than 26.5 degrees High relative humidity in the lower and middle troposphere are required Vertical wind shear in a tropical cyclone’s environment is also important

5
Tropical Depression Formed by group of thunderstorms coming together under the right atmospheric condition for a long time Winds near the center 20 – 34 knots

6
Tropical Storm Hurricane is assigned a name at this point The storm becomes more organized and begins to become more circular in shape Winds near the center 35 – 64 knots

7
Hurricane As surface pressures continue to drop, a tropical storm becomes a hurricane wind speeds reach 64 knots A pronounced rotation develops around the center core

8
Earth’s strongest tropical cyclones Distinctive feature is the dark spot found in the middle of the hurricane Region of most intense winds and rainfall – eye wall Hurricanes rated according to wind speed Reaching cooler water or land – rapidly lose intensity

9
Help move heat from warm tropical places to the cooler temperature zone Form between 5 to 15 degrees latitude north and south of the equator Hurricanes happen when the oceans have been warmed during summer months North Atlantic – June 1 – November 30

13
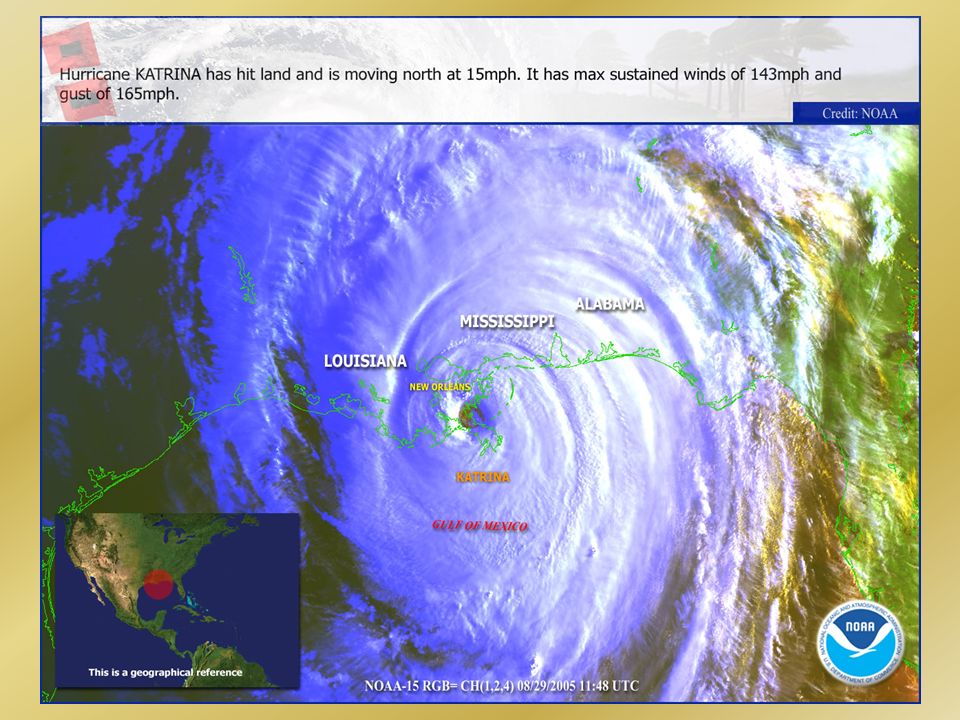
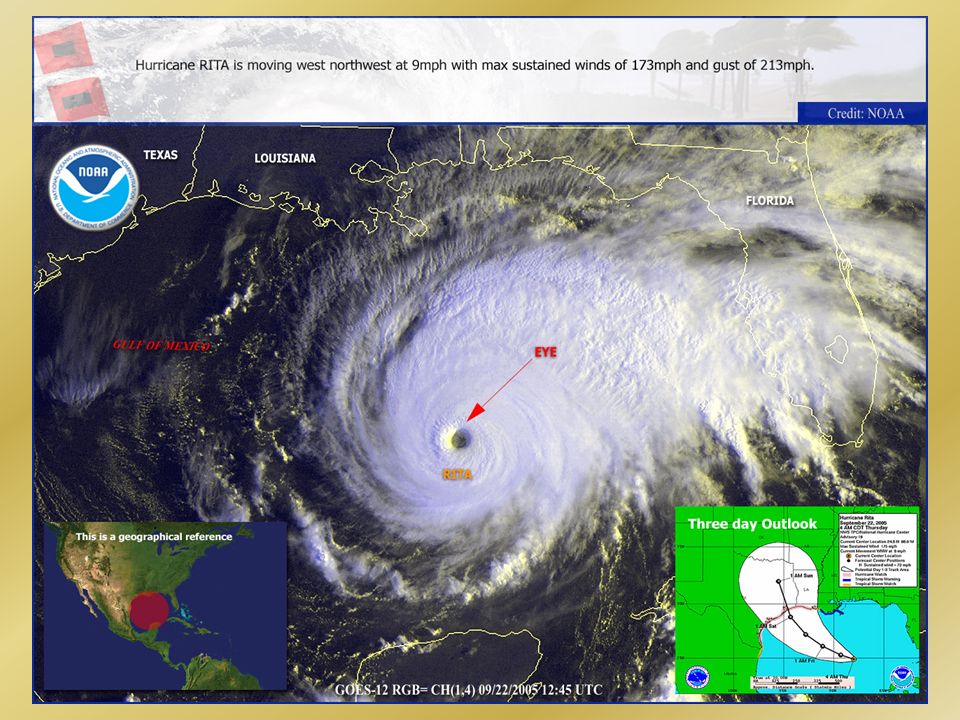
Hurricanes Katrina and Rita Aftermath The effect of Hurricane Katrina on New Orleans was extremely severe, resulting from one of the deadliest natural disasters in U.S. history. By August 30,2005, one day after the Category 4 storm made landfall, 80 percent of the city of New Orleans was flooded, with some parts of the city under 20 feet (6 m) of water. The flood was caused by several levee breaches due to a combination of a powerful storm surge, strong winds and excess water in the bodies of water surrounding the city. The event continues to have major implications for a large segment of the population as well as for the economy of and politics in the entire United States. Areas affected include southern Florida, Louisiana (especially the Greater New Orleans area), Mississippi, Alabama, the western Florida Panhandle, western and north Georgia (hit by tornadoes), the Tennessee Valley and Ohio Valley regions, the eastern Great Lakes region and the length of the western Appalachians. Over 1,100 deaths have been reported in seven states, a number which is expected to rise as casualty reports come in from areas currently inaccessible. Three levees in New Orleans gave way, and 80% of the city was under water at peak flooding, which in some places was 20 to 25 feet (7 or 8 meters) deep[40]. As of September 6, the flood pool had abated to covering 60% of the city. The effects of Hurricane Rita, were not nearly as severe as expected. The storm surge feared in Galveston did not materialize, as the city was well to the west of the storm's center; the strong winds actually flattened the surge, which was only seven feet (2 m), and the seawall was easily able to handle it. The 5 inches (130 mm) of rain expected to fall overnight in New Orleans also did not happen, and the pressure on the levee system was eased. However, local storm surges of 15 to 20 feet (4.5-6.1 m) in southwestern Louisiana were reported, and in from coastal parishes, damage was extensive. Cameron Parish was heavily damaged, with the communities of Holly Beach, Hackberry and Cameron being essentially destroyed. Calcasieu Parish, with the communities of Lake Charles, Sulphur, Westlake and Vinton also suffered heavy damage. In total, it is estimated that well over 2 million customers are without electricity. Currently, the total insured damage is estimated at $4-6 billion, which means the overall damage in coastal areas will likely be between $8-11 billion. Inland flooding could increase those numbers substantially.
 of water. The flood was caused by several levee breaches due to a combination of a powerful storm surge, strong winds and excess water in the bodies of water surrounding the city. The event continues to have major implications for a large segment of the population as well as for the economy of and politics in the entire United States. Areas affected include southern Florida, Louisiana (especially the Greater New Orleans area), Mississippi, Alabama, the western Florida Panhandle, western and north Georgia (hit by tornadoes), the Tennessee Valley and Ohio Valley regions, the eastern Great Lakes region and the length of the western Appalachians. Over 1,100 deaths have been reported in seven states, a number which is expected to rise as casualty reports come in from areas currently inaccessible. Three levees in New Orleans gave way, and 80% of the city was under water at peak flooding, which in some places was 20 to 25 feet (7 or 8 meters) deep[40]. As of September 6, the flood pool had abated to covering 60% of the city. The effects of Hurricane Rita, were not nearly as severe as expected. The storm surge feared in Galveston did not materialize, as the city was well to the west of the storm s center; the strong winds actually flattened the surge, which was only seven feet (2 m), and the seawall was easily able to handle it. The 5 inches (130 mm) of rain expected to fall overnight in New Orleans also did not happen, and the pressure on the levee system was eased. However, local storm surges of 15 to 20 feet ( m) in southwestern Louisiana were reported, and in from coastal parishes, damage was extensive. Cameron Parish was heavily damaged, with the communities of Holly Beach, Hackberry and Cameron being essentially destroyed. Calcasieu Parish, with the communities of Lake Charles, Sulphur, Westlake and Vinton also suffered heavy damage. In total, it is estimated that well over 2 million customers are without electricity. Currently, the total insured damage is estimated at $4-6 billion, which means the overall damage in coastal areas will likely be between $8-11 billion. Inland flooding could increase those numbers substantially..")
14
Scientific Factors influencing Hurricanes The climate change due to increasing amounts of anthropogenic ``greenhouse" gases may result in increased tropical sea surface temperatures (SSTs) and increased tropical rainfall associated with a slightly stronger intertropical convergence zone (ITCZ). Because tropical cyclones extract latent and sensible heat from the warm tropical oceans and release the heat in its upper tropospheric outflow to fuel the storm's spin up, early work of the IPCC expressed concern that warmer SSTs will lead to more frequent and intense hurricanes, typhoons and severe tropical cyclones. Any changes in tropical cyclone activity are intrinsically also tied to large-scale changes in the tropical atmosphere. As a result, SSTs by themselves cannot be considered without corresponding information regarding the moisture and stability in the tropical troposphere. What has been identified in the current climate as being necessary for genesis and maintenance for tropical cyclones (e.g. SSTs of at least 26.5 C - Gray 1968) would change in an enhanced CO 2 world because of possible changes in the moisture or stability. It is quite reasonable that an increase in tropical and subtropical SSTs would be also accompanied by an increase in the SST threshold value needed for cyclogenesis because of compensating changes in the tropospheric moist static stability (Emanuel 1995). In addition to the thermodynamic variables, changes in the tropical dynamics also play a large role in determining changes in tropical cyclone activity. For example, if the vertical wind shear over the tropical North Atlantic moderately increased during the hurricane season in an increased CO 2 world As what is typically seen during El Niño-Southern Oscillation warm phases (El Niño events), then we would most likely see a significant decrease in tropical cyclone activity. This is due to the Atlantic basin having a marginal climatology for tropical cyclone activity because of its sensitivity to changes in vertical wind shear and lack of an oceanic monsoon trough (Gray et al. 1993). In other less marginal tropical cyclone basins, changes in the vertical shear profile typically result in alterations in the preferred location of development (e.g. Nicholls 1979, Chan 1985, Revell and Goulter 1986, and Lander 1994).
 would change in an enhanced CO 2 world because of possible changes in the moisture or stability. It is quite reasonable that an increase in tropical and subtropical SSTs would be also accompanied by an increase in the SST threshold value needed for cyclogenesis because of compensating changes in the tropospheric moist static stability (Emanuel 1995). In addition to the thermodynamic variables, changes in the tropical dynamics also play a large role in determining changes in tropical cyclone activity. For example, if the vertical wind shear over the tropical North Atlantic moderately increased during the hurricane season in an increased CO 2 world As what is typically seen during El Niño-Southern Oscillation warm phases (El Niño events), then we would most likely see a significant decrease in tropical cyclone activity. This is due to the Atlantic basin having a marginal climatology for tropical cyclone activity because of its sensitivity to changes in vertical wind shear and lack of an oceanic monsoon trough (Gray et al. 1993). In other less marginal tropical cyclone basins, changes in the vertical shear profile typically result in alterations in the preferred location of development (e.g. Nicholls 1979, Chan 1985, Revell and Goulter 1986, and Lander 1994)..")
15
Global Warming and Development of Hurricanes Global Warming and Development of Hurricanes Comparison of simulated hurricane intensities The strongest hurricanes in the present climate may be upstaged by even more intense hurricanes over the next century as the earth's climate is warmed by increasing levels of greenhouse gases in the atmosphere. Although we cannot say at present whether more or fewer hurricane will occur in the future with global warming, the hurricanes that do occur near the end of the 21st century are expected to be stronger and have significantly more intense rainfall than under present day climate conditions. This expectation (Figure) is based on an anticipated enhancement of energy available to the storms due to higher tropical sea surface temperatures. In this study hurricanes were simulated for a climate warming as projected to occur with a substantial build-up of atmospheric CO2. An increase of intensity of about one-half category on the Saffir-Simpson scale was simulated for an 80 year build-up of atmospheric CO2 at 1%/yr (compounded).
 is based on an anticipated enhancement of energy available to the storms due to higher tropical sea surface temperatures. In this study hurricanes were simulated for a climate warming as projected to occur with a substantial build-up of atmospheric CO2. An increase of intensity of about one-half category on the Saffir-Simpson scale was simulated for an 80 year build-up of atmospheric CO2 at 1%/yr (compounded)..")
16
Global Warming and Development of Hurricanes Hurricanes have always bedeviled the Gulf Coast states, but global warming is making matters worse. Sea level is rising and will continue to rise as oceans warm and glaciers melt. Rising sea levels means higher storm surges, even from relatively minor storms, causing coastal flooding and erosion and damaging coastal properties. In a distressing new development, scientific evidence now suggests a link between hurricane strength and duration and global warming. Understanding the relationship between hurricanes and global warming is essential if we are to preserve healthy and prosperous coastal communities for ourselves and our children. Recent research has found that storm intensity and duration increases as global warming emissions increase in our atmosphere. Rising sea levels, also caused in part by rising global temperatures, intensify storm damage along coasts. For hurricanes to occur, surface ocean temperatures must exceed 80 degrees Fahrenheit. The warmer the ocean, the greater the potential for stronger storms. More destructive hurricanes not only inflict billions of dollars in damage to communities and businesses, but also put thousands of human lives at risk.

17
La Niña and El Niño La Niña and El Niño are the popular terms for alternating cold and warm phases of ocean temperatures in the eastern and central Pacific Ocean off the coast of South America (Glantz 1999). The entire cycle is referred to as the El Niño-Southern Oscillation (ENSO) and has gained prominence over the past year with the occurrence of one of the strongest El Niño events on record (Bell and Halpert 1998). Reliable predictions of the onset and development of various phases of the ENSO cycle and their associated worldwide climate anomalies (or teleconnections; see Glantz et al. 1991) hold the promise of benefits to decision makers with the ability to use them effectively. To date, the scientific community generally predicts sea surface temperatures in one of several regions of the Pacific and then forecasts general weather tendencies based on documented relationships from climatological records. This process makes the connection of ENSO forecasts and societal benefits difficult for most decision makers. Consequently, few decision makers are able to directly use information on Pacific sea surface temperatures to their benefit (Latif et al. 1998). This note discusses the relationship of sea surface temperatures and Atlantic hurricane damages in the United States, and strongly suggests that a reliable forecast of Pacific sea surface temperatures is of potential value to decision makers capable of hedging with probabalistic information.
 and has gained prominence over the past year with the occurrence of one of the strongest El Niño events on record (Bell and Halpert 1998). Reliable predictions of the onset and development of various phases of the ENSO cycle and their associated worldwide climate anomalies (or teleconnections; see Glantz et al. 1991) hold the promise of benefits to decision makers with the ability to use them effectively. To date, the scientific community generally predicts sea surface temperatures in one of several regions of the Pacific and then forecasts general weather tendencies based on documented relationships from climatological records. This process makes the connection of ENSO forecasts and societal benefits difficult for most decision makers. Consequently, few decision makers are able to directly use information on Pacific sea surface temperatures to their benefit (Latif et al. 1998). This note discusses the relationship of sea surface temperatures and Atlantic hurricane damages in the United States, and strongly suggests that a reliable forecast of Pacific sea surface temperatures is of potential value to decision makers capable of hedging with probabalistic information..")
18
El Niño-Southern Oscillation and Atlantic Hurricanes While there is general agreement in the scientific community as to most El Niño and La Niña events of this century, definitions of El Niño and La Niña differ (Trenberth 1997; Glantz 1999). The analysis uses the definitions of El Niño and La Niña similar to those of Trenberth (1997). That is, an El Niño (La Niña) is said to occur when sea surface temperatures in the region of the Pacific known as Niño 3.4 (5 N-5 S and 120 -170 W; Figure 1a) are greater than or equal to 0.4 degrees C warmer (cooler) than the long-term average during August, September, and October (ASO). These months are of particular importance to the Atlantic hurricane season as 95% of Saffir/Simpson Category 3, 4, and 5 hurricane activity occurs during August to October (Landsea 1993). Figure 1b shows ASO Niño 3.4 temperature anomalies during 1925-1997. The sea-surface temperature dataset is a reconstruction of historical observations by Kaplan et al. (1999) to 1991, appended with data from Reynolds and Smith (1994) using a methodology that minimizes inhomogeneities between the two datasets ( Landsea et al. 1999). If months other than ASO or regions other than Niño 3.4 are utilized for studies of other climate teleconnections (such as U.S. wintertime temperatures and precipitation), then the selection of El Niño and La Ni&ntild e;a e;a years will vary. For the 73-year period examined in this paper (limited by the economic data discussed below), this definition results in 22 El Niño years, 29 neutral years, and 22 La Niña years (Table 1).
. That is, an El Niño (La Niña) is said to occur when sea surface temperatures in the region of the Pacific known as Niño 3.4 (5 N-5 S and W; Figure 1a) are greater than or equal to 0.4 degrees C warmer (cooler) than the long-term average during August, September, and October (ASO). These months are of particular importance to the Atlantic hurricane season as 95% of Saffir/Simpson Category 3, 4, and 5 hurricane activity occurs during August to October (Landsea 1993). Figure 1b shows ASO Niño 3.4 temperature anomalies during The sea-surface temperature dataset is a reconstruction of historical observations by Kaplan et al. (1999) to 1991, appended with data from Reynolds and Smith (1994) using a methodology that minimizes inhomogeneities between the two datasets ( Landsea et al. 1999). If months other than ASO or regions other than Niño 3.4 are utilized for studies of other climate teleconnections (such as U.S. wintertime temperatures and precipitation), then the selection of El Niño and La Ni&ntild e;a e;a years will vary. For the 73-year period examined in this paper (limited by the economic data discussed below), this definition results in 22 El Niño years, 29 neutral years, and 22 La Niña years (Table 1)..")
19
170 Location of the Niño 3.4 sea surface temperature region (5 N-5 S, 120- 170 W). Also shown are the Niño 1, 2, 3, and 4 regions;

20
August-October (ASO) Niño 3.4 sea surface temperature anomalies for the period 1925-1997. Anomalies are from a 1950-1979 base period. Values equaling or exceeding +0.4 C (-0.4 C) are shown in red (blue) and termed "El Niñ o" ("La Niña") years. Neutral years are in black.
 are shown in red (blue) and termed El Niñ o ( La Niña ) years. Neutral years are in black..")
21
El Nino and Atlantic Hurricanes El Niño (Warm Phase) involves an anomalous warming of the eastern tropical Pacific Ocean. Here we base the definition of an El Niño event as developed by the Japan Meteorological Agency (JMA Atlas, 1991) rather than the Southern Oscillation Index, which is relatively noisy. It is well-accepted that El Niño reduces hurricane activity in the Atlantic Basin. Gray (1984) uses physical processes that accompany El Niño to describe reduced hurricane activity. Gray (1984) also finds that of the 54 major hurricanes striking the United States coast during 1900- 83, only four occurred during the 16 El Niño years in contrast to 50 making landfall during the 68 non-El Niño years. This is a rate of 0.25 major hurricanes per year during El Niño events and 0.74 during non-El Niño years, almost a three to one ratio. Richards and O'Brien (1996) showed that the probability of 2 or more hurricanes making landfall on the U.S. coast during El Niño is 21%, while the probability of 2 or more U.S. hurricanes during neutral conditions is 46%. However, the data and methodology used in Richards and O'Brien (1996) work are limited. We analyze the frequency of hurricanes making landfall in the United States from 1900-1997 for the phases of the El Niño/Southern Oscillation (ENSO). Corrected U.S. hurricane data are used, and tropical storms are not considered in this study. The analysis shows that during an El Niño year, the probability of 2 or more hurricanes making landfall in the U.S. is 28%. The analysis further determines that the probability of 2 or more U.S. hurricanes during the other two phases is larger: 48% during neutral years and 66% during El Viejo. Also, we determine the range of these strike probabilities for El Niño and El Viejo. Strike probabilities of major U.S. Hurricanes during each ENSO phase are also considered.
 rather than the Southern Oscillation Index, which is relatively noisy. It is well-accepted that El Niño reduces hurricane activity in the Atlantic Basin. Gray (1984) uses physical processes that accompany El Niño to describe reduced hurricane activity. Gray (1984) also finds that of the 54 major hurricanes striking the United States coast during , only four occurred during the 16 El Niño years in contrast to 50 making landfall during the 68 non-El Niño years. This is a rate of 0.25 major hurricanes per year during El Niño events and 0.74 during non-El Niño years, almost a three to one ratio. Richards and O Brien (1996) showed that the probability of 2 or more hurricanes making landfall on the U.S. coast during El Niño is 21%, while the probability of 2 or more U.S. hurricanes during neutral conditions is 46%. However, the data and methodology used in Richards and O Brien (1996) work are limited. We analyze the frequency of hurricanes making landfall in the United States from for the phases of the El Niño/Southern Oscillation (ENSO). Corrected U.S. hurricane data are used, and tropical storms are not considered in this study. The analysis shows that during an El Niño year, the probability of 2 or more hurricanes making landfall in the U.S. is 28%. The analysis further determines that the probability of 2 or more U.S. hurricanes during the other two phases is larger: 48% during neutral years and 66% during El Viejo. Also, we determine the range of these strike probabilities for El Niño and El Viejo. Strike probabilities of major U.S. Hurricanes during each ENSO phase are also considered..")
22
Hurricanes - http://www.ucar.edu/educ_outreach/webweather/hurricane2.html http://www.ucar.edu/educ_outreach/webweather/hurricane2.html Hurricanes - http://www.fema.gov/kids/hurr.htmhttp://www.fema.gov/kids/hurr.htm Things to know - http://www.fema.gov/kids/knw_hur.htmhttp://www.fema.gov/kids/knw_hur.htm Adios, Hurricane - http://science.nasa.gov/newhome/headlines/essd01sep99_1.htm

Similar presentations


 and the Tropic of Capricorn (23.5S) The weather is very different.>")


 Physical Oceanography>")


