Download presentation
Presentation is loading. Please wait.

1
Elliot DeHaan, MD Clinical Assistant Professor Division of Infectious Diseases/S.T.A.R. Program SUNY Downstate Medical Center October 24, 2014

2
Introduce 5 classes of ARVs & origins of HAART Review ARV regimens for naïve patients Review “switch” regimens Review ARV combinations in experienced patients Cases of treatment in primary care settings

3
Attachment fusion Budding Reverse transcription Maturation Integration Uncoating Transcription, translation Assembly http://www.clinicaloptions.com/HIV.aspx

4
NRTIs Chain terminators, active site of the RT enzyme NNRTIs Confers allosteric change of the RT enzyme PIs Inhibits viral protease from cleaving polypeptide INSTIs Inhibits integration of proviral DNA into cell genome Entry inhibitors Enfuvirtide-fusion inhibitor Maraviroc- CCR5 antagonist

5
Decreased disease progression; improved CD4 on HAART Hammer SM et al. N Eng J Med 1997; 337: 725-733

6
28/31 patients (90%) suppressed to <500 copies/mL Gulick RM et al. N Eng J Med 1997; 337: 734-739
 suppressed to <500 copies/mL Gulick RM et al. N Eng J Med 1997; 337:")
7
Introduce 5 classes of ARVs & origins of HAART Review ARV regimens for naïve patients Review “switch” regimens (CAUTION!) Review ARV combinations in experienced patients Cases of treatment in primary care settings
 Review ARV combinations in experienced patients Cases of treatment in primary care settings")
8
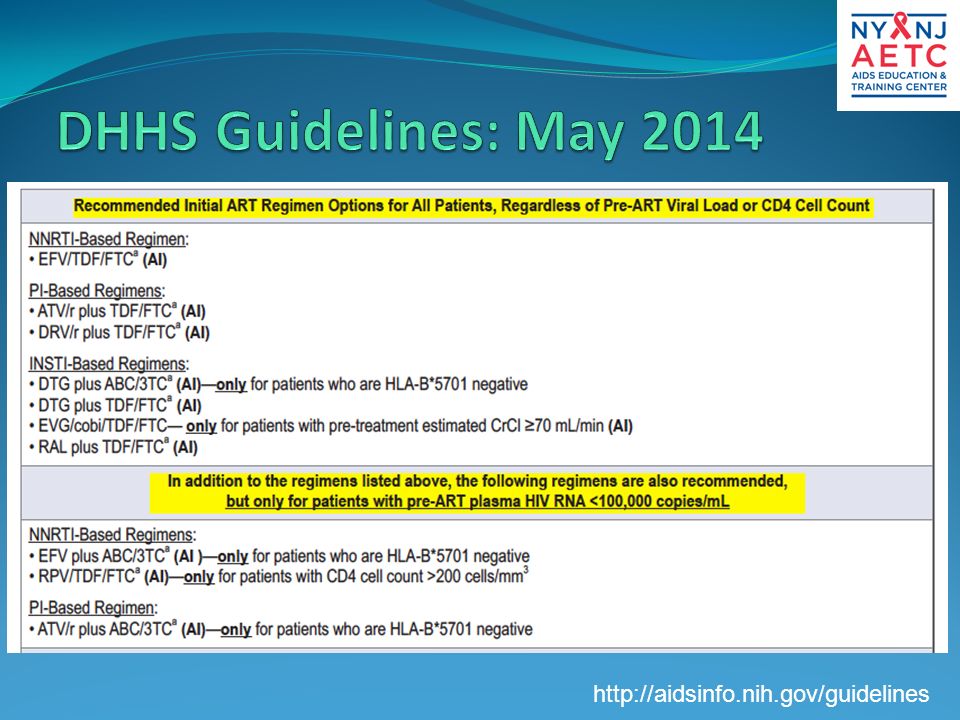
http://aidsinfo.nih.gov/guidelines
9
ABC-3TC arms showed increased risk of virologic failure after early unblinding in patients with viral loads >100K Daar ES et al. Ann Int Med 2011; 154: 445-456

10
Sax PE et al. N Eng J Med 2009; 361: 2230-40

11
HIV-1 RNA < 50 copies/mL (%) By Baseline CD4+ Count (cells/mm 3 ) 84 70 ≤ 100K Rilpivirine Efavirenz 80 75 Cohen CJ, et al. AIDS. 2013;27:939-950. > 100K 56 71 < 50 Rilpivirine Efavirenz 69 75 50 - < 200 81 79 85 79 200 - < 350≥ 350 By Baseline HIV-1 RNA (copies/mL) 0 20 40 60 80 100 0 20 40 60 80 100 n = 368 329 n = 318 353 n = 34 36 194 175 313 307 144 164
 n = n = n =")
12
Randomized, double-blind (through 5 yrs), placebo-controlled, phase III trial Primary endpoint: HIV-1 RNA < 50 copies/mL at Wk 48 HIV-infected, treatment-naive patients with HIV-1 RNA > 5000 copies/mL and no resistance to EFV, TDF, or FTC (N = 563) Efavirenz 600 mg QHS + TDF/FTC (n = 282) Raltegravir 400 mg BID + TDF/FTC (n = 281) Lennox J, et al. Lancet. 2009;374:796-806. Stratified by HIV-1 RNA (> vs ≤ 50,000 copies/mL) and viral hepatitis status
 and viral hepatitis status.")
13
RAL noninferior to EFV in HIV-1 RNA < 50 c/mL at Wk 48 (primary endpoint; ITT, NC = F analysis); superior from Wk 192 Rockstroh J, et al. J Acquir Immune Defic Syndr. 2013;63:77-85. 281 282 100 80 60 40 20 0 HIV-1 RNA < 50 c/mL (%) 04872 96120144 Wks RAL EFV Pts at Risk, n 281 282 276 282 280 281 281 282 277 281 280 281 86 82 81 79 75 69 281 282 192 76 67 ∆: +9.5% (95% CI: 1.7% to 17.3%; noninferiority P <.001) 24012216 71 61 277 282279 24 279 282 168 281 282
 Wks RAL EFV Pts at Risk, n ∆: +9.5% (95% CI: 1.7% to 17.3%; noninferiority P <.001)")
14
Efficacy as good as or better than EFV in all baseline subgroups tested CD4+ cell count at Wk 240: +374 (RAL) vs +312 (EFV) RAL associated with – Fewer CNS adverse events (39.1% vs 64.2%; P <.001) – Fewer drug-related clinical adverse events (52.0% vs 80.1%; P <.001) – Fewer discontinuations due to adverse events (5% vs 9%) Rockstroh J, et al. J Acquir Immune Defic Syndr. 2013;63:77-85 plus Supplemental Digital Content. VF and Resistance at Wk 240 RAL (n = 281) EFV (n = 282) VF, n (%)55 (19.6)59 (20.9) Resistance data available, n 2320 INSTI or NNRTI mutations only, n 17 NRTI mutations only, n 32 NRTI + (RAL or EFV) resistance mutations, n 33
 EFV (n = 282) VF, n (%)55 (19.6)59 (20.9) Resistance data available, n 2320 INSTI or NNRTI mutations only, n 17 NRTI mutations only, n 32 NRTI + (RAL or EFV) resistance mutations, n 33.")
15
Primary endpoints – Virologic failure: time to HIV-1 RNA > 1000 c/mL (at Wk 16 or before Wk 24) or > 200 c/mL (at or after Wk 24) – Tolerability failure: time to discontinuation of randomized component for toxicity Composite endpoint: the earlier occurrence of either VF or TF in a given participant Switch of regimens allowed for tolerability Landovitz R, et al. CROI 2014. Abstract 85. ART-naive patients with HIV-1 RNA ≥ 1000 c/mL (N = 1809) ATV/RTV 300/100 mg QD + TDF/FTC (n = 605) RAL 400 mg BID + TDF/FTC (n = 603) Stratified by HIV-1 RNA < or ≥ 100,000 c/mL, participation in metabolic substudy, CV risk DRV/RTV 800/100 mg QD + TDF/FTC (n = 601) Wk 96 after last patient enrolled
 ATV/RTV 300/100 mg QD + TDF/FTC (n = 605) RAL 400 mg BID + TDF/FTC (n = 603) Stratified by HIV-1 RNA < or ≥ 100,000 c/mL, participation in metabolic substudy, CV risk DRV/RTV 800/100 mg QD + TDF/FTC (n = 601) Wk 96 after last patient enrolled.")
16
Regimens equivalent in time to VF Landovitz R, et al. CROI 2014. Abstract 85. Reproduced with permission. Significantly greater incidence of treatment failure with ATV/RTV vs RAL or DRV/RTV –In part due to high proportion of pts with hyperbilirubinemia Considering both efficacy and tolerability, RAL superior to either boosted PI DRV/RTV superior to ATV/RTV Virologic Failure Tolerability FailureComposite Endpoint Difference in 96-Wk Cumulative Incidence (97.5% CI) 0-10 1020 ATV/RTV vs RAL 3.4% (-0.7 to 7.4) DRV/RTV vs RAL 5.6% (1.3 -9.9) ATV/RTV vs DRV/RTV -2.2% (-6.7 to 2.3) 0-10 1020 ATVRTV vs RAL 15% (10-20) DRV/RTV vs RAL 7.5% (3.2-12.0) ATV/RTV vs DRV/RTV 7.5% (2.3-13.0) Favors RAL Favors DRV/RTV Favors RAL 0-10 1020 ATV/RTV vs RAL 13% (9.4-16.0) DRV/RTV vs RAL 3.6% (1.4-5.8) ATV/RTV vs DRV/RTV 9.2% (5.5-13.0) Favors RAL Favors DRV/RTV
 ATV/RTV vs RAL 3.4% (-0.7 to 7.4) DRV/RTV vs RAL 5.6% ( ) ATV/RTV vs DRV/RTV -2.2% (-6.7 to 2.3) ATVRTV vs RAL 15% (10-20) DRV/RTV vs RAL 7.5% ( ) ATV/RTV vs DRV/RTV 7.5% ( ) Favors RAL Favors DRV/RTV Favors RAL ATV/RTV vs RAL 13% ( ) DRV/RTV vs RAL 3.6% ( ) ATV/RTV vs DRV/RTV 9.2% ( ) Favors RAL Favors DRV/RTV.")
17
89% In ITT analysis with ART changes allowed (per protocol), regimens similar in virologic efficacy at Wk 96 and through Wk 144 In ITT analysis when change = failure (Snapshot), RAL superior to both boosted PIs at Wk 96 and DRV/RTV superior to ATV/RTV at Wks 96 and 144 Similar mean change in CD4+ count across arms ATV/RTV (+284); RAL (+288) DRV/RTV (+256) cells/mm 3 Landovitz R, et al. CROI 2014. Abstract 85. Reproduced with permission. 1.0 Proportion With HIV-1 RNA ≤ 50 c/mL 0.8 0.6 0.4 0.2 0 ITT, Regardless of ART Change 0 24 48 64 80 96 120144 1.0 0.8 0.6 0.4 0.2 0 ITT, NC = Failure (Snapshot) RAL DRV/RTV ATV/RTV Study Wk 0 24 4864 80 96 120 144 88% 94% 63% 73% 80% RAL DRV/RTV ATV/RTV
 RAL DRV/RTV ATV/RTV Study Wk % 94% 63% 73% 80% RAL DRV/RTV ATV/RTV.")
18
Randomized, noninferiority phase III trial of RAL 800 mg QD (n = 382) vs RAL 400 mg BID (n = 389), both with TDF/FTC [1] RAL QD inferior to RAL BID at Wk 48 in ITT (NC = F) analysis Lower RAL trough levels associated with higher risk of failure in QD arm but not in BID arm More resistance at failure in QD arm PK studies of 2 new RAL formulations administered as 1200-mg once daily showed promise in healthy patients [2] 1. Eron J, et al. Lancet Infect Dis. 2011;11:907-915. 2. Krishna R, et al. EACS 2013, Abstract PE10/17. HIV-1 RNA < 50 c/mL (NC = F) *Failure included both failure to suppress and rebounders. Most patients with VF and RAL resistance had ≥ 2 mutations associated with resistance to RAL. Parameter, nRAL QD (n = 382) RAL BID (n = 388) Pts with VF* and HIV-1 RNA > 400 c/mL 3016 Resistance data available2711 FTC resistance only112 Integrase inhibitor and FTC resistance 92 No evidence of resistance77 83 89 0 20 40 60 80 100 RAL 800 mg QD (n = 382) RAL 400 mg BID (n = 389) 318/ 382 343/ 389 ∆: -5.7 (95% CI: -10.7 to -0.83; P for noninferiority =.044) Wk 48
![ Randomized, noninferiority phase III trial of RAL 800 mg QD (n = 382) vs RAL 400 mg BID (n = 389), both with TDF/FTC [1] RAL QD inferior to RAL BID at Wk 48 in ITT (NC = F) analysis Lower RAL trough levels associated with higher risk of failure in QD arm but not in BID arm More resistance at failure in QD arm PK studies of 2 new RAL formulations administered as 1200-mg once daily showed promise in healthy patients [2] 1.](http://images.slideplayer.com/25/7658252/slides/slide_18.jpg "Eron J, et al. Lancet Infect Dis. 2011;11: Krishna R, et al. EACS 2013, Abstract PE10/17. HIV-1 RNA < 50 c/mL (NC = F) *Failure included both failure to suppress and rebounders. Most patients with VF and RAL resistance had ≥ 2 mutations associated with resistance to RAL. Parameter, nRAL QD (n = 382) RAL BID (n = 388) Pts with VF* and HIV-1 RNA > 400 c/mL 3016 Resistance data available2711 FTC resistance only112 Integrase inhibitor and FTC resistance 92 No evidence of resistance RAL 800 mg QD (n = 382) RAL 400 mg BID (n = 389) 318/ / 389 ∆: -5.7 (95% CI: to -0.83; P for noninferiority =.044) Wk 48.")
19
Randomized, double-blind, active-controlled phase III studies Primary endpoint: HIV-1 RNA < 50 copies/mL at Wk 48 1. Sax P, et al. Lancet. 2012;379:2439-2448. 2. DeJesus E, et al. Lancet. 2012;379:2429-2438. Treatment naive; HIV-1 RNA ≥ 5000 copies/mL; any CD4+ cell count; susceptible to TDF, FTC, and EFV, or ATV; eGFR ≥ 70 mL/min Study 102 [1] (N = 700) Study 103 [2] (N = 708) EVG/COBI/TDF/FTC QD (n = 348) EFV/FTC/TDF QD (n = 352) EVG/COBI/TDF/FTC QD (n = 353) ATV/RTV + TDF/FTC QD (n = 355)
 Study 103 [2] (N = 708) EVG/COBI/TDF/FTC QD (n = 348) EFV/FTC/TDF QD (n = 352) EVG/COBI/TDF/FTC QD (n = 353) ATV/RTV + TDF/FTC QD (n = 355).")
20
EVG/COBI arm noninferior to EFV arm at Wk 48 primary endpoint [1] and through Wk 144 [2,3] – Results consistent across subgroups: BL HIV-1 RNA, CD4+ cell count, age, sex, race – Treatment-related study d/c: 6% in EVG/COBI arm vs 7% in EFV arm at Wk 144 VF: 7% in EVG/COBI arm and 10% in EFV arm at Wk 144 Similar CD4+ cell count increase at Wk 144: – +321 cells/mm 3 (EVG/COBI) vs +300 cells/mm 3 (EFV) 1. Sax PE, et al. Lancet. 2012;379:2439-2448. 2. Zolopa A, et al. J Acquir Immune Defic Syndr. 2013;63:96- 100. 3. Wohl D, et al. ICAAC 2013. Abstract H-672a. Wk 48 Wk 144 EVG/COBI/TDF/FTC (n = 348) EFV/TDF/FTC (n = 352) 80 75 0 20 40 60 80 100 HIV-1 RNA < 50 copies/mL (%) 88 84 Δ: 3.6% (-1.6 to 8.8) Δ: 4.9% (1.3 to 11.1) 84 82 Wk 96 Δ: 2.7% (-2.9 to 8.3)
![ EVG/COBI arm noninferior to EFV arm at Wk 48 primary endpoint [1] and through Wk 144 [2,3] – Results consistent across subgroups: BL HIV-1 RNA, CD4+ cell count, age, sex, race – Treatment-related study d/c: 6% in EVG/COBI arm vs 7% in EFV arm at Wk 144 VF: 7% in EVG/COBI arm and 10% in EFV arm at Wk 144 Similar CD4+ cell count increase at Wk 144: – +321 cells/mm 3 (EVG/COBI) vs +300 cells/mm 3 (EFV) 1.](http://images.slideplayer.com/25/7658252/slides/slide_20.jpg "Sax PE, et al. Lancet. 2012;379: Zolopa A, et al. J Acquir Immune Defic Syndr. 2013;63: Wohl D, et al. ICAAC Abstract H-672a. Wk 48 Wk 144 EVG/COBI/TDF/FTC (n = 348) EFV/TDF/FTC (n = 352) HIV-1 RNA < 50 copies/mL (%) Δ: 3.6% (-1.6 to 8.8) Δ: 4.9% (1.3 to 11.1) Wk 96 Δ: 2.7% (-2.9 to 8.3).")
21
EVG/COBI arm noninferior to ATV/RTV arm at Wk 48 primary endpoint [1] and through Wk 144 [2,3] – Results consistent across subgroups: BL HIV-1 RNA, CD4+ count, adherence, age, sex, race Treatment-related study d/c: 6% in EVG/COBI arm vs 9% in ATV/RTV arm at Wk 144 VF: 8% in EVG/COBI arm vs 7% in ATV/RTV arm at Wk 144 Similar CD4+ cell count increase at Wk 144: + 280 cells/mm 3 (EVG/COBI) vs +293 cells/mm 3 (ATV/RTV ) 1. De Jesus E, et al. Lancet. 2012;379:2429-2438. 2. Rockstroh J, et al. J Acquir Immune Defic Syndr. 2013;62:483-486. 3. Clumeck N, et al. EACS 2013. Abstract LBPS7/2. EVG/COBI/TDF/FTC (n = 353) ATV/RTV + TDF/FTC (n = 355) Δ: 3.0% (-1.9 to 7.8) Δ: 1.1% (-4.5 to 6.7) Wk 48 Wk 144 78 75 0 20 40 60 80 100 HIV-1 RNA < 50 copies/mL (%) 90 87 Δ: 3.1% (-3.2 to 9.4) 83 82 Wk 96
![ EVG/COBI arm noninferior to ATV/RTV arm at Wk 48 primary endpoint [1] and through Wk 144 [2,3] – Results consistent across subgroups: BL HIV-1 RNA, CD4+ count, adherence, age, sex, race Treatment-related study d/c: 6% in EVG/COBI arm vs 9% in ATV/RTV arm at Wk 144 VF: 8% in EVG/COBI arm vs 7% in ATV/RTV arm at Wk 144 Similar CD4+ cell count increase at Wk 144: cells/mm 3 (EVG/COBI) vs +293 cells/mm 3 (ATV/RTV ) 1.](http://images.slideplayer.com/25/7658252/slides/slide_21.jpg "De Jesus E, et al. Lancet. 2012;379: Rockstroh J, et al. J Acquir Immune Defic Syndr. 2013;62: Clumeck N, et al. EACS Abstract LBPS7/2. EVG/COBI/TDF/FTC (n = 353) ATV/RTV + TDF/FTC (n = 355) Δ: 3.0% (-1.9 to 7.8) Δ: 1.1% (-4.5 to 6.7) Wk 48 Wk HIV-1 RNA < 50 copies/mL (%) Δ: 3.1% (-3.2 to 9.4) Wk 96.")
22
Randomized, noninferiority phase III studies Primary endpoint: HIV-1 RNA < 50 copies/mL at Wk 48 ART-naive pts VL ≥ 1000 c/mL (N = 822) DTG 50 mg QD + 2 NRTIs* (n = 411) RAL 400 mg BID + 2 NRTIs* (n = 411) *Investigator-selected NRTI backbone: either TDF/FTC or ABC/3TC. ART-naive pts VL ≥ 1000 c/mL HLA-B*5701-neg CrCL > 50 mL/min (N = 833) DTG 50 mg QD + ABC/3TC QD (n = 414) EFV/TDF/FTC QD (n = 419) SPRING-2 [1] (active controlled) SINGLE [2] (placebo controlled) DTG 50 mg QD + 2 NRTIs* (n = 242) DRV/RTV 800/100 mg QD + 2 NRTIs* (n = 242) ART-naive pts VL ≥ 1000 c/mL (N = 484) FLAMINGO [3] (open label) 1. Raffi F, et al. Lancet. 2013;381:735-743. 2. Walmsley S, et al. N Engl J Med. 2013;369:1807-1818. 3. Feinberg J, et al. ICAAC 2013. Abstract H1464a.
 DTG 50 mg QD + ABC/3TC QD (n = 414) EFV/TDF/FTC QD (n = 419) SPRING-2 [1] (active controlled) SINGLE [2] (placebo controlled) DTG 50 mg QD + 2 NRTIs* (n = 242) DRV/RTV 800/100 mg QD + 2 NRTIs* (n = 242) ART-naive pts VL ≥ 1000 c/mL (N = 484) FLAMINGO [3] (open label) 1. Raffi F, et al. Lancet. 2013;381: Walmsley S, et al. N Engl J Med. 2013;369: Feinberg J, et al. ICAAC Abstract H1464a..")
23
DTG noninferior to RAL at both Wk 48 primary endpoint [1] and Wk 96 [2] Treatment-related study d/c: 2% in each arm at Wk 96 VF at Wk 96 [2] : 5% (22/411) in DTG arm and 7% (29/411) in RAL arm Similar CD4+ cell count increase at Wk 96: – +276 cells/mm 3 (DTG) vs +264 cells/mm 3 (RAL) HIV-1 RNA < 50 copies/mL (%) 88 85 DTG 50 mg QD (n = 411) RAL 400 mg BID (n = 411) 0 20 40 60 80 100 81 76 Wk 48 Wk 96 1. Raffi F, et al. Lancet. 2013;381:735-743. 2. Raffi F, et al. IAS 2013. Abstract TULBPE17. 361/ 411 351/ 411 333/ 411 314/ 411 Δ: 4.4% (-1.1% to 10.0%) Δ: 2.5% (-2.2% to 7.1%)
![ DTG noninferior to RAL at both Wk 48 primary endpoint [1] and Wk 96 [2] Treatment-related study d/c: 2% in each arm at Wk 96 VF at Wk 96 [2] : 5% (22/411) in DTG arm and 7% (29/411) in RAL arm Similar CD4+ cell count increase at Wk 96: – +276 cells/mm 3 (DTG) vs +264 cells/mm 3 (RAL) HIV-1 RNA < 50 copies/mL (%) DTG 50 mg QD (n = 411) RAL 400 mg BID (n = 411) Wk 48 Wk 96 1.](http://images.slideplayer.com/25/7658252/slides/slide_23.jpg "Raffi F, et al. Lancet. 2013;381: Raffi F, et al. IAS Abstract TULBPE / / / / 411 Δ: 4.4% (-1.1% to 10.0%) Δ: 2.5% (-2.2% to 7.1%).")
24
DTG superior to EFV at Wk 48 primary efficacy endpoint Treatment-related study d/c: 2% in DTG arm vs 10% in EFV arm VF at Wk 48: 4% (18/414) in DTG arm and 4% (17/419) in EFV arm CD4+ cell count increase at Wk 48 greater with DTG: – +267 cells/mm 3 (DTG) vs +208 cells/mm 3 (EFV) (P <.001) HIV-1 RNA < 50 c/mL at Wk 48 (%) 88 81 Δ +7.4% (95% CI +2.5% to +12.3%; P =.003) Walmsley S, et al. N Engl J Med. 2013;369:1807-1818. DTG 50 mg + ABC/3TC QD EFV/TDF/ FTC QD 0 20 40 60 80 100 364/ 414 340/ 419

25
DTG superior to DRV/RTV at Wk 48 primary efficacy endpoint – Treatment-related study d/c: 2% in DTG arm vs 4% in DRV/RTV arm VF at Wk 48: < 1% (n = 2) in each arm Similar CD4+ cell count increase at Wk 48: – +210 cells/mm³ in each arm HIV-1 RNA < 50 c/mL at Wk 48 (%) 90 83 Δ +7.1% (95% CI: +0.9% to +13.2%; P =.025) Feinberg J, et al. ICAAC 2013. Abstract H1464a. DTG 50 mg QD + NRTIs DRV/RTV 800/100 mg QD + NRTIs 217/ 242 200/ 242 0 20 40 60 80 100

26
Introduce 5 classes of ARVs and origins of HAART Review ARV regimens for naïve patients Review “switch” regimens (CAUTION!) Review ARV combinations in experienced patients Cases of treatment in primary care settings
 Review ARV combinations in experienced patients Cases of treatment in primary care settings")
27
SWITCHMRK-1 and -2 [1] – Switching to RAL inferior to remaining on LPV/RTV-based regimen in pts with HIV-1 RNA 3 mos, particularly among those with previous VF – TC, non–HDL-C, and TG improved in switch pts SPIRAL [2] – Switching from to RAL noninferior to remaining on boosted PI-based regimens through Wk 48 in pts with HIV-1 RNA < 50 c/mL for ≥ 6 mos Switching to RAL significantly improved lipids and TC:HDL-C ratio EASIER/ANRS 138 [3] – Switch from ENF to RAL regimens maintained virologic suppression through Wk 48 in patients with multidrug resistance and HIV-1 RNA < 400 c/mL for ≥ 3 mos 1. Eron J, et al. Lancet. 2010;375:396-407. 2. Martinez E, et al. AIDS. 2010;24:1697-1707. 3. Gallien S, et al. J Antimicrob Chemother. 2011;66:2099-2106.
![ SWITCHMRK-1 and -2 [1] – Switching to RAL inferior to remaining on LPV/RTV-based regimen in pts with HIV-1 RNA 3 mos, particularly among those with previous VF – TC, non–HDL-C, and TG improved in switch pts SPIRAL [2] – Switching from to RAL noninferior to remaining on boosted PI-based regimens through Wk 48 in pts with HIV-1 RNA < 50 c/mL for ≥ 6 mos Switching to RAL significantly improved lipids and TC:HDL-C ratio EASIER/ANRS 138 [3] – Switch from ENF to RAL regimens maintained virologic suppression through Wk 48 in patients with multidrug resistance and HIV-1 RNA < 400 c/mL for ≥ 3 mos 1.](http://images.slideplayer.com/25/7658252/slides/slide_27.jpg "Eron J, et al. Lancet. 2010;375: Martinez E, et al. AIDS. 2010;24: Gallien S, et al. J Antimicrob Chemother. 2011;66:")
28
Open-label, multicenter, 48-wk pilot study of switch from RAL + TDF/FTC to EVG/COBI/TDF/FTC in pts with HIV-1 RNA < 50 c/mL for 6 mos (N = 48) Primary endpoint: HIV-1 RNA < 50 c/mL at Wk 12 postswitch Secondary endpoints: Safety and tolerability by Wk 24 and Wk 48 HIV-1 RNA < 50 c/mL at Wk 24 and Wk 48 postswitch All subjects maintained virologic suppression at Wks 12 and 24 – 38/38 subjects who reached Wk 48 at time of report also suppressed TC and LDL-C improved; no renal AEs Crofoot G, et al. IAS 2013. Abstract TUPE283. HIV-1 RNA < 50 c/mL (%) 100 80 60 40 20 0 Wk 12 48/48 38/38* Wk 24Wk 48
 Wk 12 48/48 38/38* Wk 24Wk 48.")
29
Randomized, open-label switch studies in pts virologically suppressed on an NNRTI- or boosted PI–based regimen (both with TDF/FTC) for ≥ 6 mos Primary endpoint: HIV-1 RNA < 50 copies/mL at Wk 48 HIV-1 RNA < 50 c/mL, 2 previous regimens, no resistance to FTC or TDF and CrCl ≥ 70 mL/min STRATEGY-NNRTI [1] (N = 434) STRATEGY-PI [2]* (N = 433) Switch to EVG/COBI/TDF/FTC QD (n = 291) Remain on NNRTI + TDF/FTC (n = 143) Switch to EVG/COBI/TDF/FTC QD (n = 293) Remain on Boosted PI + TDF/FTC (n = 140) *Pts with previous VF ineligible. 1. Pozniak A, et al. CROI 2014. Abstract 553LB. 2. Arribas J, et al. CROI 2014. Abstract 551LB.
![ Randomized, open-label switch studies in pts virologically suppressed on an NNRTI- or boosted PI–based regimen (both with TDF/FTC) for ≥ 6 mos Primary endpoint: HIV-1 RNA < 50 copies/mL at Wk 48 HIV-1 RNA < 50 c/mL, 2 previous regimens, no resistance to FTC or TDF and CrCl ≥ 70 mL/min STRATEGY-NNRTI [1] (N = 434) STRATEGY-PI [2]* (N = 433) Switch to EVG/COBI/TDF/FTC QD (n = 291) Remain on NNRTI + TDF/FTC (n = 143) Switch to EVG/COBI/TDF/FTC QD (n = 293) Remain on Boosted PI + TDF/FTC (n = 140) *Pts with previous VF ineligible.](http://images.slideplayer.com/25/7658252/slides/slide_29.jpg "1. Pozniak A, et al. CROI Abstract 553LB. 2. Arribas J, et al. CROI Abstract 551LB..")
30
Regimens: EFV, 78%; NVP, 17%; RPV, 4%; ETR, < 1%; 74% on EFV/TDF/FTC; 91% on first regimen Results similar across all baseline virologic and demographic subgroups 3 pts with VF in EVG/COBI arm and 1 in NNRTI arm – No pts with resistance in either arm 5 in the switch arm and 1 in the NNRTI arm discontinued due to adverse event Patients (%) 93 88 Δ +5.3% (95% CI: -0.5 to +12) EVG/COBI/TDF/FTC (n = 290) Stable NNRTIs (n = 143) 0 20 40 60 80 100 1313 < 1 1 6 11 Virologic Success* Virologic Nonresponse No Data n = *HIV-1 RNA < 50 c/mL as defined by FDA Snapshot algorithm Discontinued for AE, death, or missing data. Pozniak A, et al. CROI 2014. Abstract 553LB. Reproduced with permission. 27112616

31
Regimens: ATV, 40%; DRV, 40%; LPV, 17%; FPV, 3%; SQV, < 1%; 79% on first regimen Results similar across all baseline virologic and demographic subgroups 2 pts with VF in each arm but no pts with resistance in either arm 5 in the switch arm and 2 in the boosted PI arm discontinued due to adverse event Lipids in switch pts – TGs vs all bPIs – TC, TG, HDL-C vs LPV/RTV – HDL-C vs DRV/RTV Patients, % 94 87 Δ +6.7% (95% CI: 0.4-13.7) EVG/COBI/TDF/FTC (n = 290) Stable boosted PIs (n = 139) 0 20 40 60 80 100 < 1 2 1212 6 12 Virologic Success* Virologic Nonresponse No Data n = *HIV-1 RNA < 50 c/mL as defined by FDA Snapshot algorithm Discontinued for AE, death, or missing data. Arribas J, et al. CROI 2014. Abstract 551LB. 27212116

32
Multicenter, randomized, open-label switch study – Primary endpoint: maintenance of VL < 50 c/mL at Wk 24 (FDA snapshot analysis) Pts with VL < 50 c/mL on stable ritonavir- boosted PI + 2 NRTIs for ≥ 6 mos, no previous NNRTI use (N = 476) Rilpivirine/Tenofovir/Emtricitabine (n = 317) Ritonavir-Boosted PI* + 2 NRTIs (n = 159) Wk 48 Randomized 2:1 Wk 24 Primary endpoint Rilpivirine/ Tenofovir/Emtricitabine (n = 159) Palella F, et al. AIDS 2012. Abstract TUAB0104. *PIs: ATV/RTV, 37%; LPV/RTV, 33%; DRV/RTV, 20%; FPV/RTV, 8%; SQV/RTV, 2%.

33
Switch to RPV/TDF/FTC noninferior to maintaining boosted- PI regimen at Wk 24 – 93.7% vs 89.9% with VL < 50 c/mL – Noninferiority observed regardless of pretreatment (naive) VL stratum All 17 pts with baseline K103N who switched to RPV/TDF/FTC maintained virologic suppression Significant reductions in TC, LDL, TG, HDL, TC:HDL ratio (P <.001) and in 10-yr Framingham score (P =.001) at Wk 24 among RPV/TDF/FTC switch pts HIV-1 RNA < 50 copies/mL at Wk 24 RPV/TDF/FTCBoosted PI 40 0 100 20 80 89.2 95.0 60 83/ 93 152/ 160 n = ≥ 100K Pts With VL < 50 c/mL (%) 92.3 95.5 128/ 134 48/ 52 < 100K 89.9 93.7 Overall Δ 3.8% (-1.6 to 9.1) Δ 3.2% (-4.8 to 11.3) Δ 5.9% (-1.4 to 12.9) *Excludes 23 RPV and 14 boosted PI pts lacking baseline VL while ARV naive. Palella F, et al. AIDS 2012. Abstract TUAB0104. Graphic reproduced with permission. 317159 Baseline VL (When Naive)*
*.")
34
Introduce 5 classes of ARVs and origins of HAART Review ARV regimens for naïve patients Review “switch” regimens (CAUTION!) Review ARV combinations in experienced patients Cases of treatment in primary care settings
 Review ARV combinations in experienced patients Cases of treatment in primary care settings")
35
ALWAYS GET THE TREATMENT HISTORY!!! Try to predict the genotype YOU’D expect from the treatment history Ask yourself: why did the provider switch from this regimen to the other? TRY TO GET EVERY POSSIBLE RESISTANCE TEST DONE Cannot rely on a wildtype genotype result in a highly treatment experienced patient Archived resistant strains may exist Mutations come at a cost! Example: M184V mutations makes HIV-1 less replicatively fit

36
Never switch from a high genetic barrier to a low. Examples of what NOT to do include: Blind switch of PI-based to 1 st gen NNRTI Switch from DRVr or LPVr to ATVr or FAMPr The only 2 nd gen NNRTI studied in experienced patients is etravirine INSTIs have been studied in experienced patients MVC studied in experienced patients; remember it requires dosing adjustments depending on other drugs Last resort: there’s always enfuvirtide!

37
Rate of viral suppression correlates with number of active background agents in salvage regimen Katlama C et al. AIDS 2009; 23: 2289-2300

38
Patients suppressed at week 48 generally stayed suppressed on maraviroc combined with optimized backbone Hardy WD et al. J AIDS 2010; 55: 558-564

39
Multicenter phase II study of DRV/RTV + ETR + RAL (N = 103); addition of NRTIs, ENF at discretion of physician – Inclusion criteria: susceptibility to DRV and ETR based on ≤ 3 DRV and ≤ 3 ETR RAMs, respectively – 59% of pts had < 1 active agent in OBR, as assessed by GSS 86% of pts reached HIV-1 RNA < 50 c/mL at Wk 48 (95% CI: 79% to 93%) [1] Of 100 pts entering extension trial through Wk 96, 88% achieved HIV-1 RNA < 50 c/mL (95% CI: 82% to 94%) [2] Median CD4+ cell count change: +150 cells/mm 3 4 tx-related grade 3/4 AEs reported before Wk 48: recurrent epidermal necrolysis (n = 1) (study d/c); nephrolithiasis (n = 1); lipodystrophia (n = 1); muscle spasm (n = 1) No further events between Wks 48 and 96 1. Yazdanpanah Y, et al Clin Infect Dis. 2009;49:1441-1449. 2. Fagard C, et al. Acquir Immune Defic Syndr. 2012;59:489-493.
![ Multicenter phase II study of DRV/RTV + ETR + RAL (N = 103); addition of NRTIs, ENF at discretion of physician – Inclusion criteria: susceptibility to DRV and ETR based on ≤ 3 DRV and ≤ 3 ETR RAMs, respectively – 59% of pts had < 1 active agent in OBR, as assessed by GSS 86% of pts reached HIV-1 RNA < 50 c/mL at Wk 48 (95% CI: 79% to 93%) [1] Of 100 pts entering extension trial through Wk 96, 88% achieved HIV-1 RNA < 50 c/mL (95% CI: 82% to 94%) [2] Median CD4+ cell count change: +150 cells/mm 3 4 tx-related grade 3/4 AEs reported before Wk 48: recurrent epidermal necrolysis (n = 1) (study d/c); nephrolithiasis (n = 1); lipodystrophia (n = 1); muscle spasm (n = 1) No further events between Wks 48 and 96 1.](http://images.slideplayer.com/25/7658252/slides/slide_39.jpg "Yazdanpanah Y, et al Clin Infect Dis. 2009;49: Fagard C, et al. Acquir Immune Defic Syndr. 2012;59:")
40
Randomized, double-blind, noninferiority, phase III study Treatment-experienced, integrase inhibitor–naive patients with HIV-1 RNA > 400 copies/mL and ≥ 2 class resistance (N = 715) Dolutegravir 50 mg QD + Raltegravir placebo + OBR* (n = 354) Raltegravir 400 mg BID + Dolutegravir placebo + OBR* (n = 361) Stratified by number of fully active background agents, use of DRV, screening HIV-1 RNA (≤ vs > 50,000 copies/mL) Wk 48 *OBR comprising at least 1 and no more than 2 active agents. Cahn P, et al. Lancet. 2013;382:700-708.

41
Lower incidence of resistance at VF with DTG vs RAL – Integrase resistance: 1% (4/354) vs 5% (17/361); P =.003 – OBR resistance: 1% (4/354) vs 3% (12/361) Both regimens well tolerated with similar AE profiles – Grades 2-4: 8% vs 9% – Discontinuations: 3% vs 4% No difference in outcome between study arms when combined with fully active DRV/RTV Cahn P, et al. Lancet. 2013;382:700-708. 100 80 60 40 20 0 Subjects (%) Virologic Success Virologic Nonresponse No Wk 48 Data DTG + OBR (n = 354) RAL + OBR (n = 361) 71 64 20 28 9 9 Δ: 7.4% (95% CI: 0.7-14.2; P =.03)
 Virologic Success Virologic Nonresponse No Wk 48 Data DTG + OBR (n = 354) RAL + OBR (n = 361) Δ: 7.4% (95% CI: ; P =.03).")
42
Phase III single-arm trial Mean HIV-1 RNA change from baseline to Day 8 – Overall: -1.4 log 10 copies/mL (P <.001) – No primary integrase resistance mutations at BL: -1.6 log 10 copies/mL – Q148 + ≤ 1 secondary integrase resistance mutation: -1.1 log 10 copies/mL – Q148 + ≥ 2 secondary integrase resistance mutations: -1.0 log 10 copies/mL Nichols G, et al. Glasgow 2012. Abstract O232. Pts with HIV-1 RNA ≥ 500 c/mL, RAL and/or EVG resistance, and resistance to ≥ 2 other antiretroviral classes* (N = 183) Dolutegravir 50 mg BID + Continue Failing Regimen Dolutegravir 50 mg BID + Optimized Background Regimen With Overall Susceptibility Score ≥ 1 (ie, ≥ 1 active drug) Day 8Wk 24Wk 48 *Detected at screening or based on historical evidence. Functional Monotherapy Optimized Therapy
 Dolutegravir 50 mg BID + Continue Failing Regimen Dolutegravir 50 mg BID + Optimized Background Regimen With Overall Susceptibility Score ≥ 1 (ie, ≥ 1 active drug) Day 8Wk 24Wk 48 *Detected at screening or based on historical evidence. Functional Monotherapy Optimized Therapy.")
43
24-wk data on full cohort (N = 183) and 48-wk data on first 114 pts Response rates affected by baseline INSTI resistance but not overall susceptibility score of background regimen HIV-1 RNA < 50 c/mL at Wk 24 by INSTI Mutation(s), n/N (%) Overall Susceptibility Score 01≥ 2Total No Q1484/4 (100)35/40 (83)57/70 (76)96/114 (79) Q148 + 12/2 (100)8/12 (67)10/17 (59)20/31 (65) Q148 + ≥ 21/2 (50)2/11 (18)1/3 (33)4/16 (25) Outcome, n (%)Wk 24 (n = 183) Wk 48 (n = 114) HIV-1 RNA < 50 c/mL at Wk 24 (snapshot, ITT-E) 126 (69)64 (56) Virologic nonresponse50 (27)44 (39) d/c due to AE or death5 (3)5 (4) Nichols G, et al. IAS 2013. Abstract TULBPE19.

44
Introduce 5 classes of ARVs and origins of HAART Review ARV regimens for naïve patients Review “switch” regimens (CAUTION!) Review ARV combinations in experienced patients Cases of treatment in primary care settings
 Review ARV combinations in experienced patients Cases of treatment in primary care settings")
45
Evidence-based guidelines exist for selecting ARV regimens in treatment naïve patients. Adhere to these recs! Reasons to switch a regimen (CAUTION!) when virologically suppressed include simplification, avoidance of adverse effects, and patient request when appropriate Selecting second or third line regimens after virologic failure can be complicated and requires understanding of acquired resistance, drug combinations, and sometimes additional resistance/tropism testing
 when virologically suppressed include simplification, avoidance of adverse effects, and patient request when appropriate Selecting second or third line regimens after virologic failure can be complicated and requires understanding of acquired resistance, drug combinations, and sometimes additional resistance/tropism testing.")
Similar presentations


 N = 143 ATV/r 300/100 mg + 3TC 300 mg qd Design Randomisation*>")


 With Ritonavir (RTV) or Saquinavir (SQV) vs Lopinavir/Ritonavir (LPV/RTV) in Patients With Multiple Virologic Failures 24-Week Results.>")

 Patients Infected with R5 HIV-1: 96-week Combined Analysis of the MOTIVATE 1 & 2 Studies.>")
