Download presentation
Presentation is loading. Please wait.

1
Chapter 11: Characterizing Stars

2
WHAT DO YOU THINK? How near is the closest star other than the Sun?
Is the Sun brighter than other stars, or just closer? What colors are stars? Are brighter stars hotter? What sizes are stars? Are most stars isolated from other stars, as the Sun is?

3
Apparent Magnitude Scale – brightness of a star as seen from Earth
FIGURE 11-2 Apparent Magnitude Scale (a) Several stars in and around the constellation Orion are labeled with their names and apparent magnitudes. For a discussion of star names, see Guided Discovery: Star Names. (b) Astronomers denote the brightnesses of objects in the sky by their apparent magnitudes. Stars visible to the naked eye have magnitudes between m = –1.44 (Sirius) and about m = +6. CCD (charge-coupled device) photography through the Hubble Space Telescope or a large Earth-based telescope can reveal stars and other objects nearly as faint as magnitude m = +30. (a: Okiro Fujii, L’Astronomie) Astronomers give the brightness of objects in the sky by apparent magnitudes. Stars visible to the naked eye have magnitudes between m = –1.44 and about m = +6. Several stars in and around the constellation Orion labeled with their names and apparent magnitudes
 Several stars in. and around the constellation Orion are labeled with their names. and apparent magnitudes. For a discussion of star names, see. Guided Discovery: Star Names. (b) Astronomers denote the. brightnesses of objects in the sky by their apparent magnitudes. Stars visible to the naked eye have magnitudes between. m = –1.44 (Sirius) and about m = +6. CCD (charge-coupled. device) photography through the Hubble Space Telescope or a. large Earth-based telescope can reveal stars and other objects. nearly as faint as magnitude m = +30. (a: Okiro Fujii, L’Astronomie) Astronomers give the. brightness of objects in the sky by apparent magnitudes. Stars visible to the naked eye have magnitudes between m = –1.44 and about. m = +6. Several stars in and around the constellation Orion labeled with their names and apparent magnitudes.")
4
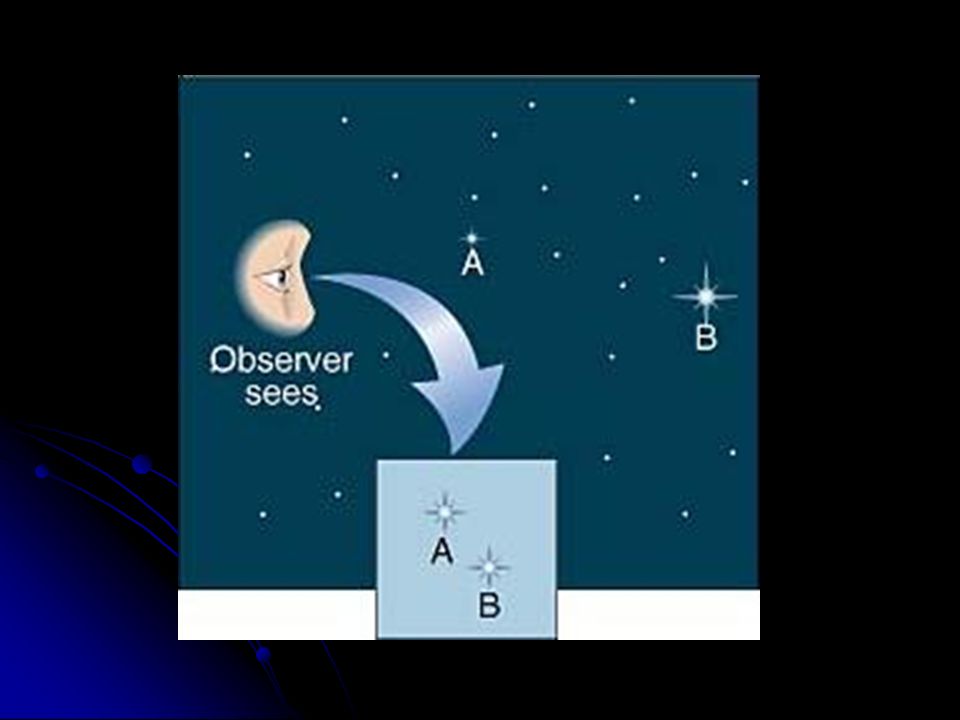
The Inverse-Square Law
FIGURE 11-3 The Inverse-Square Law (a) This drawing shows how the same amount of radiation from a light source must illuminate an ever-increasing area as the distance from the light source increases. The decrease in brightness follows the inverse-square law, which means, for example, that tripling the distance decreases the brightness by a factor of 9. The farther a star is from Earth, the dimmer it looks to us. Doubling the distance makes the star look one-fourth as bright. Tripling the distance decreases the star’s brightness by a factor of 9.
 This drawing. shows how the same amount of radiation from a light source. must illuminate an ever-increasing area as the distance from the. light source increases. The decrease in brightness follows the. inverse-square law, which means, for example, that tripling the. distance decreases the brightness by a factor of 9. The farther a star is from Earth, the dimmer it looks to us. Doubling the distance makes the star look one-fourth as bright. Tripling the distance decreases the star’s brightness by a factor of 9.")
6
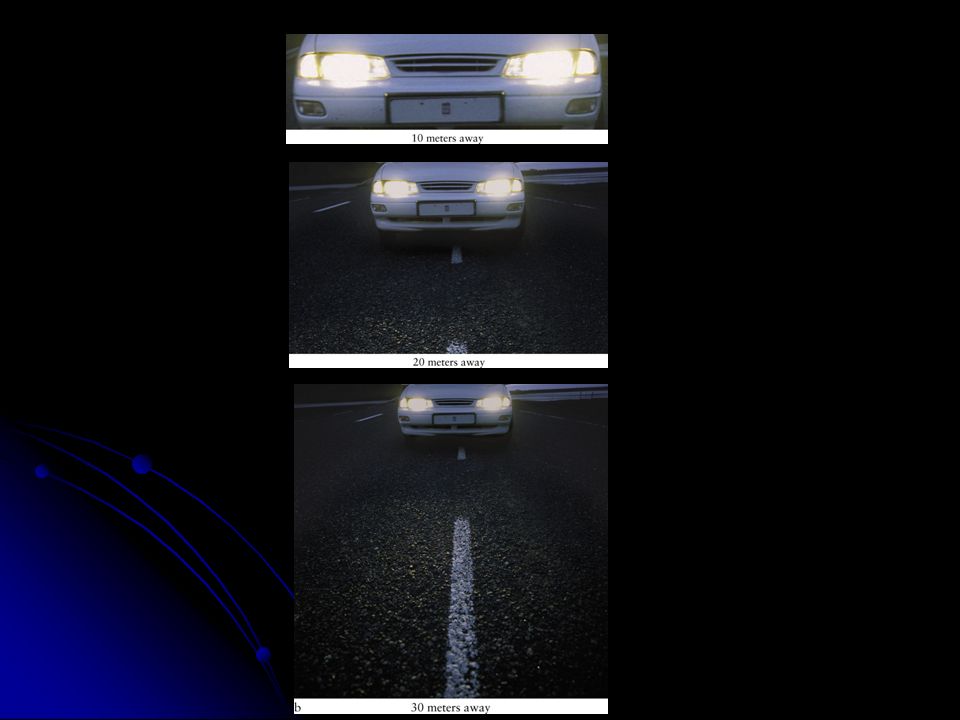
Absolute Magnitude – the actual brightness of a star
Absolute magnitude tells how bright a star really is, no matter how far from Earth it is. Are the car lights actually dimmer as the car moves away?

8
No. Their actual brightness (absolute magnitude) is the same no matter the distance.
But they look dimmer (apparent magnitude) to us when the car is farther away.
 to us when the car is farther away.")
10
Temperature and Color (review)
FIGURE 11-4 Temperature and Color (a) This beautiful Hubble Space Telescope image shows the variety of colors of stars. (b) This diagram shows the relationship between the color of a star and its surface temperature. The intensity of light emitted by three hypothetical stars is plotted against wavelength (compare with Figure 4-2). The range of visible wavelengths is indicated. Where the peak of a star’s intensity curve lies relative to the visible light band determines the apparent color of its visible light. The insets show stars of about these surface temperatures. UV stands for ultraviolet, which extends to 10 nm. See Figure 3-4 for more on wavelengths of the spectrum. (a: Hubble Heritage Team/AURA/STScI/NASA; left inset: Andrea Dupree/Harvard- Smithsonian CFA, Ronald Gilliland/STScI, NASA and ESA; center inset: NSO/AURA/NSF; right inset: Till Credner, Allthesky.com) Hottest = blue color Medium = orange/yellow color Coolest = red color
 This beautiful Hubble Space Telescope image shows the variety of. colors of stars. (b) This diagram shows the relationship between the color of a star and its surface. temperature. The intensity of light emitted by three hypothetical stars is plotted against wavelength (compare. with Figure 4-2). The range of visible wavelengths is indicated. Where the peak of a star’s intensity curve lies. relative to the visible light band determines the apparent color of its visible light. The insets show stars of about. these surface temperatures. UV stands for ultraviolet, which extends to 10 nm. See Figure 3-4 for more on. wavelengths of the spectrum. (a: Hubble Heritage Team/AURA/STScI/NASA; left inset: Andrea Dupree/Harvard- Smithsonian CFA, Ronald Gilliland/STScI, NASA and ESA; center inset: NSO/AURA/NSF; right inset: Till Credner, Allthesky.com) Hottest = blue color. Medium = orange/yellow color. Coolest = red color.")
11
Spectral Classes (Color and Temperature)
“Oh, Be A Fine Guy/Girl, Kiss Me!”

12
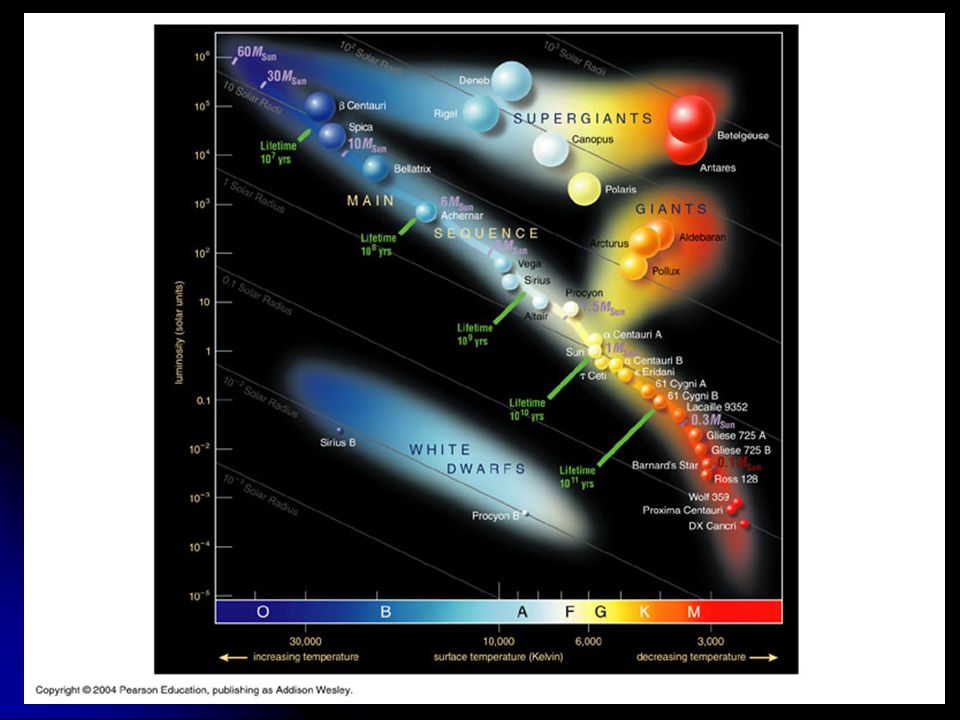
Hertzsprung-Russell (HR) Diagram (Textbook page 305)
FIGURE 11-7 A Hertzsprung-Russell Diagram On an H-R diagram, the luminosities of stars are plotted against their spectral types. Each dot on this graph represents a star whose luminosity and spectral type have been determined. Some well known stars are identified. The data points are grouped in just a few regions of the diagram, revealing that luminosity and spectral type are correlated: Main-sequence stars fall along the red curve, giants are to the right, supergiants are on the top, and white dwarfs are below the main sequence. The absolute magnitudes and surface temperatures are listed at the right and top of the graph, respectively. These are sometimes used on H-R diagrams instead of luminosities and spectral types. (

14
Hertzsprung-Russell (HR) Diagram
Star brightness is plotted against star spectral types (color / temperature). Brightness and spectral type are related. Main-sequence stars (fusing hydrogen to helium) fall along the red curve. Giants are to the upper right and super-giants are on the top. White dwarfs are below the main sequence. FIGURE 11-7 A Hertzsprung-Russell Diagram On an H-R diagram, the luminosities of stars are plotted against their spectral types. Each dot on this graph represents a star whose luminosity and spectral type have been determined. Some well known stars are identified. The data points are grouped in just a few regions of the diagram, revealing that luminosity and spectral type are correlated: Main-sequence stars fall along the red curve, giants are to the right, supergiants are on the top, and white dwarfs are below the main sequence. The absolute magnitudes and surface temperatures are listed at the right and top of the graph, respectively. These are sometimes used on H-R diagrams instead of luminosities and spectral types. (
. Brightness and spectral type are related. Main-sequence stars (fusing hydrogen to helium) fall along the red curve. Giants are to the upper right and super-giants are on the top. White dwarfs are below the main sequence. FIGURE 11-7 A Hertzsprung-Russell Diagram On an H-R. diagram, the luminosities of stars are plotted against their. spectral types. Each dot on this graph represents a star whose. luminosity and spectral type have been determined. Some well known. stars are identified. The data points are grouped in just a. few regions of the diagram, revealing that luminosity and. spectral type are correlated: Main-sequence stars fall along the. red curve, giants are to the right, supergiants are on the top, and white dwarfs are below the main sequence. The absolute. magnitudes and surface temperatures are listed at the right and. top of the graph, respectively. These are sometimes used on H-R. diagrams instead of luminosities and spectral types. (")
15
HR Diagram Basics Thanks to Dan Enriquez

16
Star Size Is Also Important
Hotter stars are brighter than cooler stars (of the same size). Bigger stars are brighter than smaller stars (of the same temperature). So the brightest stars are the biggest, hottest ones. L = R2T4 (L = brightness, R = radius, T = temperature)
. Bigger stars are brighter than smaller stars (of the same temperature). So the brightest stars are the biggest, hottest ones. L = R2T4 (L = brightness, R = radius, T = temperature)")
17
Mass-Temperature-Brightness
Each dot = a main-sequence star. The dot’s number is the mass of that star in solar masses (Sun = 1). Mass, brightness, and temperature of main-sequence stars increase from lower right to upper left. (b) On this H-R diagram, each dot represents a main-sequence star. The number next to each dot is the mass of that star in solar masses (M). As you move up the main sequence from the lower right to the upper left, the mass, luminosity, and surface temperature of mainsequence stars all increase.
. Mass, brightness, and temperature of main-sequence stars increase from lower right to upper left. (b) On this H-R diagram, each dot represents a main-sequence star. The number next to. each dot is the mass of that star in solar masses (M). As you. move up the main sequence from the lower right to the upper. left, the mass, luminosity, and surface temperature of mainsequence. stars all increase.")
18
WHAT DID YOU THINK? How near is the closest star other than the Sun?
Proxima Centauri is about 40 trillion kilometers (25 trillion miles) away. It takes light about 4 years to reach the Earth from there. How luminous is the Sun compared with other stars? The most luminous stars are about a million times brighter and the least luminous stars are about a hundred thousand times dimmer than the Sun. What colors are stars? Stars are found in a wide range of colors, from red through violet, as well as white.
 away. It takes light about 4 years to reach the Earth from there. How luminous is the Sun compared with other stars The most luminous stars are about a million times brighter and the least luminous stars are about a hundred thousand times dimmer than the Sun. What colors are stars Stars are found in a wide range of colors, from red through violet, as well as white.")
19
WHAT DID YOU THINK? Are brighter stars hotter than dimmer stars?
Not necessarily. Many brighter stars, such as red giants, are cooler but larger than hotter, dimmer stars, such as white dwarfs. What sizes are stars? Stars range from more than 1000 times the Sun’s diameter to less than 1/100 the Sun’s diameter. Are most stars isolated from other stars, as the Sun is? No. In the vicinity of the Sun, two-thirds of the stars are found in pairs or larger groups.

Similar presentations


. Basic Properties of Stars.>")


