Download presentation
Presentation is loading. Please wait.

1
ASSESSMENT OF BIGEYE TUNA (THUNNUS OBESUS) IN THE EASTERN PACIFIC OCEAN January 1975 – December 2006
 IN THE EASTERN PACIFIC OCEAN January 1975 – December 2006")
2
Outline Stock assessment –Overview of assessment model –Fishery data –Assumptions –Results of base case model –Projections Sensitivity analyses Summary and conclusions Discussion

3
Overview of assessment Age-structured, statistical, catch-at-length model (Stock Synthesis II). Same type of model as A-SCALA or MULTIFAN-CL Differences between SS2 and A-SCALA

4
Bigeye fishery definitions Recent FLT (2-5) Discards (10-13) N Longline (8) S Longline (9) Early FLT (1) Early & Recent UNA (6, 7) 1, 6-7 8 9 2, 10 3, 11 5, 13 4, 12 FLT – Floating objects; UNA - Unassociated
 Discards (10-13) N Longline (8) S Longline (9) Early FLT (1) Early & Recent UNA (6, 7) 1, , 10 3, 11 5, 13 4, 12 FLT – Floating objects; UNA - Unassociated")
5
Data - catch Early FLT N Offshore FLT Equatorial FLTCoastal FLTS Offshore FLT Early UNARecent UNAN LL S LL Disc - S FLT Disc – Eq FLT Disc – coastal FLT Disc -N FLT

6
Data - discards Southern FLT Equatorial FLT Northern FLT Inshore FLT

7
Data - effort Early FLT N Offshore FLT Equatorial FLT Coastal FLT S Offshore FLT Early UNA Recent UNA N LL S LL Disc - S FLT Disc – Eq FLT Disc – coastal FLT Disc -N FLT

8
Data - CPUE Early FLT N Offshore FLT Equatorial FLTCoastal FLTS Offshore FLT Early UNARecent UNAN LL S LL Disc - S FLT Disc – Eq FLT Disc – coastal FLT Disc -N FLT

9
Data - Length frequency data Quarter 2000 1997 2005

10
Assumptions (base case) - movement Tagging records indicate little exchange of bigeye between E and W Pacific Results from conventional and archival tagging indicate regional fidelity for bigeye in EPO Different CPUE trends between EPO and WCP DATA Single stock of bigeye in EPO No net movement of fish between the eastern and western Pacific SA for EPO and Pacific wide are consistent ASSUMPTIONS
 - movement Tagging records indicate little exchange of bigeye between E and W Pacific Results from conventional and archival tagging indicate regional fidelity for bigeye in EPO Different CPUE trends between EPO and WCP DATA Single stock of bigeye in EPO No net movement of fish between the eastern and western Pacific SA for EPO and Pacific wide are consistent ASSUMPTIONS")
11
Assumptions (base case) - growth Von Bertalanffy – fixed parameters
 - growth Von Bertalanffy – fixed parameters")
12
Assumptions (base case) – M
 – M")
13
Assumptions (base case) - cont. Age-specific maturity and fecundity indices No S-R relationship (steepness = 1)
.")
14
Results (base case) Fit to the length frequency Fishing mortality Selectivity Recruitment Biomass
 Fit to the length frequency Fishing mortality Selectivity Recruitment Biomass")
15
Fit to LF data – Pearson residuals

16
Fit to CPUE data – Floating object

17
Fit to CPUE data – Longline

18
Fishing mortality Ages 1-4 Ages 5-8 Ages 13-16 Ages 17-20 Ages 9-12 Ages 21-24 Ages 25-28Ages 29-32 Ages 33-36 Ages 37-40

19
Age-specific fishing mortality 1975-1992 1993-2006

20
Size selectivity Early FLT N Offshore FLT Equatorial FLT Coastal FLT S Offshore FLT Early UNA Recent UNA N LL S LL

21
Recruitment

22
Biomass Biomass of fish 0.75 + years old

23
Spawning biomass Population fecundity

24
No-fishing plot

25
Average weight

26
Retrospective analysis - biomass

27
Retrospective analysis - recruitment

28
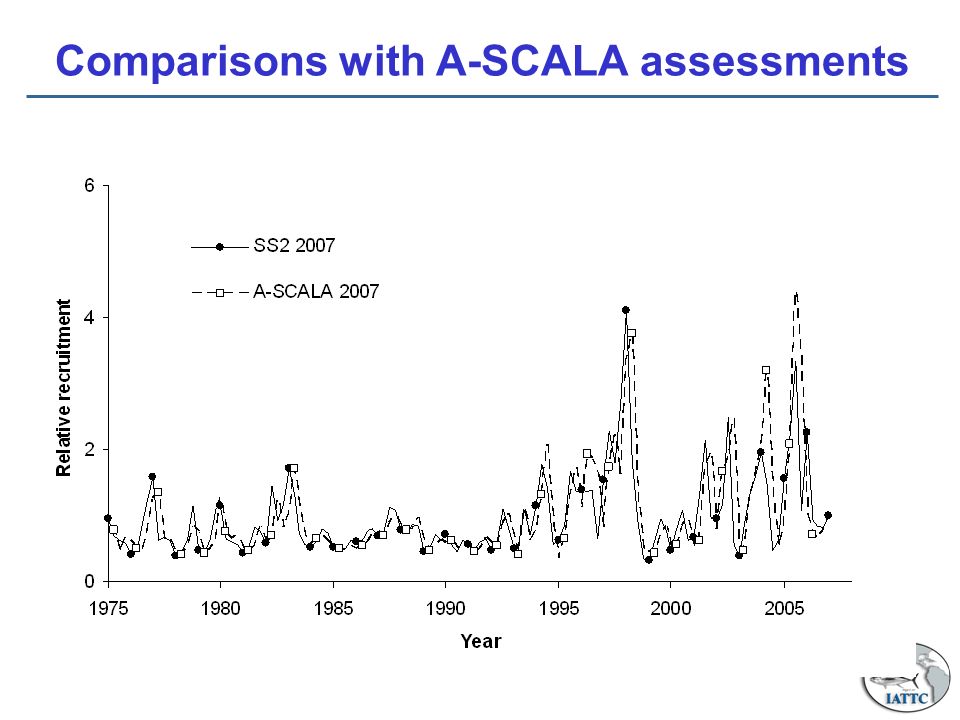
Comparisons with A-SCALA

29
Comparisons with A-SCALA assessments

31
Comparisons to reference points Spawning biomass depletion (SBR)
")
32
Spawning biomass ratio

33
SBR comparison with A-SCALA

34
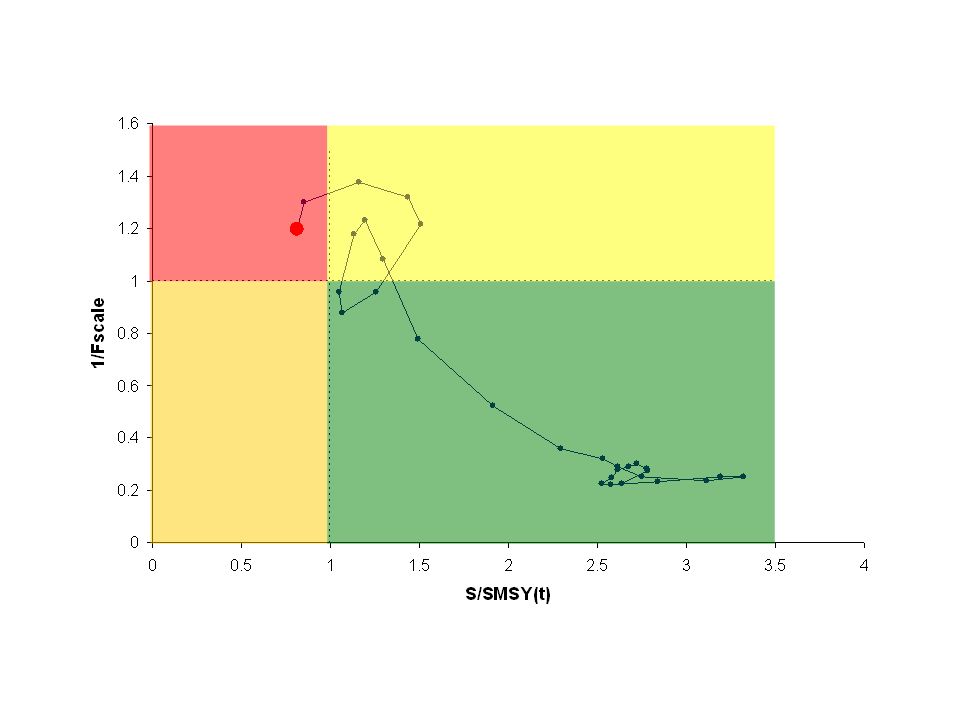
Time varying indicators

35
AMSY-quantities

36
AMSY-quantities – by fishery

38
Forward simulations Biomass Spawning biomass depletion Surface fishery catch Longline catch

39
Spawning biomass ratio

40
Predicted catches – purse-seine

41
Predicted catches – longline

42
Sensitivity analyses 1.Spawner-recruitment relationship (steepness = 0.75) 2.Growth -Growth estimated -Linf fixed (171.5 and 201.5) 3.Fitting to the initial equilibrium catch 4.Use of iterative reweighting of data 5.Time blocking of selectivity and catchability for southern longline fishery 6.Inclusion of new Japanese longline data
 2.Growth -Growth estimated -Linf fixed (171.5 and 201.5) 3.Fitting to the initial equilibrium catch 4.Use of iterative reweighting of data 5.Time blocking of selectivity and catchability for southern longline fishery 6.Inclusion of new Japanese longline data")
43
Stock-recruitment relationship (h = 0.75)
")
44
Biomass

45
Recruitment

46
Spawning biomass ratio

47
Spawner-recruitment curve

48
Use of CPUE time series for southern longline fishery only

49
Spawning biomass ratio

50
Model fit to CPUE data

51
Assumed value for the asymptotic length parameter of the VB growth curve

52
Growth curves

53
SBR

54
Fit to initial equilibrium catch

55
Spawning biomass ratio

56
Use of iterative reweighting

57
Iterative reweighting

58
Spawning biomass ratio

59
Fit to CPUE data

60
Residual plot

61
Use two time blocks for selectivity and catchability of the southern longline fishery

62
Fit to LF data – base case

63
Spawning biomass ratio

64
Fit to CPUE data With iterative reweighting Without iterative reweighting

65
Residual plot

66
Inclusion of the new Japanese longline data

67
Biomass

68
Recruitment

69
SBR

70
Comparisons between models

71
Summary: Main results Both total and spawning biomass is estimated to have substantially declined since 2000 Current biomass level is low compared to average unexploited conditions The current effort levels are too high to maintain the population at level that will support AMSY Yileds could be increased if more of the catch was taken in the longline fisheries

72
What is robust Fishing mortality levels are greater than that necessary to achieve the maximum sustainable yield Two exceptions: Lmax fixed and time blocks

73
Plausible Sensitivities and Uncertainties Results are more pessimistic with the inclusion of a stock-recruitment relationship Biomass trends are sensitive to the weighting of different datasets Recent estimates are uncertain and subject to retrospective bias

74
Conclusions Current spawning biomass is unlikely to remain at or above the level required to produce AMSY. In the most recent years the fishing mortality is greater than that required to produce AMSY. Under average recruitment, the stock is predicted to be below the level that would support AMSY unless fishing mortality levels are reduced further than the current restrictions.

75
Comparisons between models

Similar presentations
 Striped Bass Stocks Marine Fisheries Commission Business Meeting February 11, 2011.>")


 Center for the Advancement of Population.>")
 Fish 458, Lecture 15.>")


 von Bertalanffy growth parameters using conditional-age-at-length data.>")
