Download presentation
Presentation is loading. Please wait.

1
Illustrating DyadR Using the Truth & Bias Model
David A. Kenny Powerpoint davidakenny.net/DyadR/DyadR.ppt Data davidakenny.net/DyadR/Acitelli_Individual.sav davidakenny.net/DyadR/Acitelli_Dyad.sav davidakenny.net/DyadR/Acitelli_Pairwise.sav Output davidakenny.net/DyadR/DyadR_Output.pdf

2
Overview Truth and Bias (T&B) Model Illustration from Acitelli Dataset
Use DyadR Programs to Estimate and Test a T&B Model

3
The Truth and Bias Model (T&B)
West, T. V., & Kenny, D. A. The truth and bias model of judgment (T&B). Psychological Review, 118, 357–378.
. Psychological Review, 118, 357–378.")
4
Basic Idea of the T&B Model
Theoretical and empirical framework designed to address the basic questions of how accuracy and bias operate, and the nature of their interdependence Judgment is determined by the truth (T) and bias (B). Accuracy is defined as a relationship not an event.
 and bias (B). Accuracy is defined as a relationship not an event.")
5
Types of Bias in the T&B Model
Some biases are measured using variables For the bias of assumed similarity, bias is measured using the perceivers’ self-judgment. For the bias of perseveration, bias is measured as prior judgment.

6
Directional Bias How strongly judgments are pulled away from the mean level of the truth The extent to which perceivers’ under-or-overestimate the average value of the truth With proper scaling can be obtained from the intercept in the regression equation.

7
Moderators Variables that inform how the processes of accuracy and bias occur by influencing the strength of the forces Can moderate the truth force, the bias force, directional bias, or all three A moderator may have one effect on the truth force and another effect on the bias force.

8
Key Measurement Issue Measure Truth, Bias Variables, and Judgment using the same scale. Center Truth, Bias Variables and Judgment using the truth mean. Directional bias becomes the regression intercept in the model.

9
Acitelli Study Sample 148 married and 90 dating couples in the Detroit area Outcome Your partner’s relationship with the child (children) is good (1 to 5). Predictor Variable Your relationship with the child (children) is good (1 to 5). Covariate: Married (1)vs. dating (-1)
 is good (1 to 5). Predictor Variable. Your relationship with the child (children) is good (1 to 5). Covariate: Married (1)vs. dating (-1)")
10
T&B Example Woman’s Perception of Man’s Rel. with Child
Woman’s Rel. with Child Female Bias Woman’s Perception of Man’s Rel with Child Female Accuracy Male Accuracy Man’s Rel. with Child Man’s Perception of Woman’s Rel with Child Male Bias Because the data are dyadic, there are two accuracy and bias effects. We can estimate the above model using the Actor-Partner Interdependence Model (Kashy & Kenny).
.")
11
What We Need To Do Restructure Data Examine Distinguishability
Estimate the APIM We shall use DyadR.

12
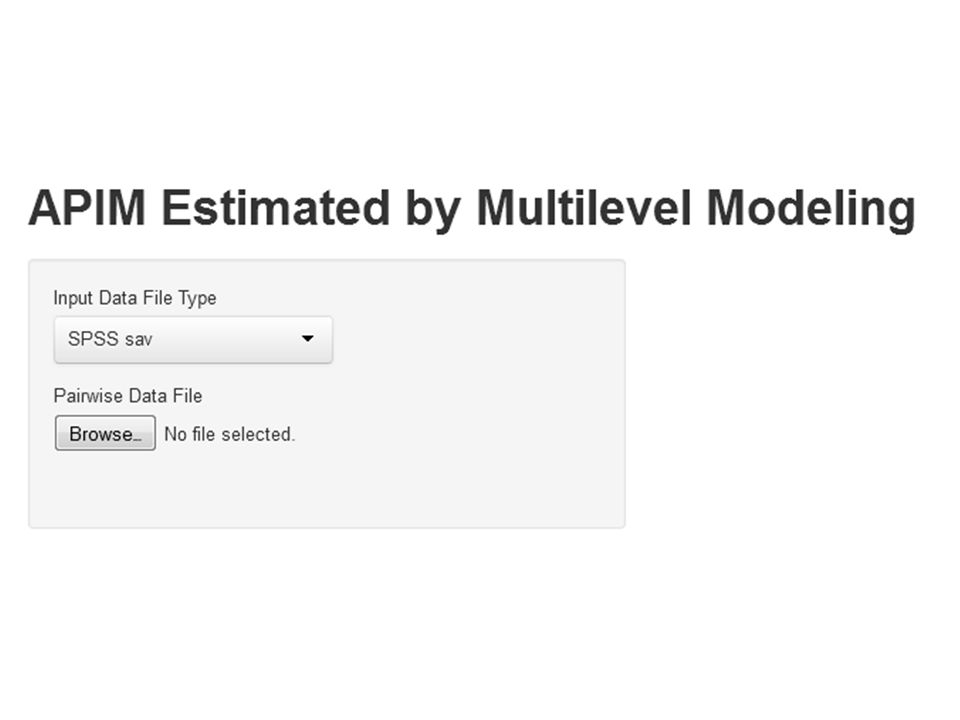
What is DyadR? Package of programs written in R for dyadic analysis.
R is open source free DyadR is written as a “shiny” app and no knowledge of R is needed. Provides not only the usual computer output, but also text, tables, suggestions, and figures. Done in collaboration with others (Tom Ledermann at Utah State, Lara Stas at Ghent, and Rob Ackerman at Texas Dallas)
")
13
Task 1: Restructure Data
Ordinarily dyad data are entered by individual: one record person. Analysis requires other formats: Dyad Pairwise

14
Individual Data Structure
Dyad Person X Y Z

15
Subscripts 1 and 2 refer to roles like man and woman.
Dyad Data Structure Dyad X1 Y1 X2 Y2 Z Subscripts 1 and 2 refer to roles like man and woman.

16
Pairwise Data Structure
Dyad Person X1 Y1 X2 Y2 Z Subscripts 1 and 2 refer to respondent and partner.

17
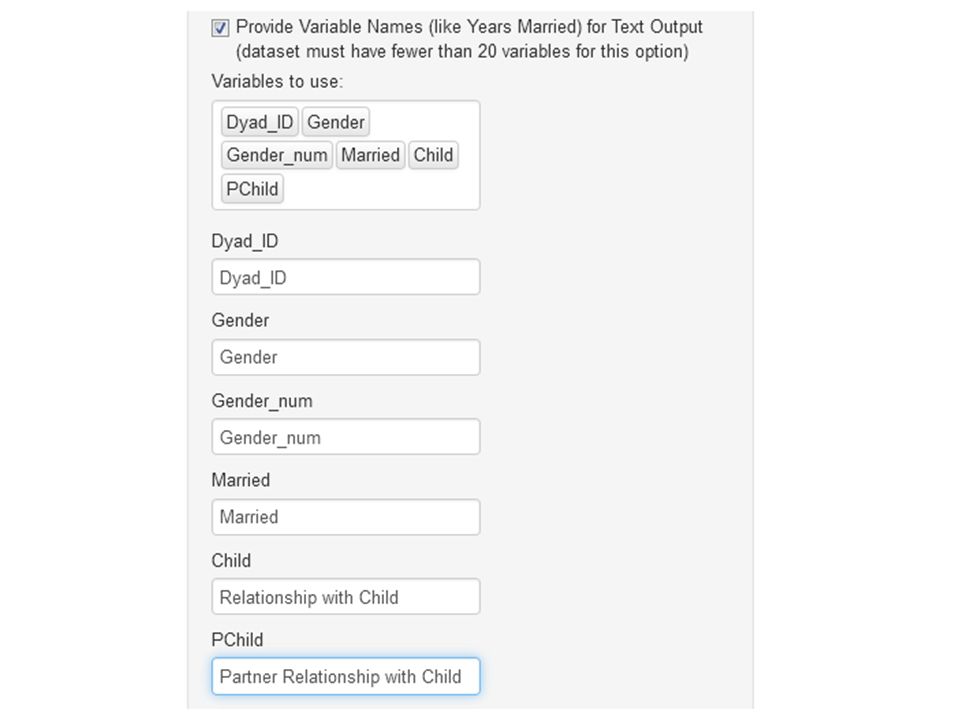
Apps Individual to Dyad: ItoD Individual to Pairwise: ItoP
Individual to Pairwise: ItoP

22
ItoD: Text “The dataset has been transformed from an individual to a dyad dataset called OutputData. The distinguishing variable is Gender_num, and it has two levels, Women (-1) and Men (1). There are 238 dyads and 476 individuals, 238 Women and 238 Men. There are missing data for one or more of the variables in the dataset. The listwise deleted dataset contains 145 dyads and 278 individuals. There are 4 variables, 1 between-dyad variable, 1 within-dyad variable, and 2 mixed variables. There is one variable that is a string or character variable which has been deleted from the dataset and it is Gender. The one between-dyad variable is Married, and the one within-dyad variable is Gender Numeric. The within-dyads variable, Gender Numeric, is a dichotomy and could be used as a distinguishing variable.”
 and Men (1). There are 238 dyads and 476 individuals, 238 Women and 238 Men. There are missing data for one or more of the variables in the dataset. The listwise deleted dataset contains 145 dyads and 278 individuals. There are 4 variables, 1 between-dyad variable, 1 within-dyad variable, and 2 mixed variables. There is one variable that is a string or character variable which has been deleted from the dataset and it is Gender. The one between-dyad variable is Married, and the one within-dyad variable is Gender Numeric. The within-dyads variable, Gender Numeric, is a dichotomy and could be used as a distinguishing variable.")
23
ItoD: First Table The descriptive statistics for the variables as individuals are below. Sample sizes are given in the last column of the table for each variable. Mean sd Minimum Maximum Intraclass r N Gender Numeric 0.000 1.001 -1.000 1.000 476 Married 0.244 0.971 Close to Child 0.487 -1.767 0.233 0.207 279 Partner Close to Child -0.066 0.583 -2.767 0.133 278

24
ItoD: Second Table The descriptive and inferential statistics for the mixed and within-dyads variables as dyads are below. Sample sizes are given in the last column in both tables. For table below, the number of cases refers to the number with complete data for both members. Degrees of freedom for the test of mean difference are one less the sample size and for the test of standard deviation difference and the test of the correlation are two less the sample size. Mean sd Women Men p r N Close to Child 0.017 -0.028 .398 0.481 0.505 .567 .230 .007 134 Partner Close to Child -0.135 0.015 .023 0.645 0.482 <.001 .129 .137 133

25
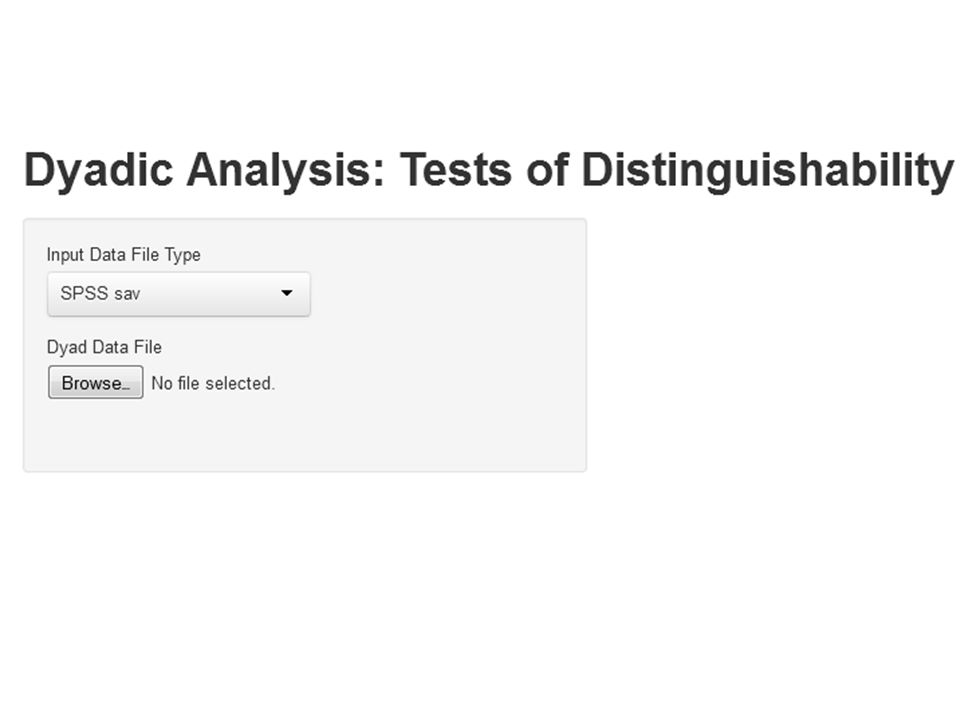
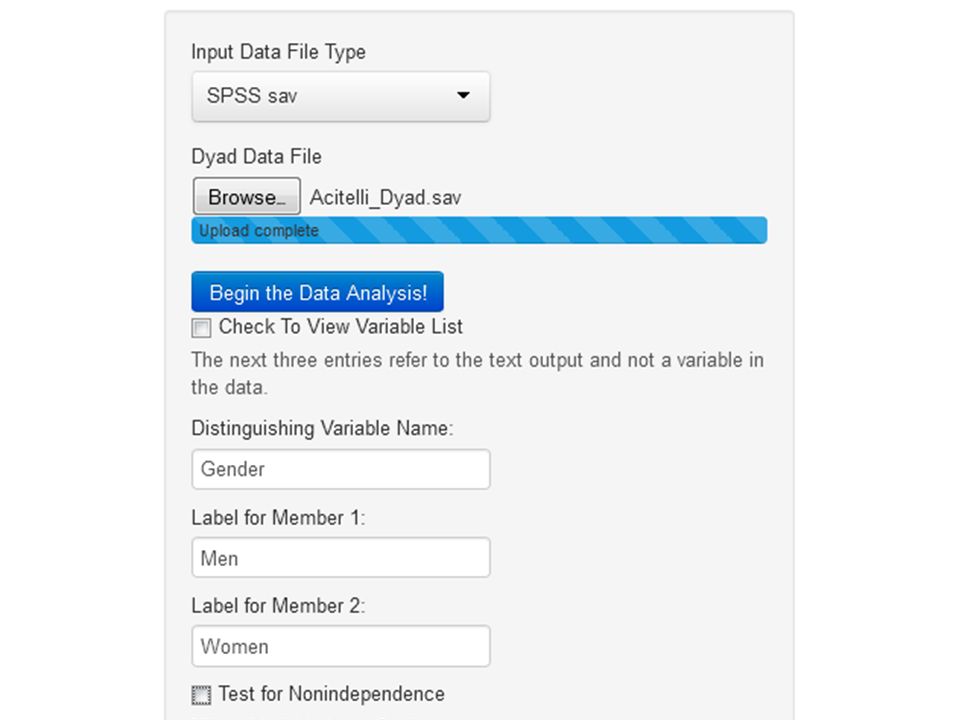
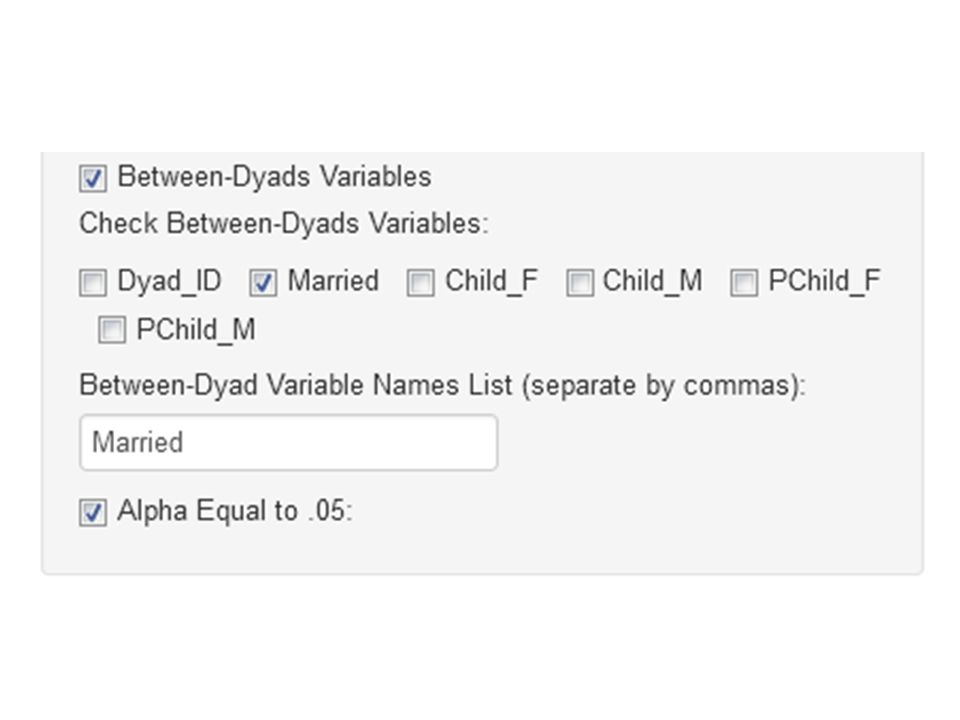
Task 2: Determine whether dyad members are distinguishable.
Each dyad consists of a man and woman. Can we ignore gender? If so, dyad members are said to be “indistinguishable.” By doing so, we obtain a simpler model with more power to test hypotheses.

31
Results from Dingy Conclusion: “Because all of the models have poor fit (both in terms of the chi-square test and the RMSEA), and because the SABIC is lowest for the model of complete distinguishability (see Table 2), it seems reasonable to assume that dyad members are fully distinguishable.” Table 3: Tests of Hypotheses of Different Types of Distinguishability chi square df p value Means 8.138 2 .017 Correlations 8.535 4 .074 Variances 15.178 <.001
, and because the SABIC is lowest for the model of complete distinguishability (see Table 2), it seems reasonable to assume that dyad members are fully distinguishable. Table 3: Tests of Hypotheses of Different Types of Distinguishability. chi square. df. p value. Means Correlations Variances <.001.")
32
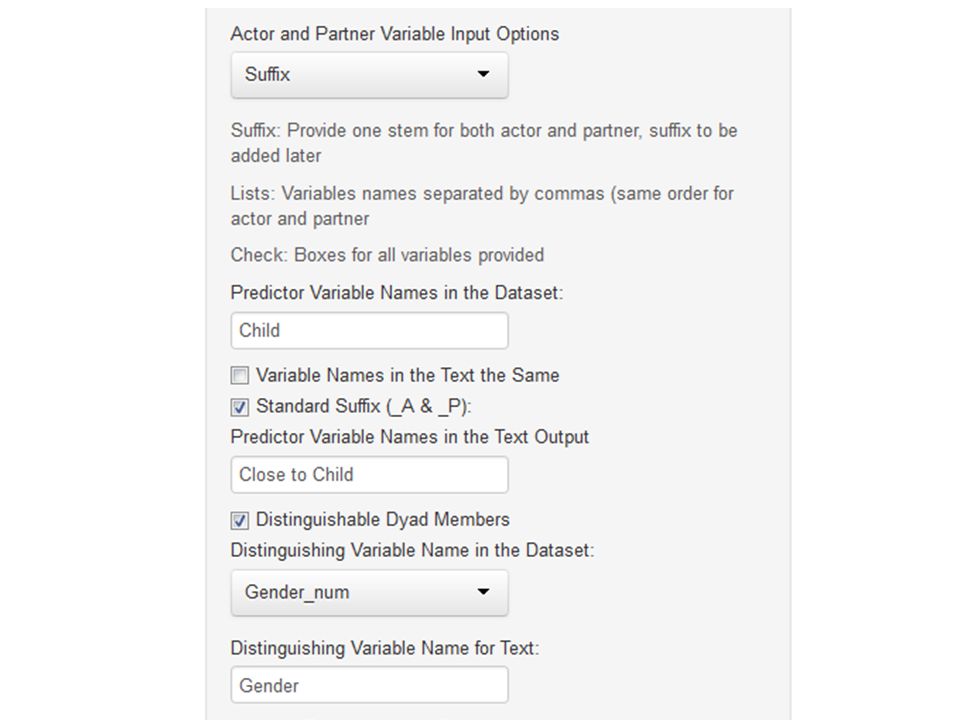
Task 3: Use the APIM to Estimate and Test T&B, Treating Dyad Members as Distinguishable
Pairwise Dataset Perceptions of Partner’s Closeness to the Child is predicted by Actual Closeness and Own Closeness, an APIM.

38
Suggestions from APIM_MM
1. There is one outlier (standardized residual greater than 4.0 or less than 4.0) for P Close to Child. Examine the output to see what observation might be considered to be an outlier. 2. There is evidence of negative skew in the residuals of P Close to Child. (many other suggestions are possible)
 for P Close to Child. Examine the output to see what observation might be considered to be an outlier. 2. There is evidence of negative skew in the residuals of P Close to Child. (many other suggestions are possible)")
39
T&B Results: Truth and Bias Results

40
Differences by Gender? “The test that the two actor effects are statistically significantly different is not significant, Z = (p = .057).” “The test that the two partner effects are statistically significantly different is not significant, Z = (p = .324).” “The combined actor effect across both Women and Men is equal to and is statistically significant (p < .001) and the standardized effect equals (r = .448 and a medium effect size). The combined partner effect across both Women and Men is equal to and is statistically significant (p = .033) and the standardized effect equals (r = .143 and a small effect size).”
. The combined actor effect across both Women and Men is equal to and is statistically significant (p < .001) and the standardized effect equals (r = .448 and a medium effect size). The combined partner effect across both Women and Men is equal to and is statistically significant (p = .033) and the standardized effect equals (r = .143 and a small effect size).")
41
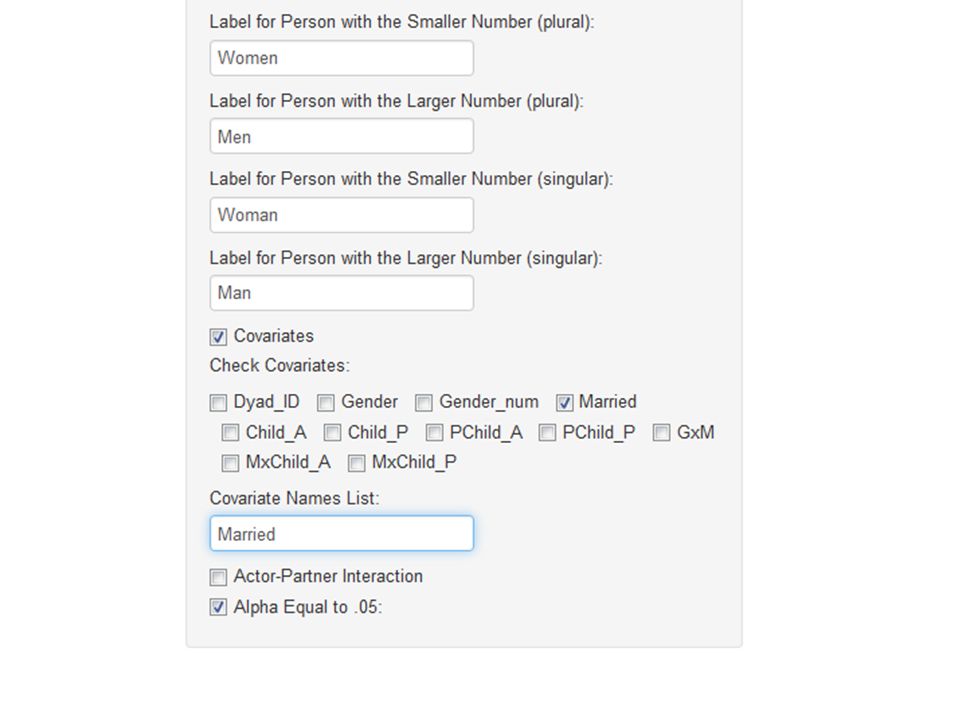
T&B: Directional Bias? Women: -0.213, p < .001
Overall: , p = .017 Gender Difference: p = .008 Moderation by Marital Status: 0.097, p = .027 Married: Dating:

42
Future Work APIM Options Moderators Non-normal outcomes
Remove outliers Mediation models SEM estimation Alternative dyadic models Common fate & mutual influence Alternative dyadic designs SRM and One-with-Many designs Longitudinal dyadic models

43
Thank You! Powerpoint davidakenny.net/DyadR/DyadR.ppt Data davidakenny.net/DyadR/Acitelli_Individual.sav davidakenny.net/DyadR/Acitelli_Dyad.sav davidakenny.net/DyadR/Acitelli_Pairwise.sav Output

Similar presentations


 Association Between Variables Measured at the Interval-Ratio Level: Bivariate Correlation and Regression.>")


