Download presentation
Presentation is loading. Please wait.

2
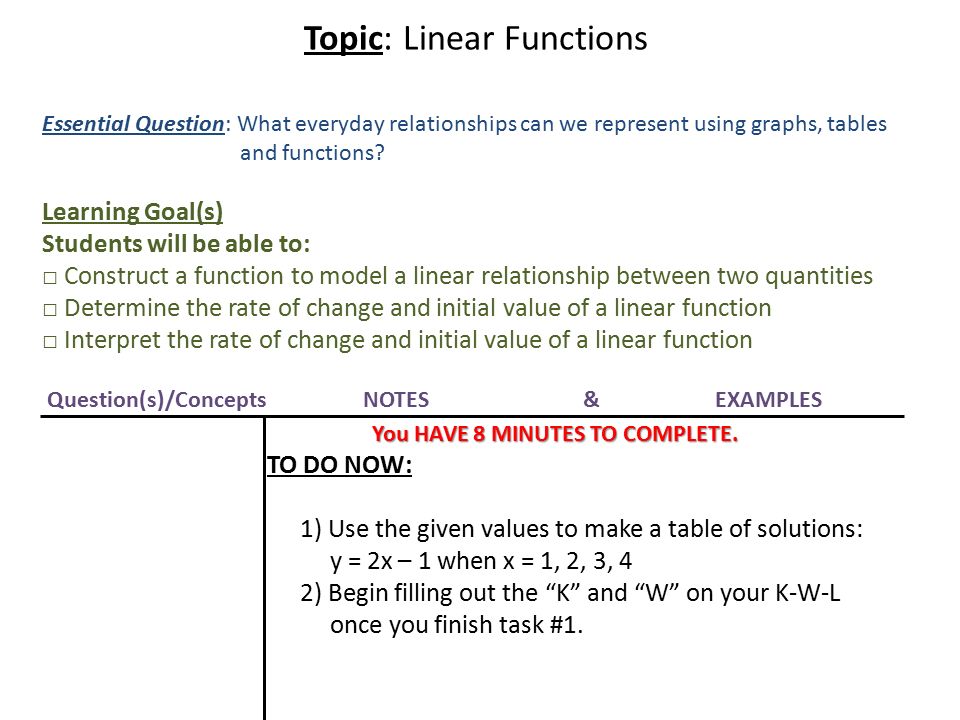
Topic: Linear Functions Essential Question: What everyday relationships can we represent using graphs, tables and functions? Learning Goal(s) Students will be able to: □ Construct a function to model a linear relationship between two quantities □ Determine the rate of change and initial value of a linear function □ Interpret the rate of change and initial value of a linear function Question(s)/Concepts NOTES & EXAMPLES You HAVE 8 MINUTES TO COMPLETE. You HAVE 8 MINUTES TO COMPLETE. TO DO NOW: 1) Use the given values to make a table of solutions: y = 2x – 1 when x = 1, 2, 3, 4 2) Begin filling out the “K” and “W” on your K-W-L once you finish task #1.
 Students will be able to: □ Construct a function to model a linear relationship between two quantities □ Determine the rate of change and initial value of a linear function □ Interpret the rate of change and initial value of a linear function Question(s)/Concepts NOTES & EXAMPLES You HAVE 8 MINUTES TO COMPLETE. You HAVE 8 MINUTES TO COMPLETE. TO DO NOW: 1) Use the given values to make a table of solutions: y = 2x – 1 when x = 1, 2, 3, 4 2) Begin filling out the K and W on your K-W-L once you finish task #1..")
3
Correct Response for #1 X2x - 1Y(X, Y) 12(1) – 11(1,1) 22(2) – 13(2,3) 32(3) – 15(3,5) 42(4) – 17(4,7)
 12(1) – 11(1,1) 22(2) – 13(2,3) 32(3) – 15(3,5) 42(4) – 17(4,7)")
4
Intro to Functions

5
Question(s)/Concept(s) NOTES & EXAMPLES PROCESSING Our school in the City: New York, New York If we can convince our principal, using functions, equations, graphs, and tables, that if we have certain fund- raisers, particularly a car wash, we may be able to take a trip to New York! So let’s talk business. We can prepare a presentation with CRAZY SWAG, so that the principal simply cannot refuse. 1 st – Let us understand the LANGUAGE we need to use in the presentation. OK, so if we are going to have a car wash, our focus will be the money we are going to make from it.

6
Question(s)/Concept(s) NOTES & EXAMPLES PROCESSING Our school in the City: New York, New York Cars (X-VALUES)Money (Y-VALUES) 13 39 515 721 INPUT (Independent variable) OUTPUT ($$S) (Dependent Variable) Ordered Pair Look at the table to determine a) How much are we charging to wash each car? Is that the rate of change? b) What is the general rule or equation that we can use to figure out how much ANY # of cars washed cost?
 What is the general rule or equation that we can use to figure out how much ANY # of cars washed cost .")
7
Temperature Check

8
Question(s)/Concept(s) NOTES & EXAMPLES PROCESSING Our school in the City: New York, New York Cars (X-VALUES a.k.a Domain) Money (Y-VALUES a.k.a Range) 13 39 515 721 INPUT (Independent variable) OUTPUT ($$S) (Dependent Variable) Ordered Pair The number of cars washed and the money earned is what we call a RELATION. A RELATION is a set of ordered pairs. They have a special type of relation which is known as a FUNCTION. In a function, like this one, each input or DOMAIN VALUE is paired with EXACTLY ONE output or RANGE VALUE. What is the rate of change?

9
Temperature Check

10
Question(s)/Concept(s) NOTES & EXAMPLES PROCESSING Our school in the City: New York, New York Cars (X-VALUES a.k.a Domain) Money (Y-VALUES a.k.a Range) 13 39 515 721 INPUT (Independent variable) OUTPUT ($$S) (Dependent Variable) Ordered Pair Now that we know what the general rule is for determining the money earned for washing any number of cars, figure out how much would be earned for washing 4 cars? Our Rule is: y = 3x

11
Temperature Check

12
Question(s)/Concept(s) NOTES & EXAMPLES PROCESSING Our school in the City: New York, New York Cars (X-VALUES a.k.a Domain) Money (Y-VALUES a.k.a Range) 13 39 515 721 INPUT (Independent variable) OUTPUT ($$S) (Dependent Variable) Ordered Pair So we heard through the grape vine that a celebrity is considering sponsoring our trip. The celebrity decides to give us $1000 towards the trip. What will the new function rule be?

13
Question(s)/Concept(s) NOTES & EXAMPLES PROCESSING Our school in the City: New York, New York Cars (X-VALUES a.k.a Domain) Money (Y-VALUES a.k.a Range) 13 39 515 721 INPUT (Independent variable) OUTPUT ($$S) (Dependent Variable) Ordered Pair The new rule will be y = 3x + 1000. What does the $1,000 represent?

14
Temperature Check

15
14 Q’s & C’s NOTES &EXAMPLES Using Slopes and Intercepts We have already learned that the rate of change for a linear function is constant and is known as the slope of a line, represented by the letter m, and is a ratio that compares the difference in y-values (dependent variables) to the difference in the x-values (independent variables) for any 2 points on the line. In our fundraiser, we were fortunate enough to have a celebrity offer to donate a lot of money toward our trip to New York City. When we think about our function rule now, what do we need to take into consideration and why? 1000

16
15 Q’s & C’s NOTES &EXAMPLES Using Slopes and Intercepts We have already learned that the rate of change for a linear function is constant and is known as the slope of a line represented by the letter m, and is a ratio that compares the difference in x-values (independent variables) to the difference in y-values (dependent variables) for any 2 points on the line. In our fundraiser, we were fortunate enough to have a celebrity offer to donate a lot of money towards our trip to New York City. When we think about our function rule now, what do we need to take into consideration and why? Y-INTERCEPT: where the line crosses the Y-AXIS. This point has x-value of 0 and ONLY one y-value. 1000 Initial Value or Starting Point

17
Question(s)/Concept(s) NOTES & EXAMPLES PROCESSING Our school in the City: New York, New York # of Cars (X-VALUES a.k.a Domain) Money accumulated (Y-VALUES a.k.a Range) 1 3 5 7 INPUT (Independent variable) OUTPUT ($$S) (Dependent Variable) Ordered Pair We need to construct a new table of values to graph the new function rule or equation y = 3x+1000. The x-values are already given in the table. Complete the table by determining the range values.

18
Temperature Check

19
Quick Checks 1) Use the table below to find the value of y when x = 5 XY 29 419 629 839 2) Lorenzo needs to construct a table of values to graph the equation y = -2x + 1. The x-values are given below. Which of the following is the correct list of y-values for this table? XY -2 0 1 2 A) 2, 3, 7, 1, 4 B) -5, -3, 0, -1, -3 C) -5, -3, 0, 1, 3 D) 5, 3, 1, -1, -3
 2, 3, 7, 1, 4 B) -5, -3, 0, -1, -3 C) -5, -3, 0, 1, 3 D) 5, 3, 1, -1, -3.")
20
Quick Checks 3) Students are planning to see a movie. Since the students are going as a group, the students are eligible for a group rate for refreshments. The group will pay one fee of $30 upfront, so that every student may receive a snack and a drink. At the local movie theater it cost $12.00 for 2 students to see a movie. It costs $18 for 3 students, and it cost $24.00 for 4 students. a. What is the function rule that relates the number of students to the total cost the group would have to pay, when they go to the local movie theater? Describe what the variables represent. b. What is the initial value? c. What is the rate of change? What does the rate of change represent?

21
Trivia Question WORTH 5 EXTRA CREDIT POINTS Is it true that you have to go either up or down the y-axis first when graphing?

22
Exit Ticket #1 – A group of students are planning a trip to a museum for an exhibit’s opening night. Because it is opening night, the group must pay one fee of $3, and a ticket must be purchased for each student. It costs $16.00 for 2 students’ tickets. It costs $24 for 3 tickets, and it cost $32.00 for 4 tickets. What is the function rule that relates the number of students to the total cost the group would have to pay to enter the exhibit? A) f(x) = 3x + 8 B) f(x) = 3x C) f(x) = 8x - 3 D) f(x) = 8x + 3 #2 – Use the table below to determine the value of y when x = 8 A) 21B) 2 C) 8D) none of above #3- A student needs to construct a table of values to graph the equation y = -3x + 2. Which of the following is the correct list of y-values for this table given the following x- values: 1, 2, 3, 4? A)-1, -4, -7, -10 C) 1, 2, 3, 4 B) 1, 4, 7, 10D) 5, 8, 11, 14 XY 28 413 618
 f(x) = 3x + 8 B) f(x) = 3x C) f(x) = 8x - 3 D) f(x) = 8x + 3 #2 – Use the table below to determine the value of y when x = 8 A) 21B) 2 C) 8D) none of above #3- A student needs to construct a table of values to graph the equation y = -3x + 2. Which of the following is the correct list of y-values for this table given the following x- values: 1, 2, 3, 4. A)-1, -4, -7, -10 C) 1, 2, 3, 4 B) 1, 4, 7, 10D) 5, 8, 11, 14 XY")
23
Practice Makes Perfect Homework: The Independent Practice Problems

24
Independent Practice Answers WordKWL Relation Domain Range Function Independent Variable Dependent Variable Rate of Change

25
Retain for Mastery In your section titled, “Summary,” respond to the following questions, 1) How can we use functions to represent relationships? Retain for Mastery In your section titled, “Summary,” respond to the following questions, 1) How can we use functions to represent relationships?
 How can we use functions to represent relationships .")
Similar presentations
 1 2 3 Value of Term 5 6 7 Position(n)>")


 Functions, Rules, Tables and Graphs>")

 Relation: a set of ordered pairs(mapping, ordered pairs, table, or graphing) Domain:>")


