Download presentation
Presentation is loading. Please wait.

1
1 Population in millions Hispanic Population in the United States: 1970 to 2050 *Projected Population as of July 1 Projections Census Source: U.S. Census Bureau, 1970, 1980, 1990, and 2000 Decennial Censuses; Population Projections, July 1, 2010 to July 1, 2050

2
U.S. Population, by Race and Ethnicity, 2010 and 2000 (thousands) 2010 2000 Hispanic 50,478 [43.0%]* 35,306 White 196,818 [1.2%] 194,553 Black 37,686 [11.0%] 33,948 Asian 14,465 [42.9%] 10,123 American Indian/Alaska Native 2,247 [8.6%] 2,069 Native Hawaiian/Pacific Islander 482 [36.2%] 354 Some other race 604 [29.1%] 468 Two or more races 5,966 [29.6%] 4,602 *--Percentage growth in decade Notes: Racial groups include only non-Hispanics. Hispanics are of any race. Source: Pew Hispanic Center tabulations of U.S. Census Bureau Redistricting_Files-PL_94-171 for states PEW HISPANIC CENTER, March 24, 2011
 Hispanic 50,478 [43.0%]* 35,306 White 196,818 [1.2%] 194,553 Black 37,686 [11.0%] 33,948 Asian 14,465 [42.9%] 10,123 American Indian/Alaska Native 2,247 [8.6%] 2,069 Native Hawaiian/Pacific Islander 482 [36.2%] 354 Some other race 604 [29.1%] 468 Two or more races 5,966 [29.6%] 4,602 *--Percentage growth in decade Notes: Racial groups include only non-Hispanics. Hispanics are of any race. Source: Pew Hispanic Center tabulations of U.S. Census Bureau Redistricting_Files-PL_ for states PEW HISPANIC CENTER, March 24,")
3
US Latinos, 2010 Census --there were 50.3 million in US, [In 1990, pop. was 22.4 & in 2000 it was 35.2] --represent 16.3% of the nation’s pop. --Latino pop. grew by 43% in decade --since 2000, total pop. of country grew by 27.3 mil. & Latinos were 15.1 mil., or 55.3% of the total country’s growth Source: US Census, Jnne 2011

4
US Latinos-- 2011 --Between April ’10, & July ‘11, US pop. grew by 2.8 million, 0.7% per year and smallest percentage increase since 1945 --Births rates among Hispanics, …declined by 17% from 2007 to 2010 [3.8% for Whites and 6.7% for Blacks]. --Rates dropped most sharply among young Hispanics, down by 23 percent for women 20 to 24 between 2007 and 2010. Source: NewYyork Times, Dec. 22, ’11

5
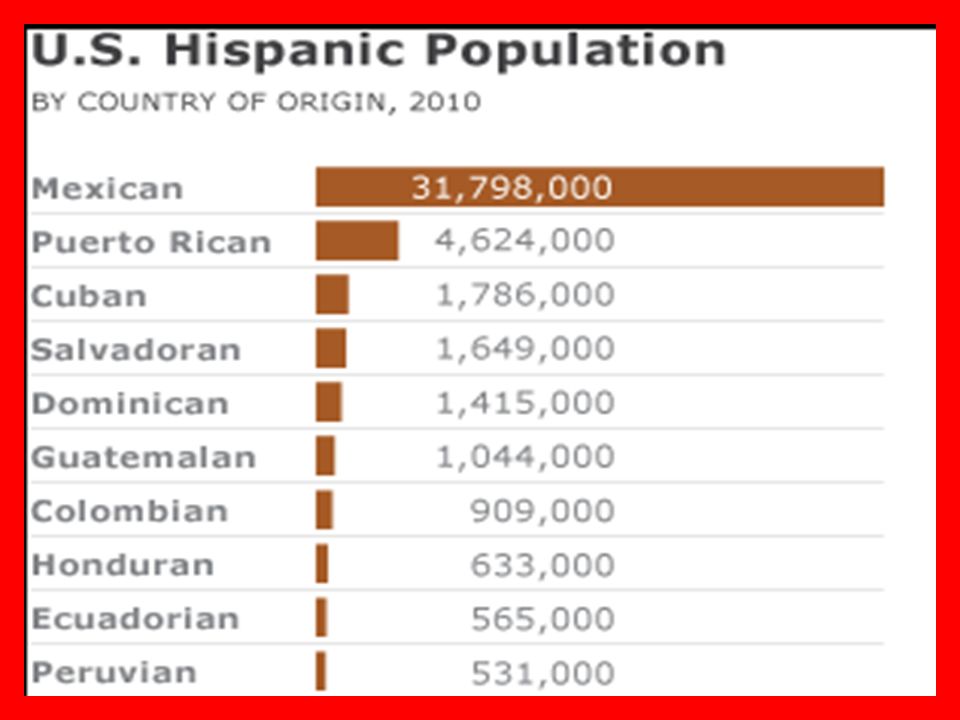
U.S. Hispanic Population Growth, by Country of Origin, 2000-2010 POPULATION GROWTH 2010 2000 Number % All Hispanics 50,478 35,306 15,172 43.0% Guatemalan 1,044 372 672 180.3 Salvadoran 1,649 655 994 151.7 Colombian 909 471 438 93.1 Dominican 1,415 765 650 84.9 Mexican 31,798 20,641 11,158 54.1 Cuban 1,786 1,242 544 43.8 Puerto Rican 4,624 3,406 1,218 35.7 Notes: Hispanic population growth among country of origin groups with a population of 900,000 or more in 2010. Growth rates are computed from unrounded data. Source: 2010 Census and 2000 Census (Ennis, Ríos-Vargas and Albert, 2011) PEW HISPANIC CENTER
 PEW HISPANIC CENTER.")
7
US Latinos, July 1, ‘09 --Median age of Latino pop. is 27.4 yrs., whereas US pop. as a whole is 36.8 --US children younger than 5-yrs-- 26% are Hispanics, whereas 22% of US pop. 18-yrs or younger are Hispanics --107 male Hispanics for every 100- females; in total US pop., 97 males for every 100-females Source: US Census, July 9, 2010

8
US Latinos, July 1, ‘08 --There are 35 million US residents 5- yrs. and older that speak Spanish at home --In AZ, CA, NM, & TX 25% of ALL residents speak Spanish --76% of ALL Hispanics 5-yrs. and older speak Spanish at home, nationally, the figure is 12% Source: US Census, July 9, 2009

9
States with Largest Hispanic Populations, 2010 (thousands) STATE POPULATION California 14,014 Texas 9,461 23,475* [46.5%]** Florida 4,224 New York 3,417 Illinois 2,028 33,144 [65.7%] Arizona 1,895 New Jersey 1,555 Colorado 1,039 New Mexico 953 38,586 [76.4%] Georgia 854 North Carolina 800 Washington 756 40,996 [81.2%] *--Cummulative totals **--Cummulative percent Source: Pew Hispanic Center tabulations of U.S. Census Bureau Redistricting_Files-PL_94-171 for states PEW HISPANIC CENTER, March 24, 2011
![States with Largest Hispanic Populations, 2010 (thousands) STATE POPULATION California 14,014 Texas 9,461 23,475* [46.5%]** Florida 4,224 New York 3,417 Illinois 2,028 33,144 [65.7%] Arizona 1,895 New Jersey 1,555 Colorado 1,039 New Mexico ,586 [76.4%] Georgia 854 North Carolina 800 Washington ,996 [81.2%] *--Cummulative totals **--Cummulative percent Source: Pew Hispanic Center tabulations of U.S.](http://images.slideplayer.com/25/7636079/slides/slide_9.jpg "Census Bureau Redistricting_Files-PL_ for states PEW HISPANIC CENTER, March 24,")
10
US Latinos– 2000 to 2010 --Texas grew by more than four million people in the last decade, with about 65 percent of the growth coming in the Hispanic population. Source: New York Times, Jan. 21, ’12

11
US Latinos, July 1, ‘09 --LA Co. has 4.7 million Latinos, biggest county in US and largest county Hispanic pop. increase = 78,000 Source: US Census, July 9, 2010

12
States with Largest Hispanic Population Growth, 2000-2010 (%) STATE GROWTH, 2000-2010 South Carolina 148 % Alabama 145 Tennessee 134 Kentucky 122 Arkansas 114 North Carolina 111 Maryland 106 Mississippi 106 South Dakota 103 Delaware 96 Georgia 96 Virginia 92 Source: Pew Hispanic Center tabulations of U.S. Census Bureau Redistricting_Files-PL_94-171 for states PEW HISPANIC CENTER, March 24, 2011

13
US Latinos, July 1, ‘09 --Of all Stay-at-home-moms, 27% are Hispanic --10.5 million Hispanic households in the US: 61% include children younger than 18 yrs.; 66% consist of a married couple; 41% have a married couple with children younger than 18 yrs. --69% of Hispanic children live with two married parents --43% of Hispanic couples w/children 18-yrs or younger where both spouses were employed, 50% in 2007 Source: US Census, July 9, 2010

14
States with Largest Hispanic Share of Total Population, 2010 (%) STATE HISPANIC SHARE New Mexico *[5]46.3% Texas 37.6 California 37.6 Arizona [11]29.6 Nevada [6]26.5 Florida [29] 22.5 Colorado [9] 20.7 New Jersey 17.7 New York 17.6 Illinois 15.8 Connecticut 13.4 Utah 13.0 *--Considered `swing’ states in presidential elections, have a total of 60 Electoral College votes Source: Pew Hispanic Center tabulations of U.S. Census Bureau Redistricting_Files-PL_94-171 for states PEW HISPANIC CENTER, March 24, 2011
![States with Largest Hispanic Share of Total Population, 2010 (%) STATE HISPANIC SHARE New Mexico *[5]46.3% Texas 37.6 California 37.6 Arizona [11]29.6 Nevada [6]26.5 Florida [29] 22.5 Colorado [9] 20.7 New Jersey 17.7 New York 17.6 Illinois 15.8 Connecticut 13.4 Utah 13.0 *--Considered `swing’ states in presidential elections, have a total of 60 Electoral College votes Source: Pew Hispanic Center tabulations of U.S.](http://images.slideplayer.com/25/7636079/slides/slide_14.jpg "Census Bureau Redistricting_Files-PL_ for states PEW HISPANIC CENTER, March 24,")
15
Change in Voter Turnout Rates (% among eligible voters) 2010 2006 Change (%points) All 45.5 47.8 -2.3 White 48.6 51.6 -3.0 Black 44.0 41.3 +2.7 Hispanic 31.2 32.3 -1.1 Asian 31.0 32.1 -1.1 Note: White, black and Asian populations include only non-Hispanics who reported a single race. Native Americans and mixed-race groups not shown. Source: Pew Research Center tabulations from the Current Population Survey, November Supplements PEW RESEARCH CENTER

17
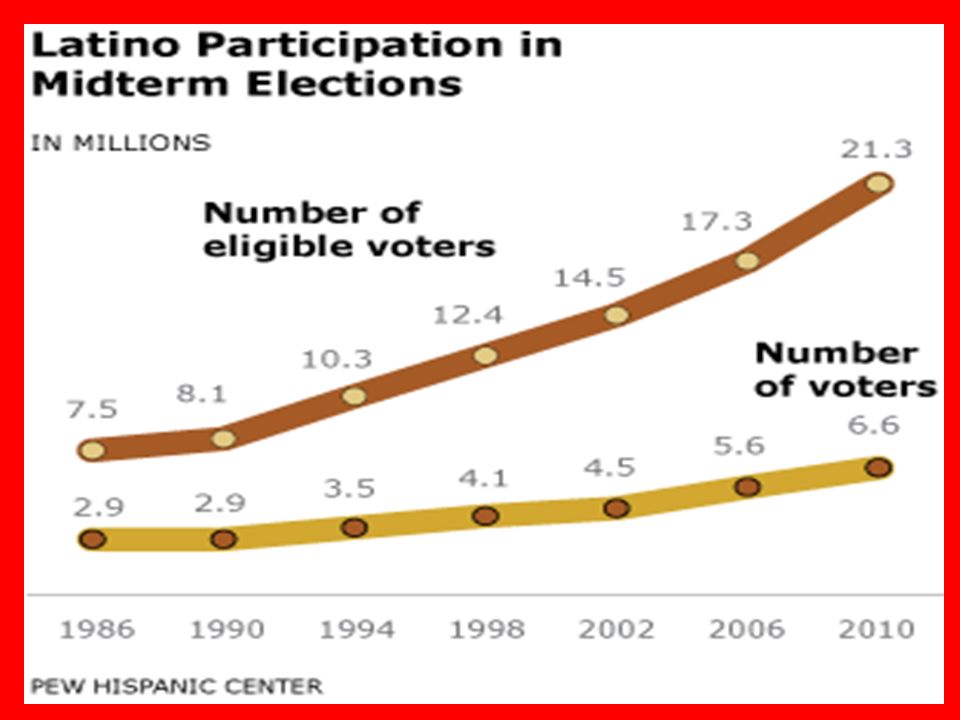
US Latinos --Voting --7.7 million Hispanics voted in the ’04 presidential, while 9.7 million voted in ’08, a 26.% increase or 2 million new voters [a 15.1% increase for African American voters and a 0.5% increase for non-Latino Whites] --California has the largest number of Latino voters, 3 million in ’08 vs. 2.1 million in ’04, a 42.3% increase --50% of Hispanic citizens voted in ‘08 vs. 47% in ’04 Source: US Census, July 9, 2010
![US Latinos --Voting million Hispanics voted in the ’04 presidential, while 9.7 million voted in ’08, a 26.% increase or 2 million new voters [a 15.1% increase for African American voters and a 0.5% increase for non-Latino Whites] --California has the largest number of Latino voters, 3 million in ’08 vs.](http://images.slideplayer.com/25/7636079/slides/slide_17.jpg "2.1 million in ’04, a 42.3% increase --50% of Hispanic citizens voted in ‘08 vs. 47% in ’04 Source: US Census, July 9,")
18
Hispanic Child and Adult Populations, 2010 and 2000 ALL CHILDREN ADULTS Hispanic Population (thousands) 2010 50,478 17,132 33,346 200035,306 12,342 22,964 Hispanic Population Growth, 2000-2010 Growth (thousands) 15,172 4,790 10,382 Growth (%) 43.0 % 38.8% 45.2 % Hispanic Share of Total (%) 2010 16.3% 23.1% 14.2% 2000 12.5% 17.1 % 11.0 % Notes: Children are those younger than 18; Adults are those 18 years of age or older. Source: Pew Hispanic Center tabulations of U.S. Census Bureau Redistricting_Files-PL_94-171 for states PEW HISPANIC CENTER, March 24, 2011

19
US Latinos-- Education* [2009] --Less than 9 th grade = 6.1 Mil. --9 th – 12 th grade = 4.1 --HS Graduate = 6.8 --Some College = 5.8 --College graduate = 3.3 TOTAL = 26.1 *--Hispanics 25-yrs. or older Source: 2009 American Community Survey
![US Latinos-- Education* [2009] --Less than 9 th grade = 6.1 Mil.](http://images.slideplayer.com/25/7636079/slides/slide_19.jpg "--9 th – 12 th grade = HS Graduate = Some College = College graduate = 3.3 TOTAL = 26.1 *--Hispanics 25-yrs. or older Source: 2009 American Community Survey.")
20
US Latinos-- Education* [2009] --Less than 9 th grade = 23.5% [3.0]** --9 th – 12 th grade = 15.5% [6.6] --HS Graduate = 26.0% [29.3] --Some College = 22.2% [30.0] --College graduate = 12.7% [31.1] *--Hispanics 25-yrs, or older **--Percentages for Whites, non-Hispanic Source: 2009 American Community Survey
![US Latinos-- Education* [2009] --Less than 9 th grade = 23.5% [3.0]** --9 th – 12 th grade = 15.5% [6.6] --HS Graduate = 26.0% [29.3] --Some College = 22.2% [30.0] --College graduate = 12.7% [31.1] *--Hispanics 25-yrs, or older **--Percentages for Whites, non-Hispanic Source: 2009 American Community Survey](http://images.slideplayer.com/25/7636079/slides/slide_20.jpg "US Latinos-- Education* [2009] --Less than 9 th grade = 23.5% [3.0]** --9 th – 12 th grade = 15.5% [6.6] --HS Graduate = 26.0% [29.3] --Some College = 22.2% [30.0] --College graduate = 12.7% [31.1] *--Hispanics 25-yrs, or older **--Percentages for Whites, non-Hispanic Source: 2009 American Community Survey")
21
US Latinos-- Education* [2009] --Latinos = 10.9 million [8.2 in `00] --Whites, non-Hispanic = 29.2 [31.9 in `00] --Blacks, non-Hispanic = 7.2 [7.6 in `00] --Asian, non-Hispanic = 2.1 [1.7 in `00] --Other, non-Hispanic = 2.3 [2.0 in `00] --TOTAL = 51.6 [51.4 in `00] *--Enrolled in School, ages 5 to 17 Source: 2009 American Community Survey
![US Latinos-- Education* [2009] --Latinos = 10.9 million [8.2 in `00] --Whites, non-Hispanic = 29.2 [31.9 in `00] --Blacks, non-Hispanic = 7.2 [7.6 in `00] --Asian, non-Hispanic = 2.1 [1.7 in `00] --Other, non-Hispanic = 2.3 [2.0 in `00] --TOTAL = 51.6 [51.4 in `00] *--Enrolled in School, ages 5 to 17 Source: 2009 American Community Survey](http://images.slideplayer.com/25/7636079/slides/slide_21.jpg "US Latinos-- Education* [2009] --Latinos = 10.9 million [8.2 in `00] --Whites, non-Hispanic = 29.2 [31.9 in `00] --Blacks, non-Hispanic = 7.2 [7.6 in `00] --Asian, non-Hispanic = 2.1 [1.7 in `00] --Other, non-Hispanic = 2.3 [2.0 in `00] --TOTAL = 51.6 [51.4 in `00] *--Enrolled in School, ages 5 to 17 Source: 2009 American Community Survey")
22
US Latinos-- Education* [2009] --Latinos = 1.6 million [0.9 in `00] --Native-born = 1.3 [0.7] --Foreign-born = 0.3 [0.2] --Whites, non-Hispanic = 8.4 [6.3 in `00] --Blacks, non-Hispanic = 1.6 [1.0 in `00] --Asian, non-Hispanic = 0.8 [0.6 in `00] --Other, non-Hispanic = 0.4 [0.3 in `00] --TOTAL = 12.7 [9.2 in `00] *--Enrolled in COLLEGES, ages 18 to 24 Source: 2009 American Community Survey
![US Latinos-- Education* [2009] --Latinos = 1.6 million [0.9 in `00] --Native-born = 1.3 [0.7] --Foreign-born = 0.3 [0.2] --Whites, non-Hispanic = 8.4 [6.3 in `00] --Blacks, non-Hispanic = 1.6 [1.0 in `00] --Asian, non-Hispanic = 0.8 [0.6 in `00] --Other, non-Hispanic = 0.4 [0.3 in `00] --TOTAL = 12.7 [9.2 in `00] *--Enrolled in COLLEGES, ages 18 to 24 Source: 2009 American Community Survey](http://images.slideplayer.com/25/7636079/slides/slide_22.jpg "US Latinos-- Education* [2009] --Latinos = 1.6 million [0.9 in `00] --Native-born = 1.3 [0.7] --Foreign-born = 0.3 [0.2] --Whites, non-Hispanic = 8.4 [6.3 in `00] --Blacks, non-Hispanic = 1.6 [1.0 in `00] --Asian, non-Hispanic = 0.8 [0.6 in `00] --Other, non-Hispanic = 0.4 [0.3 in `00] --TOTAL = 12.7 [9.2 in `00] *--Enrolled in COLLEGES, ages 18 to 24 Source: 2009 American Community Survey")
23
US Latinos-- Education* [2009] --Latinos = 1.1 million [0.9 in `00] --Native-born = 0.7 [0.5] --Foreign-born = 0.4 [0.4] --Whites, non-Hispanic = 5.7 [5.2 in `00] --Blacks, non-Hispanic = 1.6 [1.2 in `00] --Asian, non-Hispanic = 0.7 [0.6 in `00] --Other, non-Hispanic = 0.3 [0.3 in `00] --TOTAL = 9.4 [8.2 in `00] *--Enrolled in COLLEGES, ages 25 & OLDER Source: 2009 American Community Survey
![US Latinos-- Education* [2009] --Latinos = 1.1 million [0.9 in `00] --Native-born = 0.7 [0.5] --Foreign-born = 0.4 [0.4] --Whites, non-Hispanic = 5.7 [5.2 in `00] --Blacks, non-Hispanic = 1.6 [1.2 in `00] --Asian, non-Hispanic = 0.7 [0.6 in `00] --Other, non-Hispanic = 0.3 [0.3 in `00] --TOTAL = 9.4 [8.2 in `00] *--Enrolled in COLLEGES, ages 25 & OLDER Source: 2009 American Community Survey](http://images.slideplayer.com/25/7636079/slides/slide_23.jpg "US Latinos-- Education* [2009] --Latinos = 1.1 million [0.9 in `00] --Native-born = 0.7 [0.5] --Foreign-born = 0.4 [0.4] --Whites, non-Hispanic = 5.7 [5.2 in `00] --Blacks, non-Hispanic = 1.6 [1.2 in `00] --Asian, non-Hispanic = 0.7 [0.6 in `00] --Other, non-Hispanic = 0.3 [0.3 in `00] --TOTAL = 9.4 [8.2 in `00] *--Enrolled in COLLEGES, ages 25 & OLDER Source: 2009 American Community Survey")
24
US Latinos-- Education* [2009] --Latinos = 29.1% [20.0% in `00] --Native-born = 35.9% [27.0%] --Foreign-born = 0.3 [0.2%] --Whites, non-Hispanic = 45.7% [35.7% in `00] --Blacks, non-Hispanic = 35.3% [27.3% in `00] --Asian, non-Hispanic = 64.6% [57.8% in `00] --Other, non-Hispanic = 37.7% [33.0% in `00] --TOTAL = 41.7% [33.9% in `00] *--Enrollment RATE in COLLEGES, ages 18 to 24 Source: 2009 American Community Survey
![US Latinos-- Education* [2009] --Latinos = 29.1% [20.0% in `00] --Native-born = 35.9% [27.0%] --Foreign-born = 0.3 [0.2%] --Whites, non-Hispanic = 45.7% [35.7% in `00] --Blacks, non-Hispanic = 35.3% [27.3% in `00] --Asian, non-Hispanic = 64.6% [57.8% in `00] --Other, non-Hispanic = 37.7% [33.0% in `00] --TOTAL = 41.7% [33.9% in `00] *--Enrollment RATE in COLLEGES, ages 18 to 24 Source: 2009 American Community Survey](http://images.slideplayer.com/25/7636079/slides/slide_24.jpg "US Latinos-- Education* [2009] --Latinos = 29.1% [20.0% in `00] --Native-born = 35.9% [27.0%] --Foreign-born = 0.3 [0.2%] --Whites, non-Hispanic = 45.7% [35.7% in `00] --Blacks, non-Hispanic = 35.3% [27.3% in `00] --Asian, non-Hispanic = 64.6% [57.8% in `00] --Other, non-Hispanic = 37.7% [33.0% in `00] --TOTAL = 41.7% [33.9% in `00] *--Enrollment RATE in COLLEGES, ages 18 to 24 Source: 2009 American Community Survey")
25
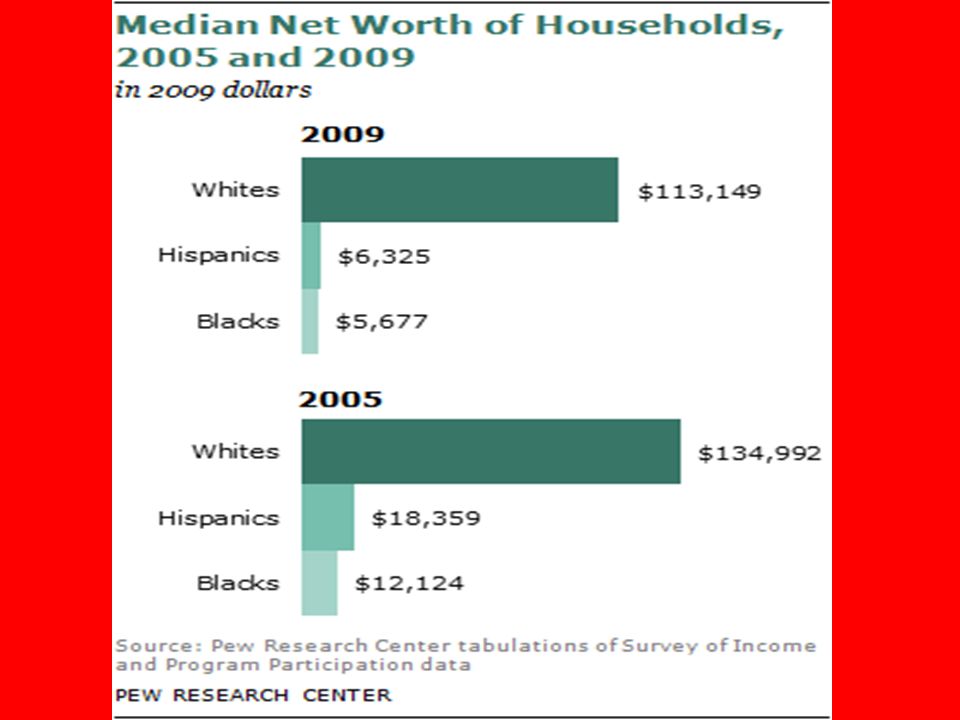
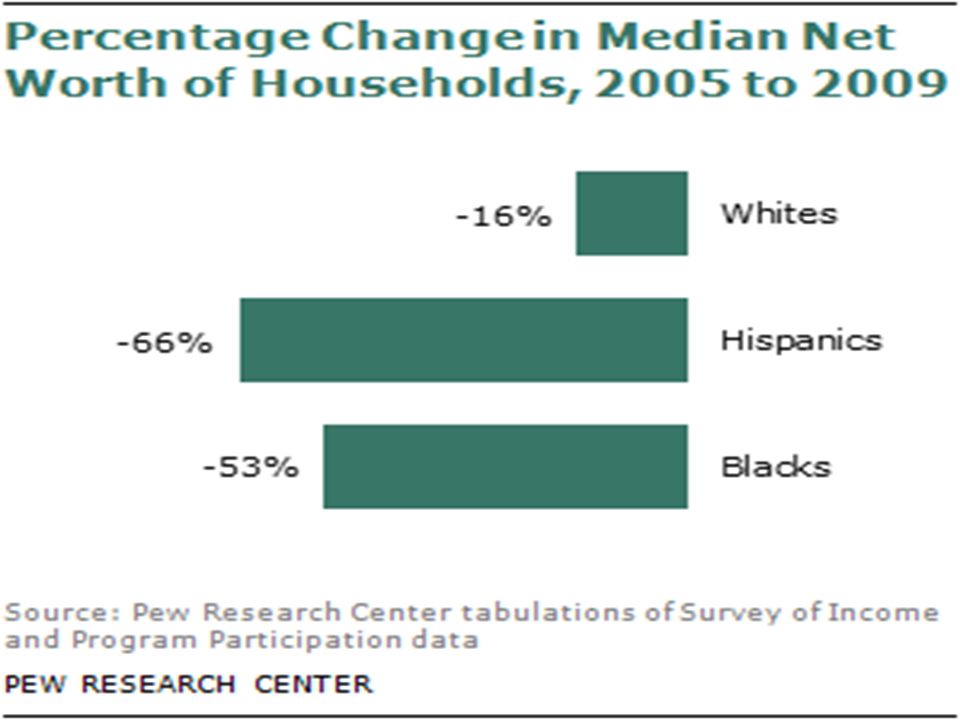
US Latinos --Declining Status --”Over the past two decades, Hispanics have moved from the middle of the socioeconomic hierarchy, between blacks and whites, to a position below both. On virtually every indicator of socioeconomic welfare, Hispanics fell relative to blacks.” Source: Massey, Douglas,Ss., “Isolated, Vulnerable And Broke”, Op-Ed., New York Times, August 5, 2011

26
US Latinos, July 1, ‘09 --The median income of Hispanic households is $37,913[’08], down 5.6% from ‘07 --The poverty rate for Hispanics is 23.2% [’08], up down from 21.7% in ‘07 --The percentage of Hispanic households without health insurance is 30.7%[’08], down from 32.1% in ‘07 Source: US Census, July 9, 2010
![US Latinos, July 1, ‘09 --The median income of Hispanic households is $37,913[’08], down 5.6% from ‘07 --The poverty rate for Hispanics is 23.2% [’08], up down from 21.7% in ‘07 --The percentage of Hispanic households without health insurance is 30.7%[’08], down from 32.1% in ‘07 Source: US Census, July 9, 2010](http://images.slideplayer.com/25/7636079/slides/slide_26.jpg "US Latinos, July 1, ‘09 --The median income of Hispanic households is $37,913[’08], down 5.6% from ‘07 --The poverty rate for Hispanics is 23.2% [’08], up down from 21.7% in ‘07 --The percentage of Hispanic households without health insurance is 30.7%[’08], down from 32.1% in ‘07 Source: US Census, July 9, 2010")
29
Wisconsin Hispanics Between 2000 and 7-1-’09, Wisconsin’s population grew by 291,066 [5.43%] and of those, 106,202 were Hispanics, representing 36.5% of the total growth. The Hispanic population grew by 55%, ten-times the rate of the entire state. In Milwaukee Co. the growth rate was 42.3% Source: US Census, July 9. 2010
![Wisconsin Hispanics Between 2000 and 7-1-’09, Wisconsin’s population grew by 291,066 [5.43%] and of those, 106,202 were Hispanics, representing 36.5% of the total growth.](http://images.slideplayer.com/25/7636079/slides/slide_29.jpg "The Hispanic population grew by 55%, ten-times the rate of the entire state. In Milwaukee Co. the growth rate was 42.3% Source: US Census, July")
30
Wisconsin Hispanics --Pop. Estimate in 2009 = 5.655 million --Hispanic Pop. Estimate in ’09 = 299,123, 5.3% of state’s population --WI Latinos represent 0.6% of US Latino pop., 24 th in country --66% of WI Latinos are Native-Born --79% of WI Hispanics are of Mexican heritage --Median age of WI Latinos is 25-yrs….16 for Native-born and 35 for foreign-born, non-Hispanic whites = 41-yrs Source: US Census, July 9, 2008

31
Wisconsin Hispanics --Pop. Estimate in 2009 = 5.655 million --Hispanic Pop. Estimate in ’09 = 299,123, 5.3% of state’s population --WI Latinos represent 0.6% of US Latino pop., 24 th in country --66% of WI Latinos are Native-Born --79% of WI Hispanics are of Mexican heritage --Median age of WI Latinos is 25-yrs….16 for Native-born and 35 for foreign-born, non-Hispanic whites = 41-yrs Source: US Census, July 9, 2008

32
WI Latino Pop.200020092000 to 2009 Change2000 to 2007 Change CensusEstimateNumberPercentNumber Percent Milwaukee County82,406117,28234,87642.3%27,09032.9% Dane County14,38725,28310,89675.7%8,59259.7% Racine County14,99021,4536,46343.1%5,11634.1% Kenosha County10,75716,6405,88354.7%4,69543.6% Brown County8,69816,2987,60087.4%5,88667.7% Waukesha County9,50314,1974,69449.4%3,62838.2% Rock County5,95310,5344,58177.0%3,81064.0% Walworth County6,1369,4973,36154.8%2,73344.5% Sheboygan County3,7896,0732,28460.3%1,86549.2% Winnebago County3,0655,3632,29875.0%1,75657.3% Top Ten Totals159,684242,62082,93651.9%65,17149.1% Wisconsin Total 192,921299,123106,20255.0%83,82263.0%

33
--In 2009, top ten counties have 81.1% of total state Latino pop. --All 72-counties [with exception of Marquette Co.] had increases in the Latino pop. between ‘00 & ‘09 --Two-counties had increases of 200% or more in Latino pop. between ‘00 & ‘09 --Nine-counties had increases of 100% or more in Latino pop. between ‘00 & ‘09 --Milwaukee Co. had the largest numerical increase between ‘00 & ‘09 = 34, 900

34
--Total WI Latino pop. In 2009 = 299,123 --Percent of WI Latinos that are 9-yrs or younger is 24.8% --Percent of WI Latinos that are 19-yrs or younger is 42.9%

35
2009 Wisconsin Latino Populations Age Estimates, US Census, July 10, 2010 MalesFemalesTotal Percent 0 to 420,14419,40439,54813.22% 5 to 917,42917,24634,67511.59% 10 to 1414,51213,89028,4029.50% 15 to 1913,50812,34225,8508.64% 20 to 2413,28411,39624,6808.25% 25 to 2914,89011,77026,6608.91% 30 to 3415,09511,48226,5778.88% 35 to 3913,0439,90422,9477.67% 40 to 4410,4938,23818,7316.26% 45 to 498,1916,69714,8884.98% 50 to 546,2615,20411,4653.83% 55 to 594,3253,9228,2472.76% 60 to 642,9372,6515,5881.87% 65 to 691,7511,8543,6051.21% 70 to 741,2301,4422,6720.89% 75 to 799091,0311,9400.65% 80 to 846217291,3500.45% 85 +5217771,2980.43% Totals159,144139,979299,123

36
Milwaukee Hispanics, 2009 --Milwaukee Co Pop. Estimate is 959,521 --Milwaukee Co. Hispanic Pop. Estimate in ’09 is 117,282, representing 12.2% of county’s pop. --From 2000 to 2009, Milwaukee Co. pop. grew by 189,968, while Latino pop. grew by 34,836, 18.3% of total growth and growing by 42.3%, almost twice the rate of entire county’s growth --Between 1990 and 2000, Milwaukee Co. pop. declined by 19,000, while Latino pop. grew by 37, 700 Source: US Census, July 9, 2010

37
37

38
38

39
39

40
40

41
Latinos and The Census Is it Race or Ethnicity? 1960 1970 1980 1990 2000 Race (one-race); No Data Collected for Latinos Race (one-race);Spanish Origin Yes or No Race (one-race); Spanish/Hispanic Origin Mex/PR/Cuban/Other Race (one-race); Hispanic Origin Mex/PR/Cuban/Fill-in-the-Blank Race (multi-race); Hispanic/Latino Mex/PR/Cuban/Fill-in-the-Blank “Latinos Can be of Any Race”
; No Data Collected for Latinos Race (one-race);Spanish Origin Yes or No Race (one-race); Spanish/Hispanic Origin Mex/PR/Cuban/Other Race (one-race); Hispanic Origin Mex/PR/Cuban/Fill-in-the-Blank Race (multi-race); Hispanic/Latino Mex/PR/Cuban/Fill-in-the-Blank Latinos Can be of Any Race .")
42
American WhiteBlackIndianAsianOther2+ Races United States 16,839,535654,510356,783140,04614,989,3722,258,185 47.8%1.9%1.0%0.4%42.5%6.4% Wisconsin 85,9043,5063,57571781,42815,919 45.0%1.8%1.9%0.4%42.6%8.3% Latinos Challenge the American Racial Paradigm Almost Half of Latinos Do Not Define Themselves in Classic American Racial Terms

43
Review Questions 1.) Why is Latino population growing so much? 2.) What percent of the WI population are Latinos? 3.) What is the primary country of origin of most US Latino? 4.) Is there a shortage of Latino teachers? Why? 5.) What % of the total US Latino pop. live in WI? 6.) What can we conclude of the census “box” choices of Latinos? 7.) What does the future hold for the millions of Latinos under 18-yrs. of age?
 What percent of the WI population are Latinos. 3.) What is the primary country of origin of most US Latino. 4.) Is there a shortage of Latino teachers. Why. 5.) What % of the total US Latino pop. live in WI. 6.) What can we conclude of the census box choices of Latinos. 7.) What does the future hold for the millions of Latinos under 18-yrs. of age .")
Similar presentations