Download presentation
Presentation is loading. Please wait.

1
Advanced Methods and Analysis for the Learning and Social Sciences PSY505 Spring term, 2012 April 2, 2012

2
Today’s Class Learning Curves

3
The Classic Learning Curve

4
Assumptions The student is practicing the same skill several times in the same fashion

5
Assumptions The student is practicing the same skill several times in the same fashion In what kinds of learning situations does this occur?

6
Assumptions Similar methods and considerations apply to situations where the student is recalling the same knowledge several times

7
Assumptions We have some way to measure student performance over time – Speed or accuracy

8
Learning LISP programming in the LISP Tutor (Corbett & Anderson, 1995)
")
9
Learning in Cognitive Tutor Geometry (Ritter et al., 2007)
")
10
A certain characteristic pattern

11
Power Law of Learning*

12
Performance (both speed and accuracy) improves with a power function
 improves with a power function")
13
Power Law of Learning* * -- may be an exponential function rather than a power function

14
Called Power Law Because speed and accuracy both follow a power curve Radical improvement at first which slows over time towards an asymptote Passing the asymptote usually involves developing entirely new strategy

15
Passing the Asymptote Famous example: Fosbury Flop http://www.youtube.com/watch?v=Id4W6VA0uLc

16
Passing the Asymptote Famous example: Fosbury Flop Can you think of any other examples?

17
Power Law of Learning proven to apply across many domains Simple domains – Pressing correct button on stimulus Complex problem-solving domains – Math – Programming Real-world domains – Cigar-making in factories (Crossman, 1959)
")
18
Real-world data Are rarely perfectly smooth… (At least not without hundreds of students or more)
")
19
Example from a minute ago

20
Making inference from learning curves

21
Via visual inspection of the curve form

22
“Normal learning”

23
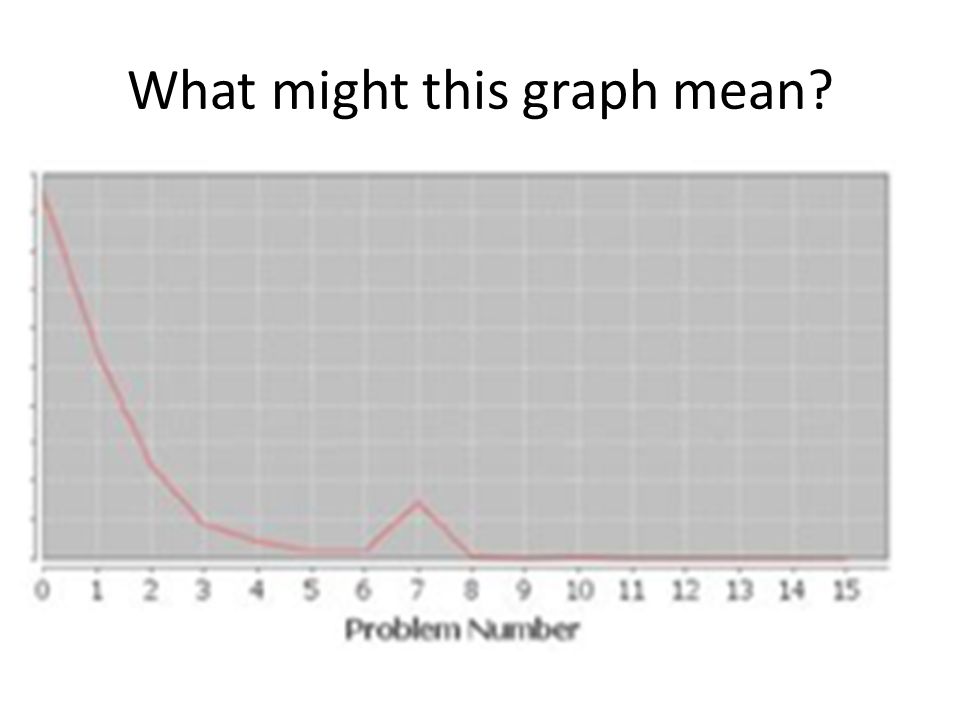
What might this graph mean?

24
No learning going on

25
Why might this be occurring?

26
What might this graph mean?

27
Student has already learned skill for the most part

28
What might this graph mean?

29
Student learned a new strategy and “broke through” the asymptote

30
What might this graph mean?

31
Two skills treated as the same skill (Corbett & Anderson, 1995)
")
32
Uses To study and refine item-skill mappings in educational software Pittsburgh Science of Learning Center DataShop (Koedinger et al., 2010) is a common tool for doing this But you can also do it in Excel!
 is a common tool for doing this But you can also do it in Excel!")
33
Any questions?

34
Moment-by-Moment Learning Curves Based on models that infer probability that student learned skill at each practice opportunity (Baker, Goldstein, & Heffernan, 2010, in press)
")
35
How does it work? The model takes an action, and the probability the student knows the skill at that point, according to Bayesian Knowledge Tracing (Corbett & Anderson, 1995) The model looks at the next two actions and applies Bayes’ Theorem
 The model looks at the next two actions and applies Bayes’ Theorem.")
36
High-Level 5% probability student knew skill W W W – Skill was probably not learned at red action

37
High-Level 90% probability student knew skill R R R – Skill was probably not learned at red action

38
High-Level 30% probability student knew skill R R R – Skill was quite possibly learned at red action (or previous action)
")
39
High-Level 30% probability student knew skill W R R – Skill was quite possibly learned at red action (or next action)
")
40
High-Level 30% probability student knew skill W W R – Skill was probably not learned at red action

41
The model algorithm… Is out of scope for today – The math can take a while But what it gives us is moment-by-moment assessments of learning

42
Model Correlates to probability of learning Though it underestimates high probabilities of learning – E.g. for “true values” of 20% and 5%, it might predict 6% and 3% Predicts final knowledge and preparation for future learning (Baker, Goldstein, & Heffernan, 2010; Baker, Gowda, & Corbett, 2011)
.")
43
Can be used to create a Moment-by-Moment Learning Curve X axis: Opportunity to practice skill Y axis: Moment-by-Moment learning assessments

44
Moment-by-moment learning curves Are meaningful to interpret for individual students Much harder to do this with traditional learning curves – Accuracy = 0 or 1 – Time much more vulnerable to noise

45
Let’s look at a few graphs

46
What might this graph mean?

47
Steady learning

48
Corresponds to

49
What might this graph mean?

50
A Eureka moment

51
What would that model correspond to In a traditional learning curve?

52
What might this graph mean?

54
Skill already known but need to map it into current learning situation

55
What might this graph mean?

56
Multiple skills treated as a single skill

57
Corresponds to

58
What might this graph mean?

59
Thanks for your ideas – it’s a mystery to me…

60
(It turns out to be quite common)
")
61
Uses Any ideas what you could use this for?

62
Uses To study relationships between learning trajectories and learning outcomes

63
Uses If you catch a spike, you can infer learning early – Potentially using this information to “skip a student ahead”

64
Any questions?

65
Asgn. 9 Questions? Comments?

66
Next Class Wednesday, April 4 3pm-5pm AK232 Discovery with Models Readings Baker, R.S.J.d., Gowda, S.M. (2010) An Analysis of the Differences in the Frequency of Students' Disengagement in Urban, Rural, and Suburban High Schools. Proceedings of the 3rd International Conference on Educational Data Mining, 11-20. Assignments Due: None
 An Analysis of the Differences in the Frequency of Students Disengagement in Urban, Rural, and Suburban High Schools. Proceedings of the 3rd International Conference on Educational Data Mining, Assignments Due: None.")
67
The End

Similar presentations