Download presentation
Presentation is loading. Please wait.

1
Probabilistic & Statistical Techniques Eng. Tamer Eshtawi First Semester 2007-2008 Eng. Tamer Eshtawi First Semester 2007-2008

2
Lecture 10 Chapter 6 (part 1) Normal Probability Distribution Main Reference: Pearson Education, Inc Publishing as Pearson Addison-Wesley.
 Normal Probability Distribution Main Reference: Pearson Education, Inc Publishing as Pearson Addison-Wesley.")
3
Section 6-1 Overview

4
Continuous Probability Distributions Continuous Probability Distribution – areas under curve correspond to probabilities for x Do you see the similarity in shape between the continuous and discrete probability distributions?

5
Chapter focus is on: Continuous random variables Normal distributions Overview

6
Section 6-2 The Standard Normal Distribution

7
Key Concept This section presents the standard normal distribution which has three properties: 1. It is bell-shaped. 2. It has a mean equal to 0. 3. It has a standard deviation equal to 1. It is extremely important to develop the skill to find areas (or probabilities or relative frequencies) corresponding to various regions under the graph of the standard normal distribution.
 corresponding to various regions under the graph of the standard normal distribution..")
8
The Uniform Distribution Uniform Probability Distribution – distribution resulting when a continuous random variable is evenly distributed over a particular interval Probability Distribution for a Uniform Random Variable x Probability density function: Mean:Standard Deviation:

9
A density curve is the graph of a continuous probability distribution. It must Satisfy the following properties: Definition 1. The total area under the curve must equal 1. 2. Every point on the curve must have a vertical height that is 0 or greater. (That is, the curve cannot fall below the x-axis.)
.")
10
Using Area to Find Probability

11
Definition standard normal distribution 0 1 1 The standard normal distribution is a probability distribution with mean equal to 0 and standard deviation equal to 1, and the total area under its density curve is equal to 1.

12
Table A-2 - Example

13
z Score Distance along horizontal scale of the standard normal distribution; refer to the leftmost column and top row of Table A-2. Area Region under the curve; refer to the values in the body of Table A-2. Using Table A-2

14
If thermometers have an average (mean) reading of 0 degrees and a standard deviation of 1 degree for freezing water, and if one thermometer is randomly selected, Find the probability that, at the freezing point of water, the reading is less than 1.58 degrees. Example 1- Thermometers

15
P( z < 1.58) = Example - Cont
 = Example - Cont")
16
Look at Table A-2

17
The probability that the chosen thermometer will measure freezing water less than 1.58 degrees is 0.9429. P ( z < 1.58) = 0.9429 Example 1- cont 94.29% of the thermometers have readings less than 1.58 degrees.
 = Example 1- cont 94.29% of the thermometers have readings less than 1.58 degrees..")
18
find the probability that it reads (at the freezing point of water) above –1.23 degrees. If thermometers have an average (mean) reading of 0 degrees and a standard deviation of 1 degree for freezing water, and if one thermometer is randomly selected, find the probability that it reads (at the freezing point of water) above –1.23 degrees. The probability that the chosen thermometer with a reading above -1.23 degrees is 0.8907. P ( z > – 1.23) = 0.8907 Example 1- cont
 reading of 0 degrees and a standard deviation of 1 degree for freezing water, and if one thermometer is randomly selected, find the probability that it reads (at the freezing point of water) above –1.23 degrees. The probability that the chosen thermometer with a reading above degrees is P ( z > – 1.23) = Example 1- cont.")
19
Find the probability that it reads (at the freezing point of water) between –2.00 and 1.50 degrees. A thermometer is randomly selected. Find the probability that it reads (at the freezing point of water) between –2.00 and 1.50 degrees. P (z < – 2.00) = 1- P (z < 2.00) = 1-0.9772 = 0.0228 P (z < 1.50) = 0.9332 P ( – 2.00 < z < 1.50) = 0.9332 – 0.0228 = 0.9104 Example 1- cont
 between –2.00 and 1.50 degrees. P (z < – 2.00) = 1- P (z < 2.00) = = P (z < 1.50) = P ( – 2.00 < z < 1.50) = – = Example 1- cont.")
20
P( a < z < b ) denotes the probability that the z score is between a and b. P( z > a ) denotes the probability that the z score is greater than a. P( z < a ) denotes the probability that the z score is less than a. Notation
 denotes the probability that the z score is greater than a. P( z < a ) denotes the probability that the z score is less than a. Notation.")
21
Finding a z Score When Given a Probability Using Table A-2 1. Draw a bell-shaped curve, draw the centerline, and identify the region under the curve that corresponds to the given probability. If that region is not a cumulative region from the left, work instead with a known region that is a cumulative region from the left. 2.Using the cumulative area from the left, locate the closest probability in the body of Table A-2 and identify the corresponding z score.

22
Finding z Scores When Given Probabilities 5% or 0.05 (z score will be positive) Find the 95 th Percentile z =1.645
 Find the 95 th Percentile z =1.645")
23
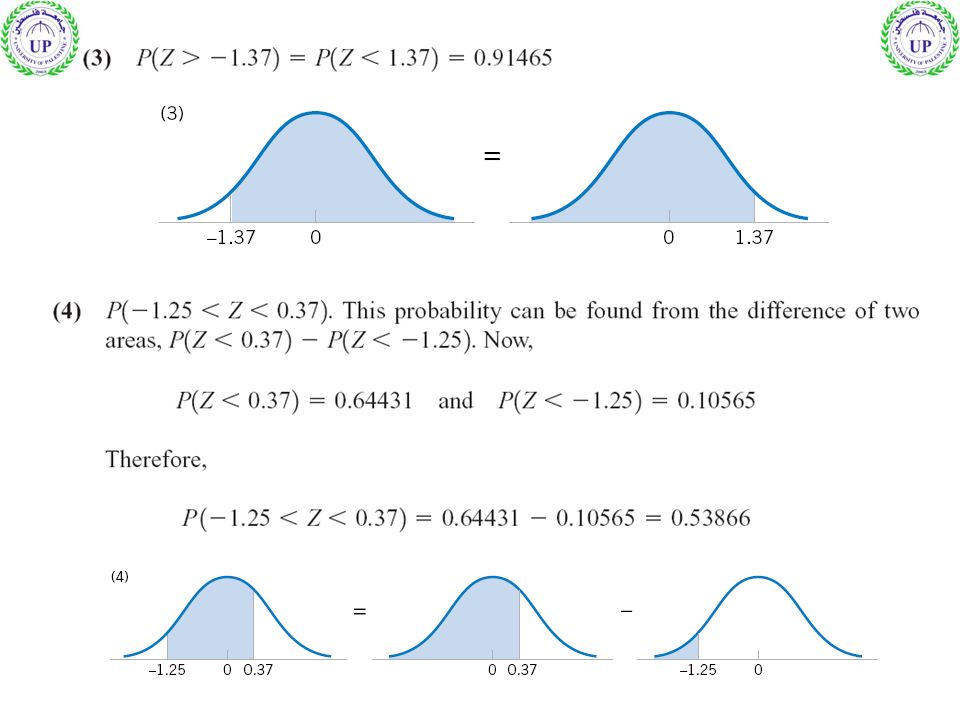
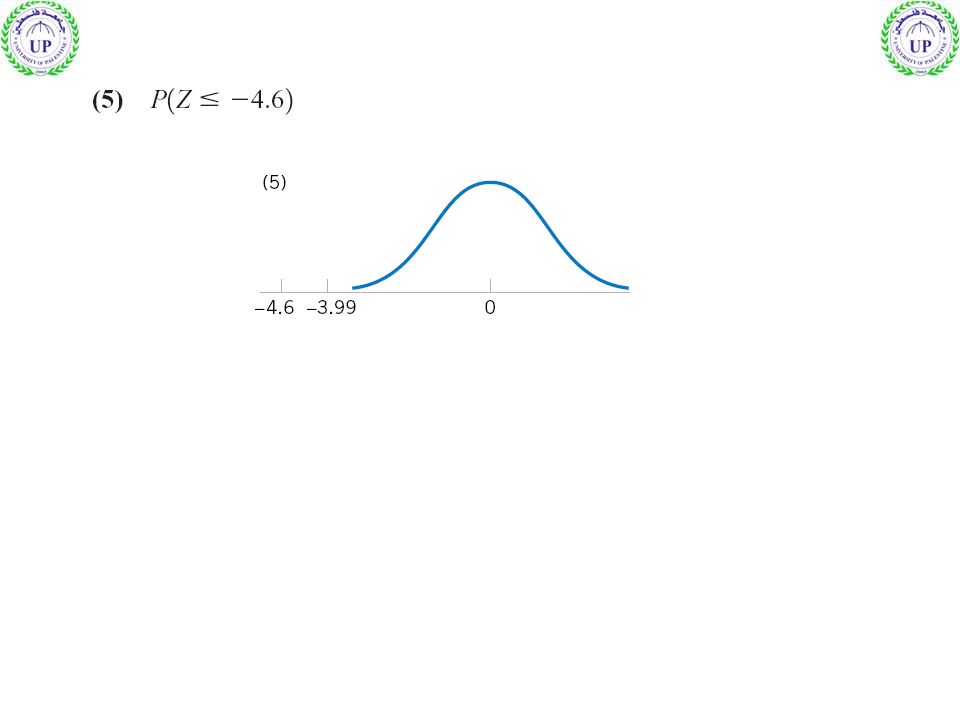
Example 2 Compute the following probabilities for a random variable z with the standard normal distribution.

26
Table A-2 - Example

27
Section 6-3 Applications of Normal Distributions

28
Key Concept This section presents methods for working with normal distributions that are not standard. That is, the mean is not 0 or the standard deviation is not 1, or both. The key concept is that we can use a simple conversion that allows us to standardize any normal distribution so that the same methods of the previous section can be used.

29
Converting to a Standard Normal Distribution

30
Weights of Water Taxi Passengers, Weights of Water Taxi Passengers, Assume also that the weights of the passengers are normally distributed with a mean of 172 pounds and standard deviation of 29 pounds. If one passenger is randomly selected, what is the probability he weighs less than 174 pounds? Weights of Water Taxi Passengers Example 3 Weights of Water Taxi Passengers

31
Example 3- cont P ( x < 174 lb.) = P(z < 0.07) = 0.5279
 = P(z < 0.07) =")
32
Look at Table A-2

33
Find P (115< x < 140) Example 4
 Example 4")
34
z scores z scores 1. Don’t confuse z scores and areas. z scores are distances along the horizontal scale, but areas are regions under the normal curve. Table A-2 lists z scores in the left column and across the top row, but areas are found in the body of the table. 2. Choose the correct (right/left) side of the graph. z score 3. A z score must be negative whenever it is located in the left half of the normal distribution. 4. Areas (or probabilities) are positive or zero values, but they are never negative. Cautions to Keep in Mind
 side of the graph. z score 3. A z score must be negative whenever it is located in the left half of the normal distribution. 4. Areas (or probabilities) are positive or zero values, but they are never negative. Cautions to Keep in Mind.")
35
Procedure for Finding Values (x) for given p(z) Using Table A-2 1. Sketch a normal distribution curve, enter the given probability or percentage in the appropriate region of the graph. 2.Use Table A-2 to find the z score corresponding to the cumulative left area bounded by x. Refer to the body of Table A-2 to find the closest area, then identify the corresponding z score. 3. From z score find x using : (If z is located to the left of the mean, be sure that it is a negative number.) 4. Refer to the sketch of the curve to verify that the solution makes sense in the context of the graph and the context of the problem.
 4. Refer to the sketch of the curve to verify that the solution makes sense in the context of the graph and the context of the problem..")
36
Use the data from the previous example 2 to determine what weight (x) separates the lightest 99.5% from the heaviest 0.5%? Example 5: Lightest and Heaviest

37
Example 6 The diameter of a shaft in an optical storage drive is normally distributed with mean 0.2508 inch and standard deviation 0.0005 inch. The specifications on the shaft are 0.2500 0.0015 inch. What proportion of shafts conforms to specifications?

38
Flash points

39
Assume that the weight loss for the first month of a diet program varies between 6 pounds and 12 pounds, and is spread evenly over the range of possibilities, so that there is a uniform distribution. Find the probability of losing less than 10 pounds. A. 5/7 B. 2/3 C. 1/3 D. 1/6

Similar presentations


 = >")


