Download presentation
Presentation is loading. Please wait.

1
Biodiversity

2
Why is Biodiversity Important? Genetic diversity:

3
Why is Biodiversity Important? Species Diversity:

4
Why is Biodiversity Important? Ecosystem Diversity:

5
Diversity = Richness + Evenness richness: count of # species evenness: relative abundance of species Ecosystem AEcosystem B 4 oak species3 oak species bl oak = 40 bl oak = 120 wh oak = 30wh oak = 60r oak = 20 pin oak = 10pin oak = 0

6
A = B = alpha ( ) diversity – within habitat C = beta ( ) diversity – among habitat D = gamma ( ) diversity – geographic scale Three Scales of Diversity
 diversity – within habitat C = beta ( ) diversity – among habitat D = gamma ( ) diversity – geographic scale Three Scales of Diversity")
7
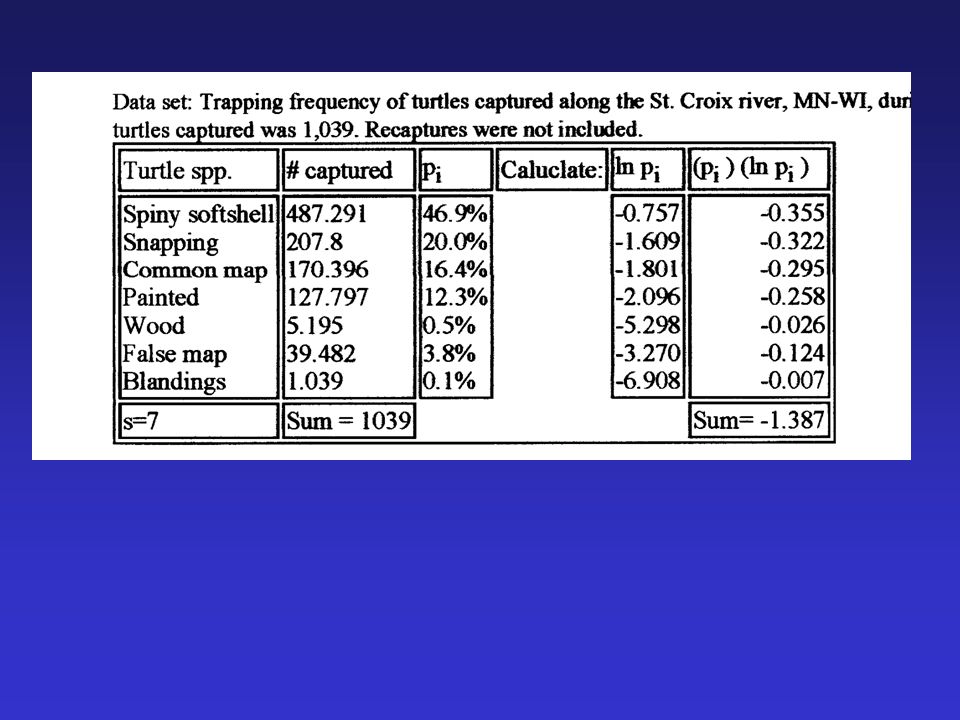
Alpha & Gamma Species Diversity Indices Shannon-Wiener Index – most used -sensitive to change in status of rare species H’ = diversity of species (range 0-1+) s = # of species p i = proportion of total sample belonging to ith species
 s = # of species p i = proportion of total sample belonging to ith species")
8
Alpha & Gamma Species Diversity Indices Shannon-Wiener Index

10
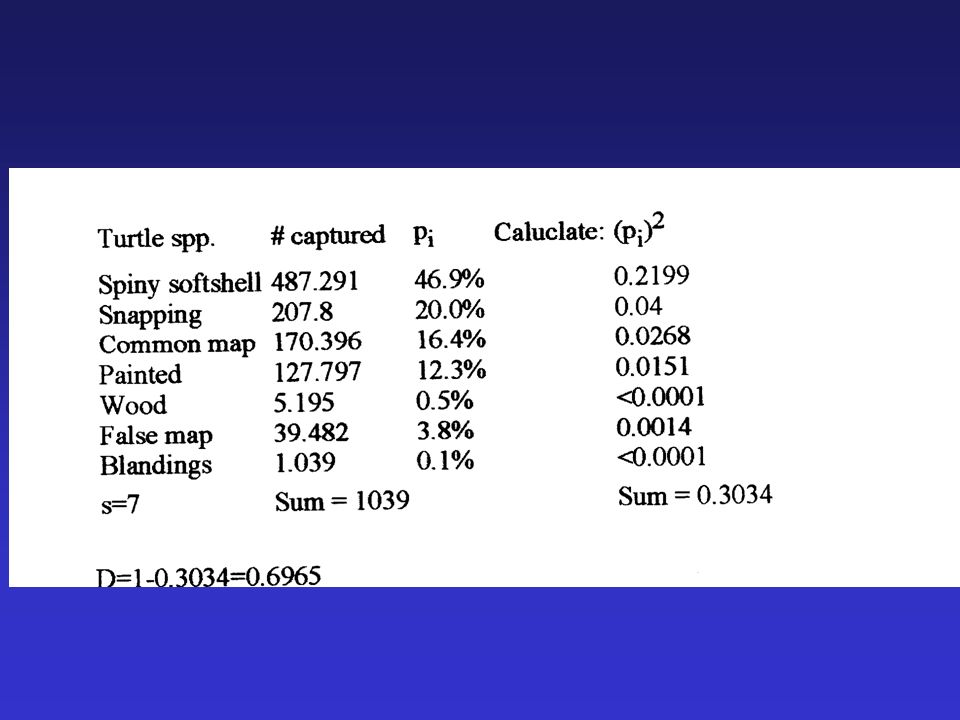
Alpha & Gamma Species Diversity Indices Simpson Index – sensitive to changes in most abundant species D = diversity of species (range 0-1) s = # of species p i = proportion of total sample belonging to ith species
 s = # of species p i = proportion of total sample belonging to ith species")
11
Alpha & Gamma Species Diversity Indices Simpson Index

13
Alpha & Gamma Species Diversity Indices Species Evenness H’ max = maximum value of H’ = ln(s)
")
14
Beta Species Diversity Indices Sorensen’s Coefficient of Community Similarity – weights species in common S s = coefficient of similarity (range 0-1) a = # species common to both samples b = # species in sample 1 c = # species in sample 2
 a = # species common to both samples b = # species in sample 1 c = # species in sample 2")
15
Beta Species Diversity Indices Sorensen’s Coefficient of Community Similarity Dissimilarity = D S = b + c / 2a + b + c Or 1.0 - S s

16
SpeciesSample 1Sample 2 111 210 311 400 511 600 700 810 911 1000 1111 1200

17
Sorensen’s Coefficient Sample 1 –Total occurrences = b = 7 -# joint occurrences = a = 5 Sample 2 –Total occurrences = c = 5 -# joint occurrences = a = 5 S s = 2 * 5 / 10 + 7 + 5 = 0.45 (45%) D s = 1 – 0.45 = 0.55 (55%)
 D s = 1 – 0.45 = 0.55 (55%)")
18
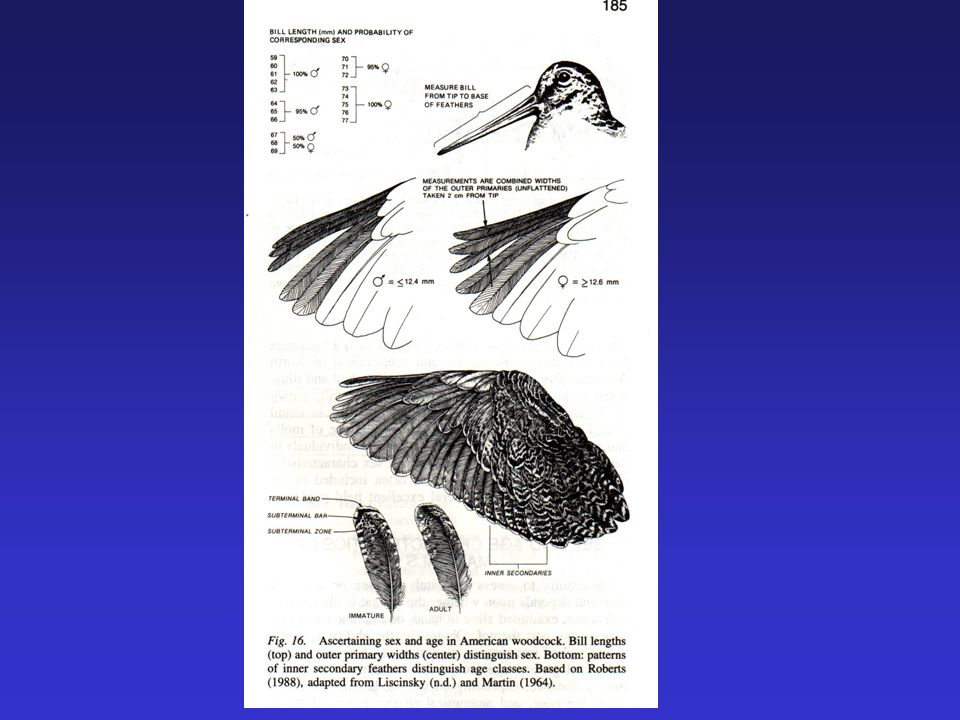
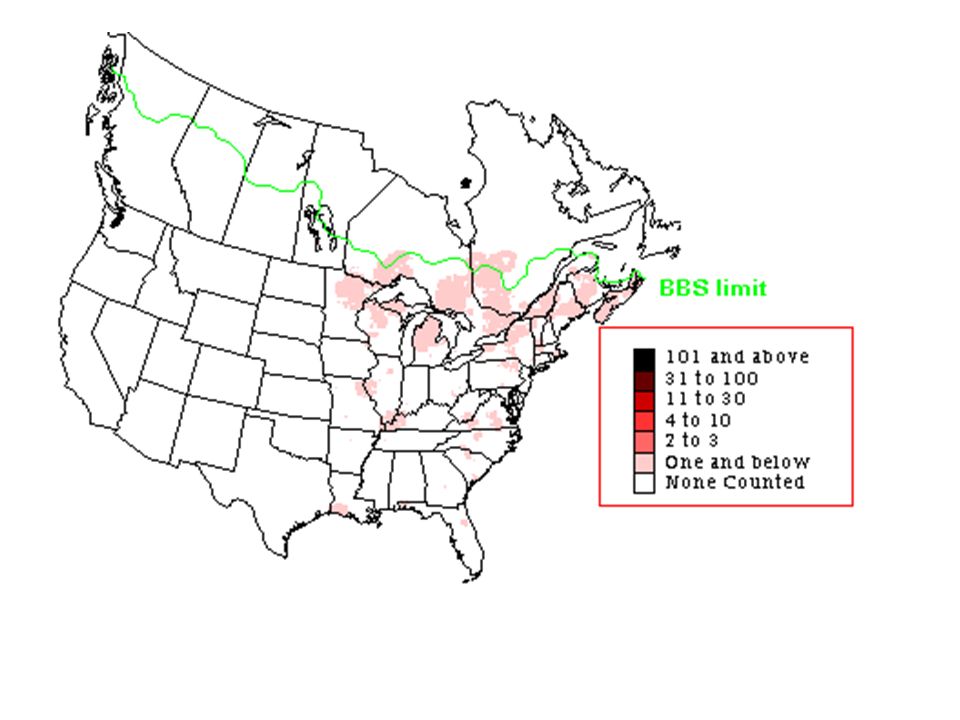
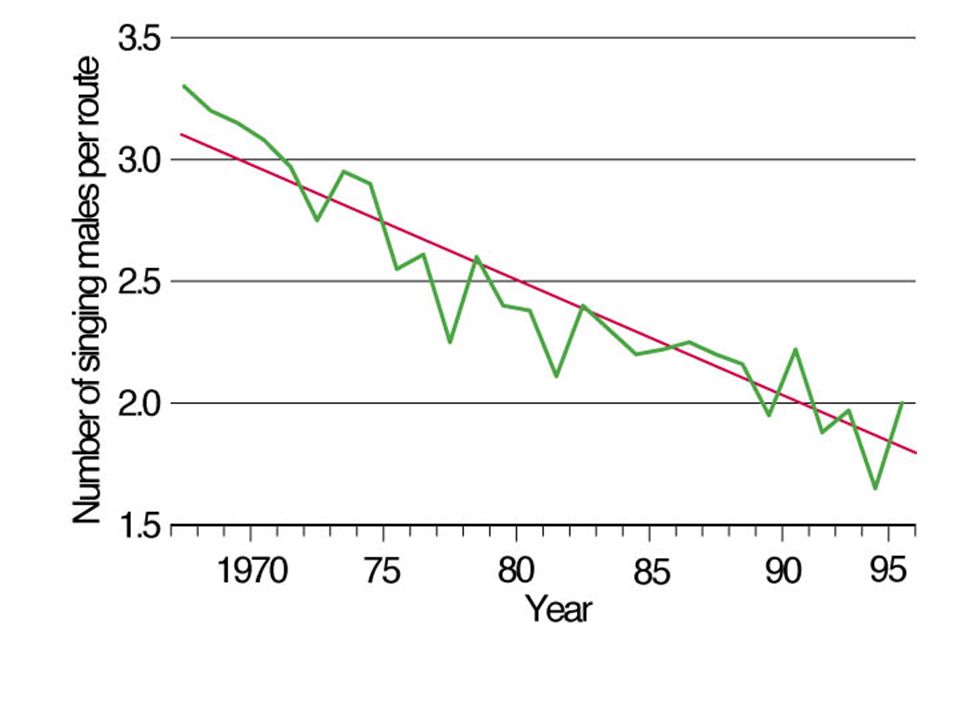
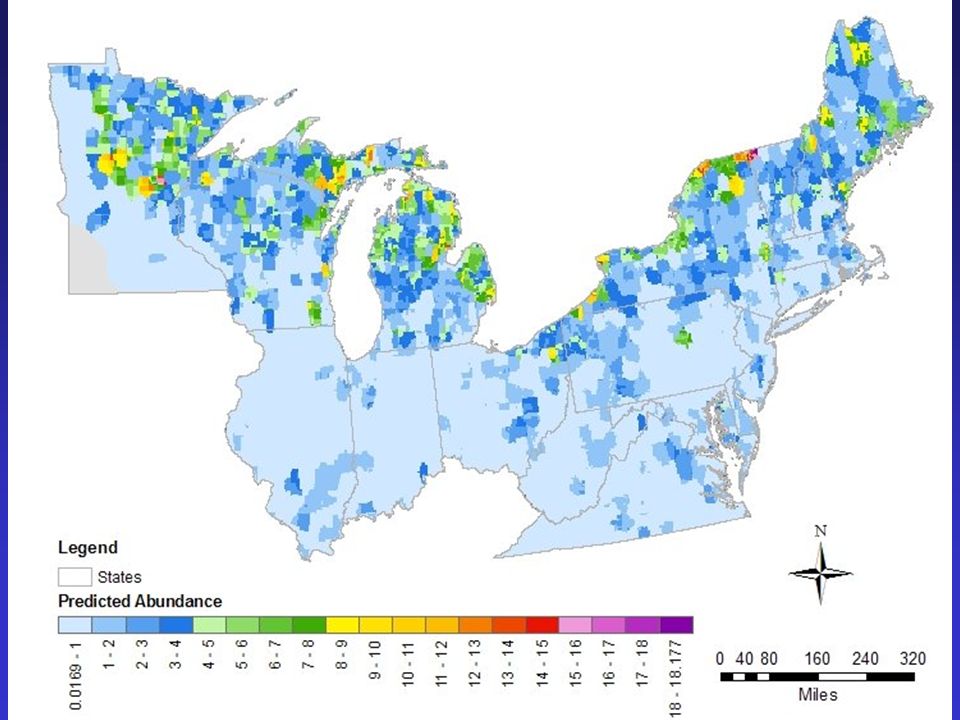
Species-of-the-Week American woodcock (Scolopax minor)
")
21
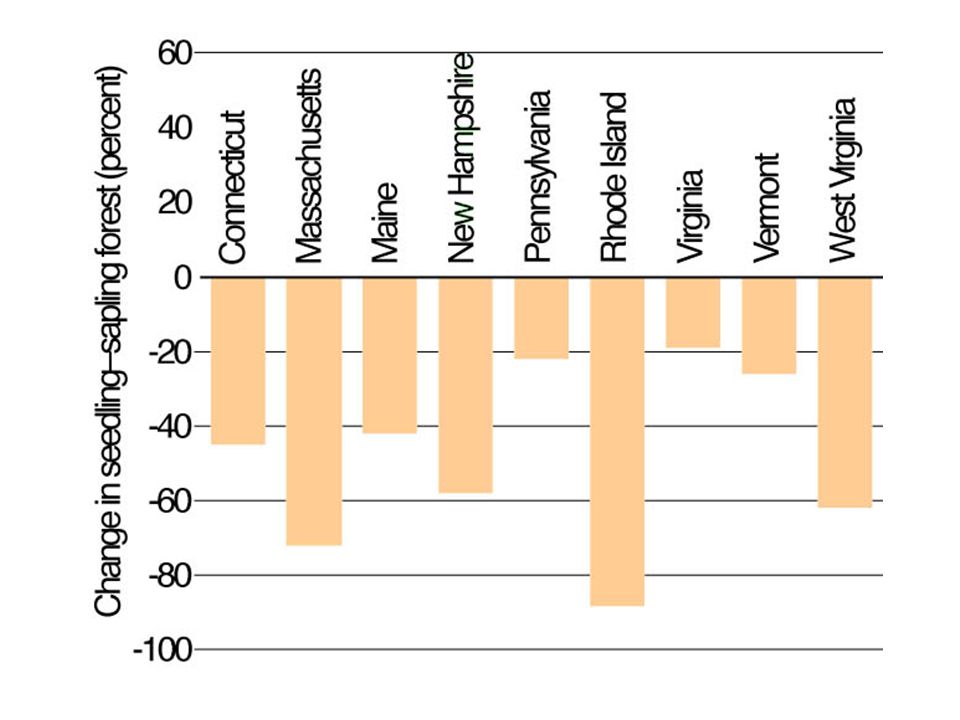
Habitat Woods & thickets with moist soil, small openings near woody cover aspen, alder, willow cover types (early successional = seedling/sapling stage; <3 in dbh)
")
26
Food Diet = 50-90% earthworms Diurnal foraging in spring/summer Nocturnal foraging in winter Long bill used as probe (foot stomping)
")
27
Reproduction Courtship behavior = males on breeding fields Mar- Apr -- polygynous Clutch size = ~4 eggs I.P. = 21 days; near full grown in 28 days Behavior -Migratory – winters in SE U.S. -Nonvocal calls = wing position

28
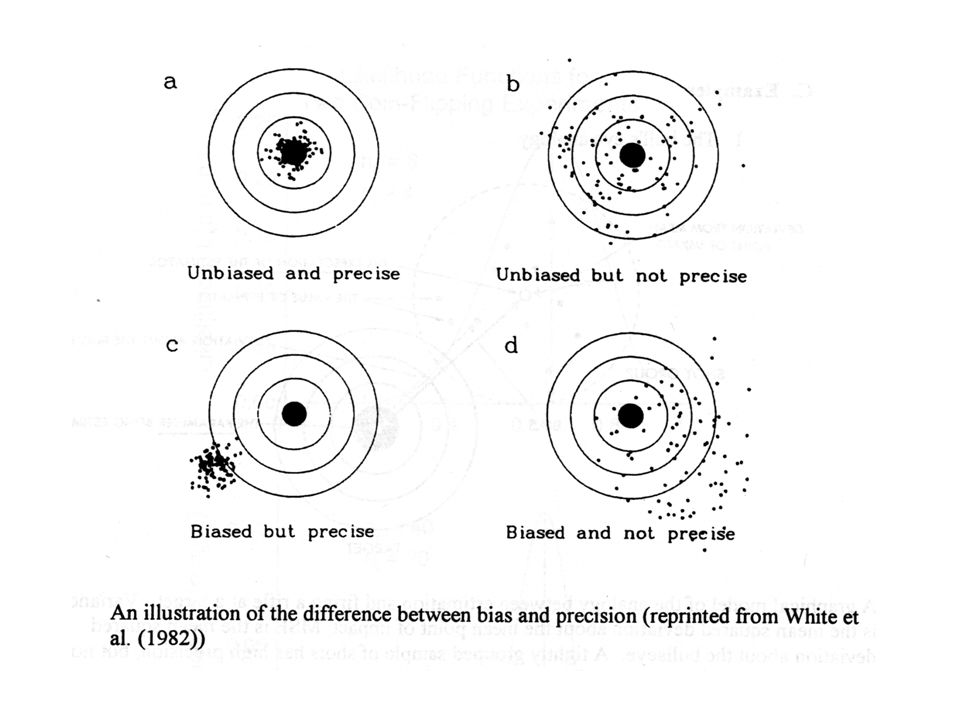
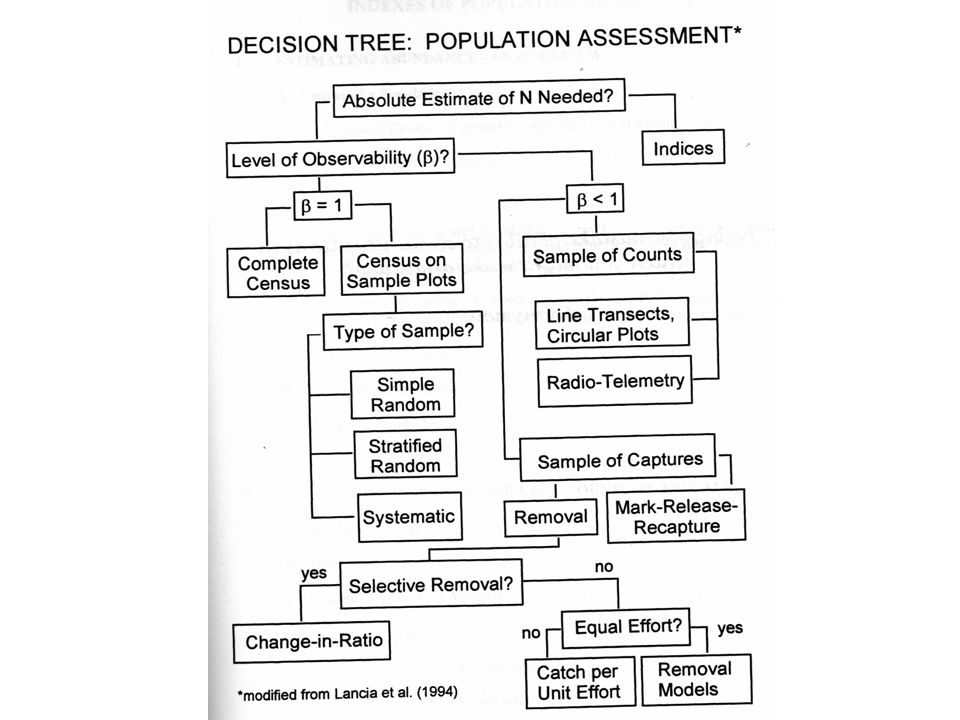
Estimating Abundance of Wildlife Terms -Population -Relative vs. Absolute Abundance -Parameter vs. Statistic -Population Index -Accuracy -Precision -Bias

32
Estimating Abundance of Wildlife Complete Counts (Census) -open habitat = visible wildlife -concentration of activity -small study area
 -open habitat = visible wildlife -concentration of activity -small study area")
33
Estimating Abundance of Wildlife Complete Counts (Census) -Drives * Biased (under- or overestimate) -Territorial (Spot) Mapping e.g., breeding birds
 -Drives * Biased (under- or overestimate) -Territorial (Spot) Mapping e.g., breeding birds")
34
Territorial (Spot) Mapping Limitations: - territorial species (grouse, songbirds) - sex ratio known or assumed -nonterritorial males? (floaters) -ability to id species & map territories
 -ability to id species & map territories.")
35
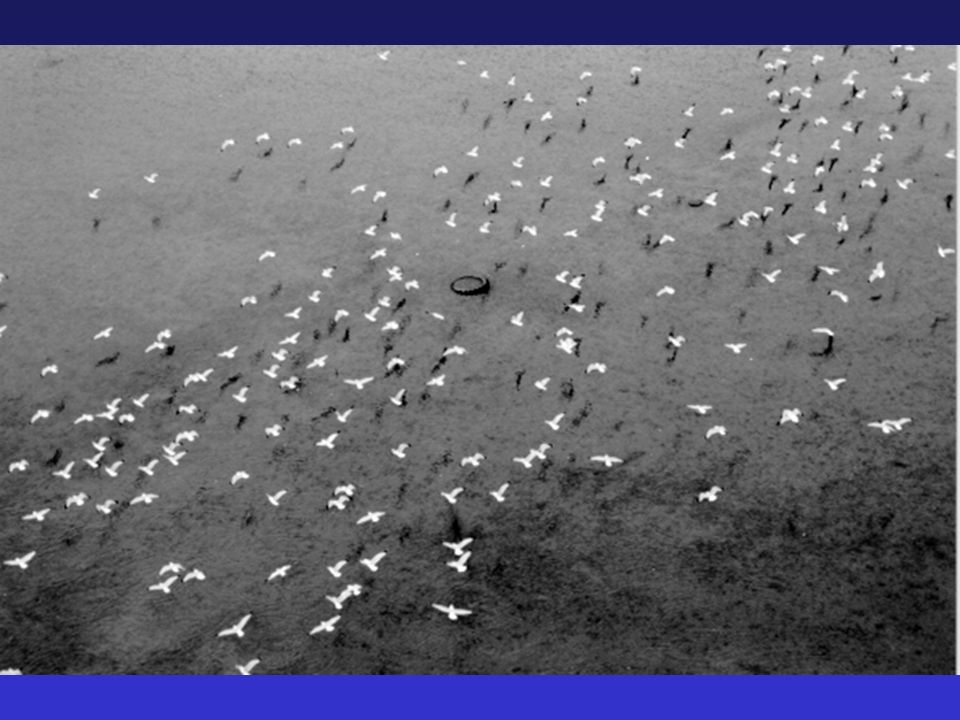
Estimating Abundance of Wildlife Complete Counts (Census) -Aerial Counts & Sensing - must see animal to count it! - Aerial Photos or IR Thermal Scans -photos of migratory waterfowl

37
Estimating Abundance of Wildlife Complete Counts (Census) -Aerial Counts & Sensing Aerial line-transect counts -must see animal to count it! Aerial Photos or IR Thermal Scans -photos of migratory waterfowl -IR scans of wildlife (bowhunting study in MN – loss rate)
.")
39
Estimating Abundance of Wildlife Complete Counts - Sample Plots -Line transects (ground or aerial) -e.g., flush count for grassland birds -assumes 100% detection
 -e.g., flush count for grassland birds -assumes 100% detection")
40
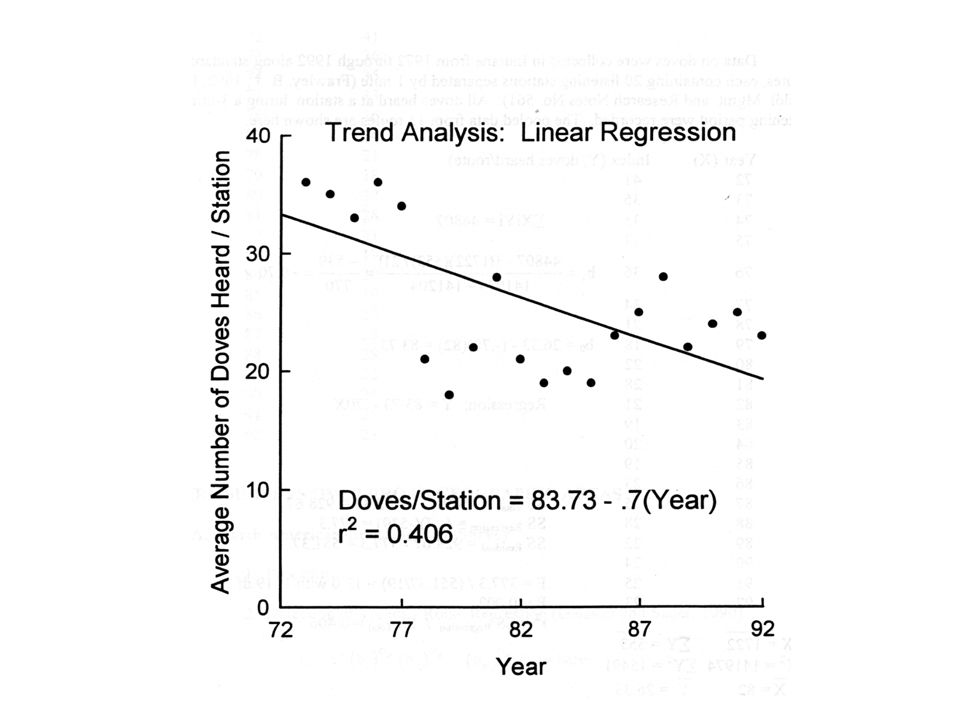
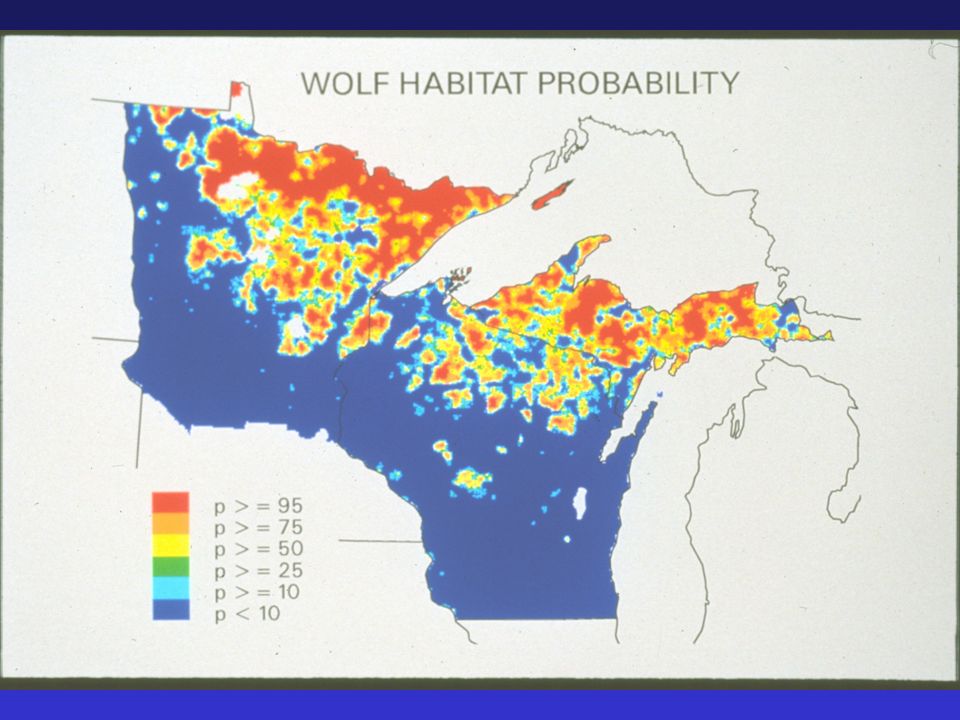
Indices of Relative Abundance …dependent on the collection of samples that represent some relatively constant but unknown population size –Traps, number of fecal pellets, vocalization frequency, pelt records, catch/unit effort, number of artifacts, questionnaires, cover, feeding capacity, roadside counts

41
Indices of Relative Abundance

42
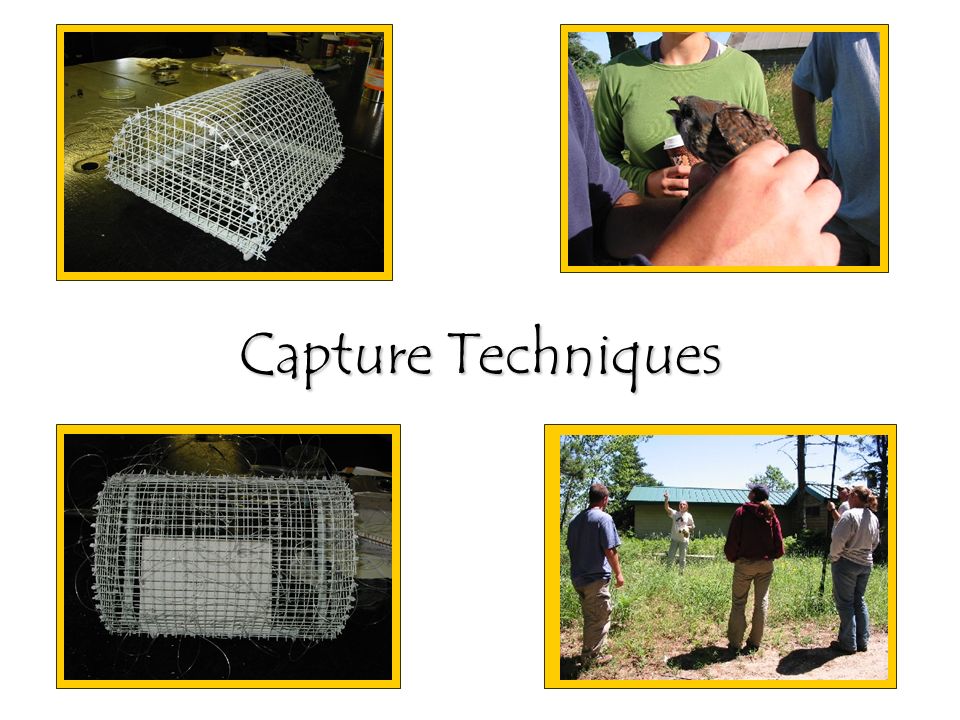
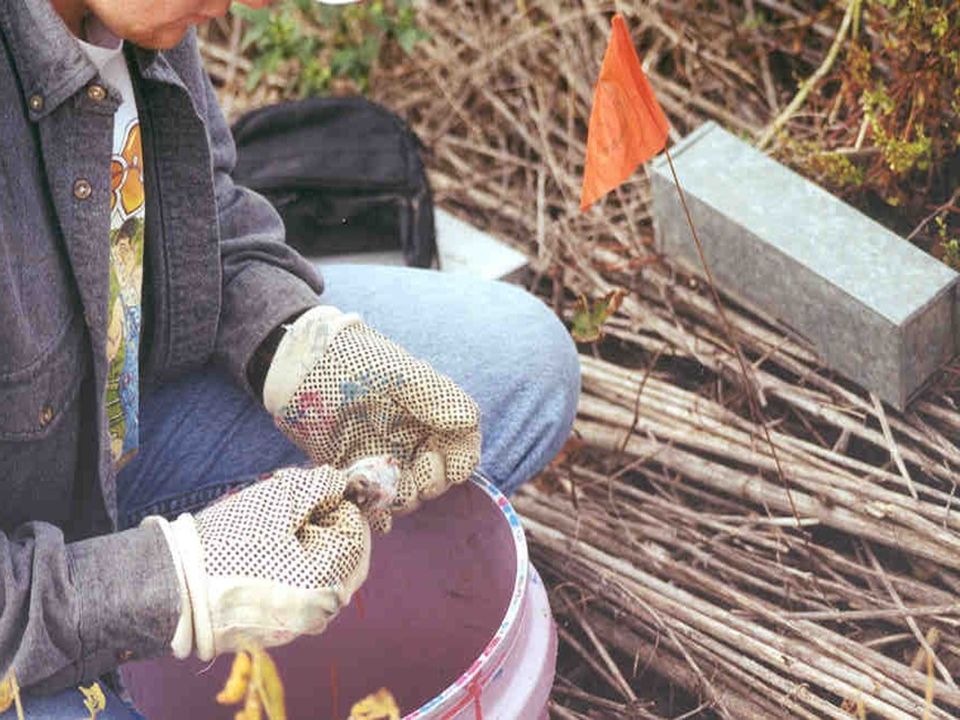
Capture Techniques

45
Radio Telemetry

46
Female Male Spatial Organization

47
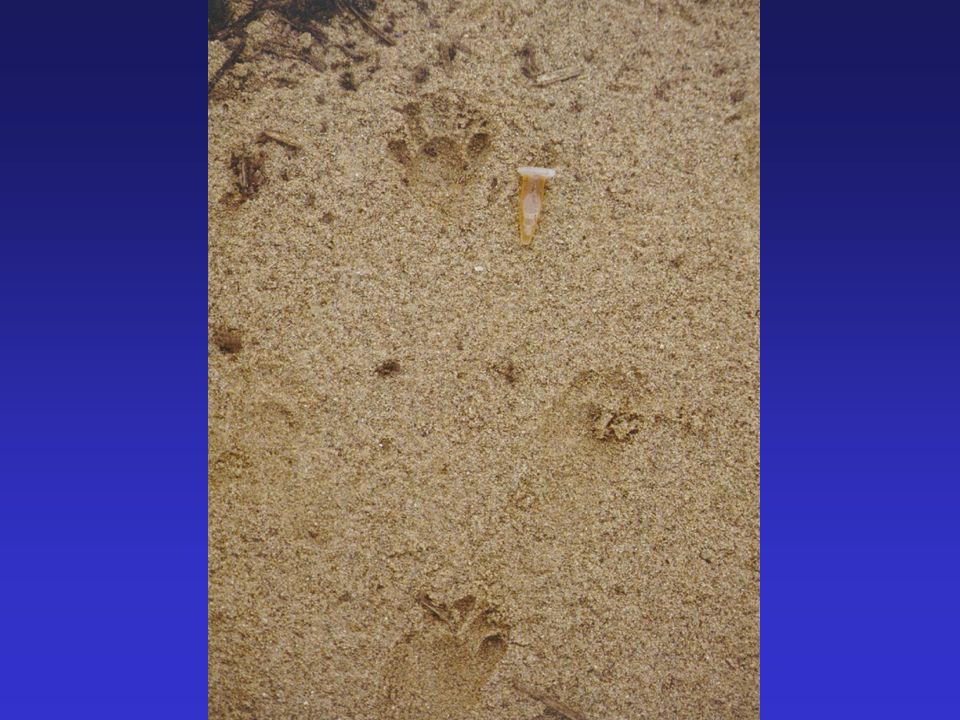
Scent Stations

49
Remote Camera Systems

50
DNA Fingerprinting

51
GPS

Similar presentations


 Why count birds? Descriptive Studies = asks “what types of birds occur in a particular habitat?”>")


