Download presentation
Presentation is loading. Please wait.

1
Implementing Basic Differences Tests
Chapter 13 Implementing Basic Differences Tests

2
Learning Objectives To learn how differences are used for market segmentation decisions To understand when t tests or z tests are appropriate and why you do not need to worry about this issue when using SPSS To be able to test the differences between two percentages or means for two independent groups

3
Learning Objectives To know what a paired samples difference test is and when to use it To comprehend ANOVA and how to interpret ANOVA output To learn how to perform differences tests for means using SPSS

5
Why Differences are Important
Market segmentation is based on differences between groups of consumers. One commonly used basis for market segmentation is the discovery of differences that are the following: Statistically significant Meaningful Stable Actionable differences

6
Why Differences Are Important Market Segmentation
Differences must be statistically significant: the differences found in the sample(s) truly exist in the population(s) from which the random samples are drawn.
 truly exist in the population(s) from which the random samples are drawn.")
7
Why Differences Are Important Market Segmentation
Differences must be meaningful: one that the marketing manager can potentially use as a basis for marketing decisions.

8
Why Differences Are Important Market Segmentation
Differences should be stable: one that will be in place for the foreseeable future.

9
Why Differences Are Important Market Segmentation
Differences must be actionable: the marketer can focus various marketing strategies and tactics, such as product design or advertising, on the market segments to accentuate the differences between segments.

10
Testing for Significant Differences Between Two Groups
Statistical tests are used when researcher wants to compare the means or percentages of two different groups or samples.

11
The Use of a t Test or a z Test
t Test: statistical inference test to be used with small sample sizes (n ≤ 30) z Test: statistical inference test to be used when the sample size is 30 or greater Note: Most computer statistical programs report only the t value because it is identical to the z value with large samples.
 z Test: statistical inference test to be used when the sample size is 30 or greater. Note: Most computer statistical programs report only the t value because it is identical to the z value with large samples.")
12
Differences Between Percentages with Two Groups (Independent Samples)
Independent samples are treated as representing two potentially different populations.

13
Differences Between Percentages with Two Groups (Independent Samples)
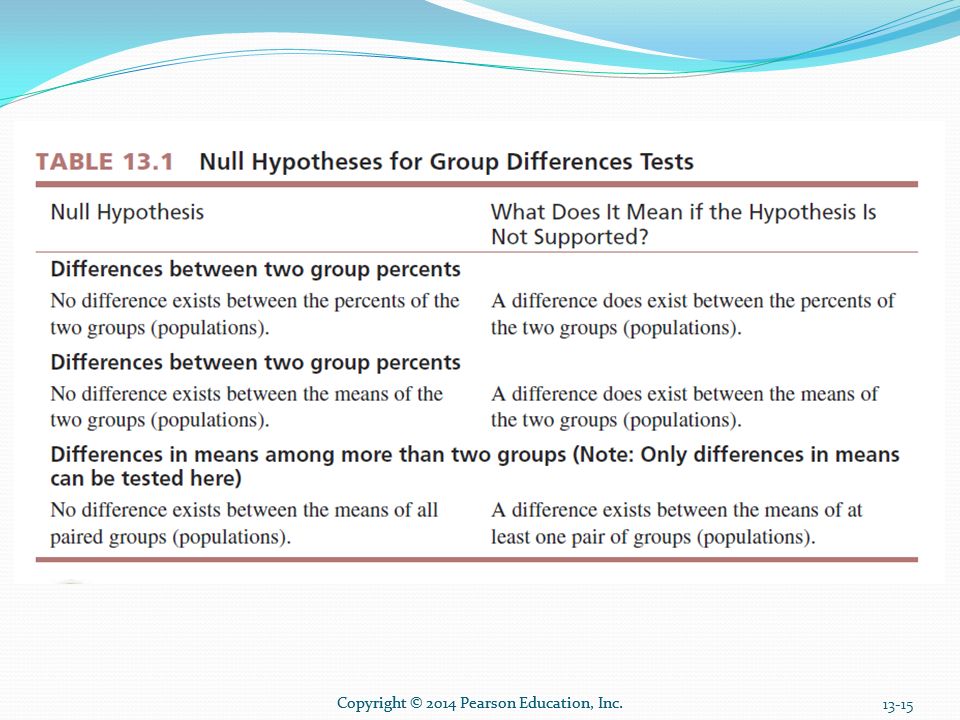
Null hypothesis: the hypothesis that the difference in the population parameters is equal to zero With a differences test, the null hypothesis states that there is no difference between the percentages (or means) being compared.
 being compared.")
14
Differences Between Percentages with Two Groups (Independent Samples)
Significance of differences between two percentages: alternative to the null hypothesis is that there is a true difference between the population parameters.

16
Differences Between Percentages with Two Groups (Independent Samples)
")
17
How Do You Know When the Results Are Significant?
If the null hypothesis is true, we would expect there to be n0 differences between the two percentages. Yet we know that, in any given study, differences may be expected due to sampling error. DELETE SLIDE?

18
How Do You Know When the Results Are Significant?
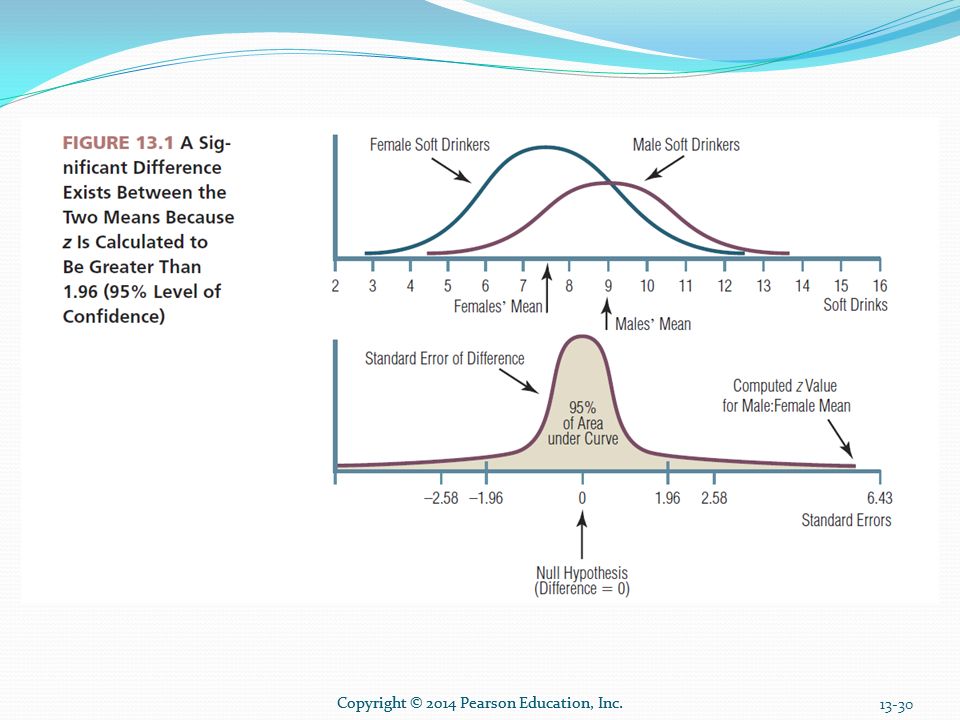
If the null hypothesis were true, we would expect 95% of the z scores computed from 100 samples to fall between and −1.96 standard errors. DELETE SLIDE?

19
How Do You Know When the Results Are Significant?
If the computed z value is greater than or −1.96, it is not likely that the null hypothesis of no difference is true. Rather, it is likely that there is a real statistical difference between the two percentages. DELETE SLIDE?

20
An Example: Testing the Difference Between Two Percentages
Last year a Harris Poll showed 40% of surveyed companies were coming to college campuses to hire seniors (n = 300 companies surveyed). This year, the Harris Poll reported the percentage is 65% (n = 100 companies surveyed). Is this a significant difference?
. This year, the Harris Poll reported the percentage is 65% (n = 100 companies surveyed). Is this a significant difference")
21
An Example: Testing the Difference Between Two Percentages
Applying the formula: P1 = 65 and P2 = 40, n1 = 100, n2 = 300 z = 4.51 Since the z value is greater than +1.96, the difference between the two percentages is significant.

22
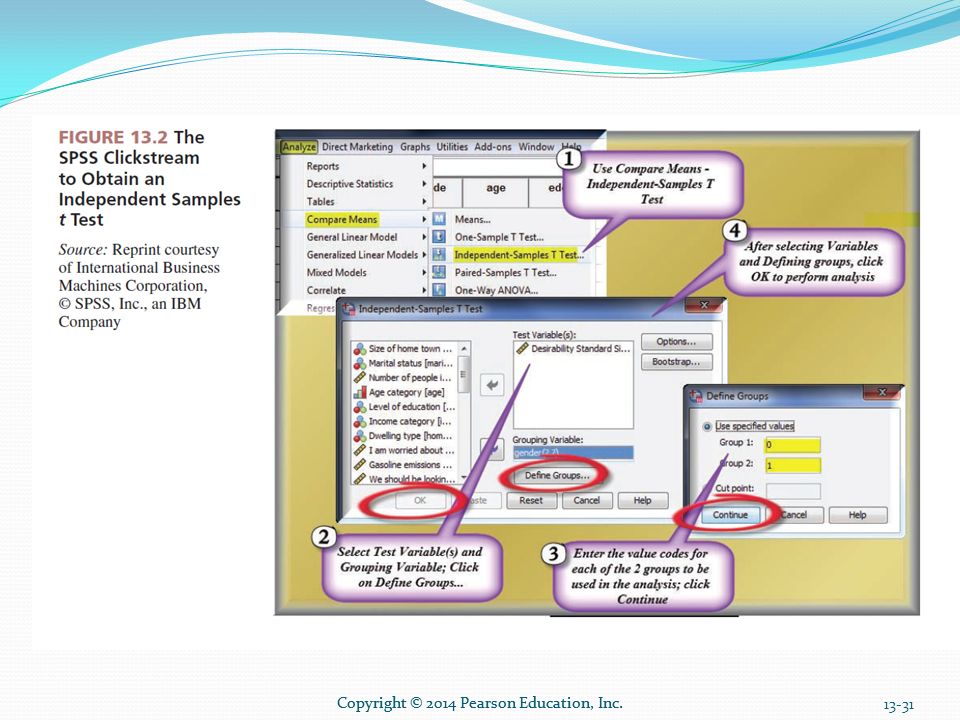
Using SPSS for Differences Between Percentages of Two Groups
SPSS does not perform tests of significance of the difference between the percentages of two groups, but you can use SPSS to generate the relevant information and perform a hand calculation. Use the SPSS command FREQUENCIES to produce the percentages you need.

23
Testing the Difference Between Means
Differences between two means from independent samples Differences between three or more means from independent samples Differences between paired means Add graphs

24
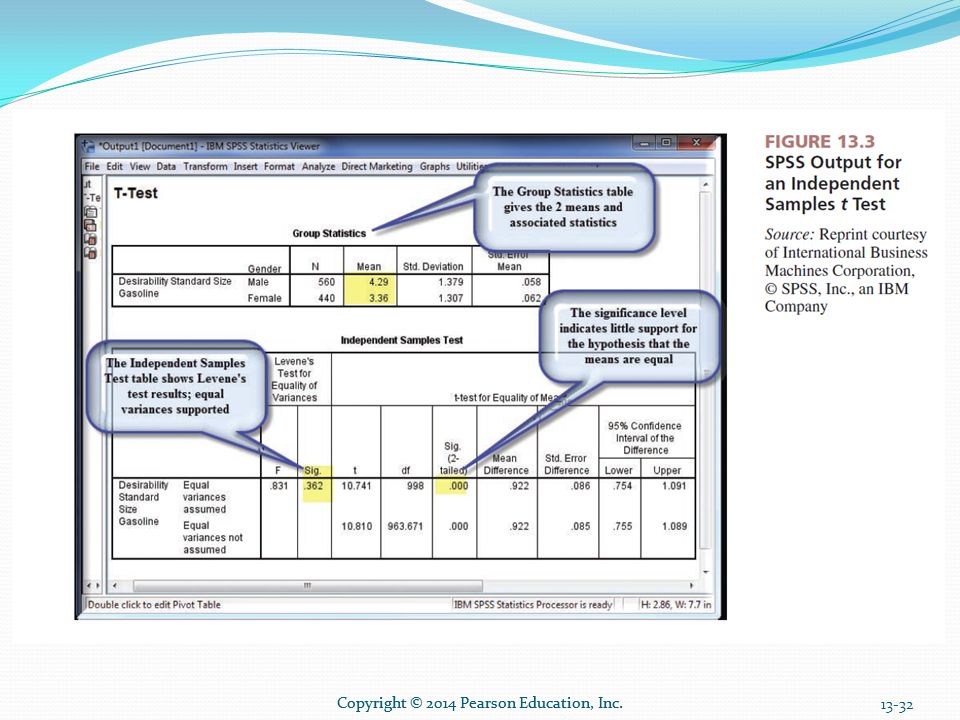
Differences Between Means with Two Groups (Independent Samples)
The procedure for testing the significance of difference between two means from two different groups is identical to the procedure for testing two percentages. Equations differ due to the use of a metric (interval or ratio) scale.
 scale.")
25
Differences Between Means with Two Groups (Independent Samples)
")
26
Differences Between Means with Two Groups (Independent Samples)
")
27
An Example: Testing the Difference Between Two Means
Do male teens and female teens drink different amounts of sports drinks?

28
An Example: Testing the Difference Between Two Means

29
An Example: Testing the Difference Between Two Means
The difference between males (9 bottles) and females (7.5 bottles) is significant; z =6.43.
 and females (7.5 bottles) is significant; z =6.43.")
33
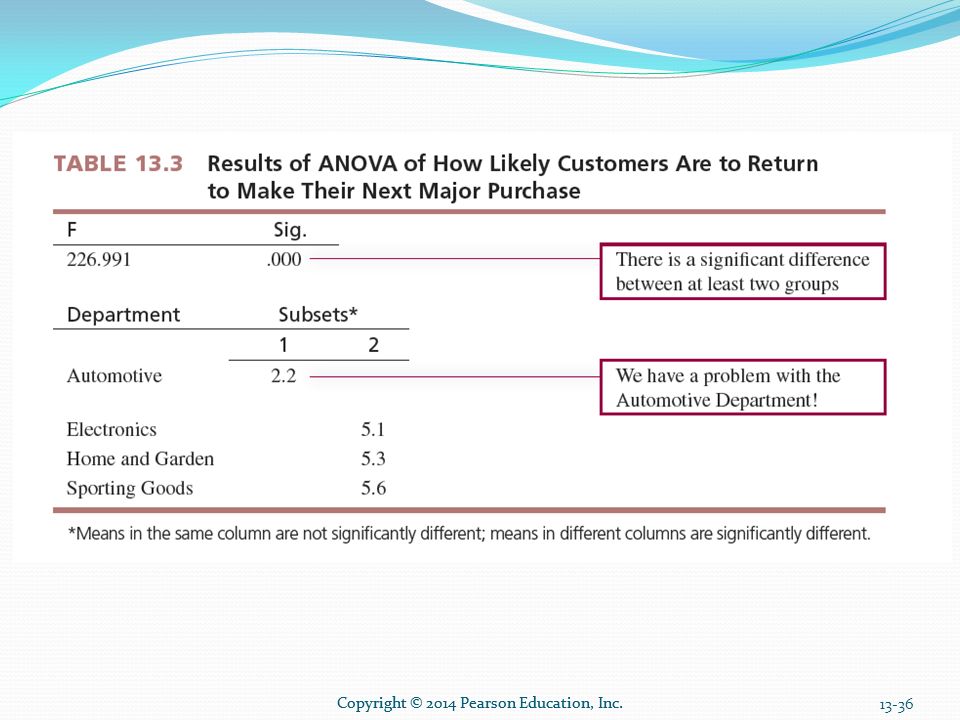
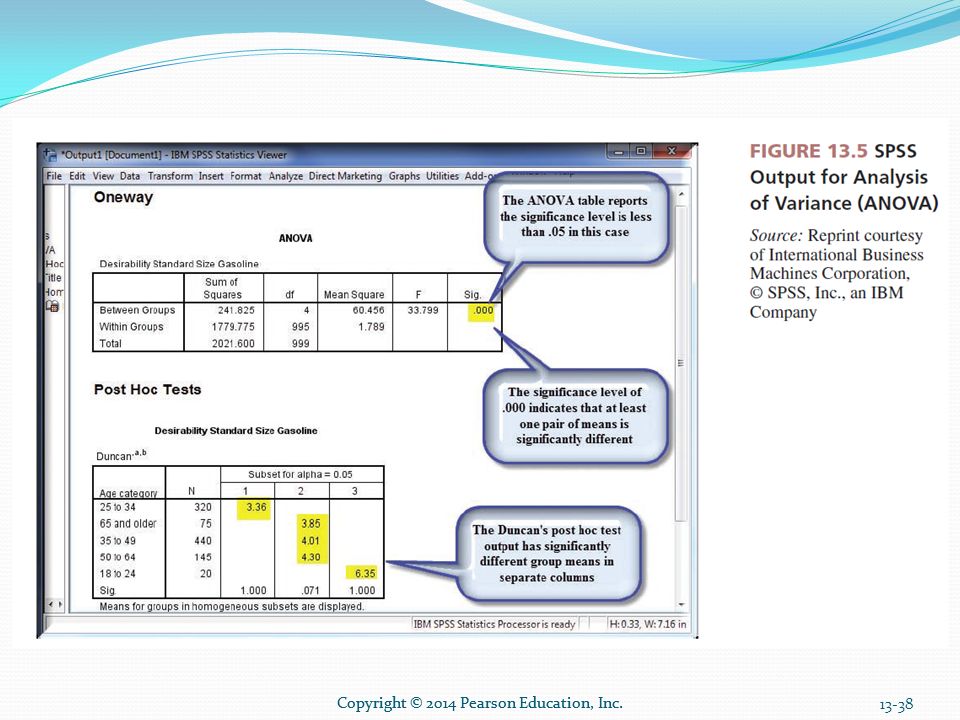
Analysis of Variance Analysis of variance (ANOVA): used when comparing the means of three or more groups ANOVA is an investigation of the differences between the group means to ascertain whether sampling errors or true population differences explain their failure to be equal.

34
Basics of Analysis of Variance
ANOVA will “flag” when at least one pair of means has a statistically significant difference, but it does not tell which pair. Green flag procedure: If at least one pair of means has a statistically significant difference, ANOVA will signal this by indicating significance

39
ANOVA Advantages ANOVA has two distinct advantages over performing multiple t tests of the significance of the difference between means. Immediately notifies researcher if there is any significant difference Arranges the means so the significant differences can be located and interpreted easily

40
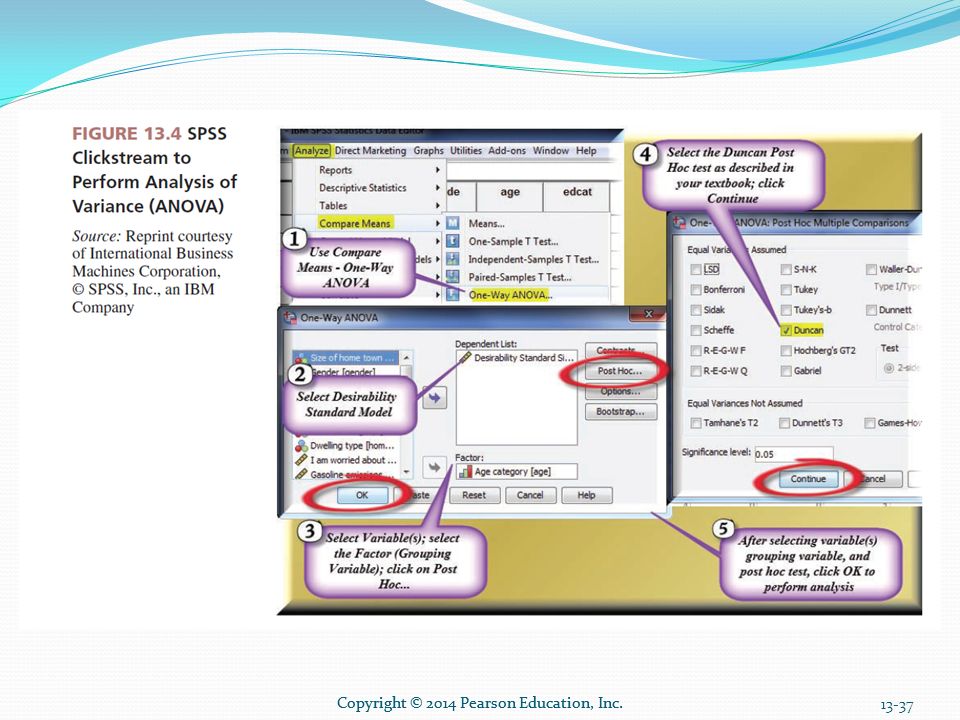
Post Hoc Tests: Detect Statistically Significant Differences Among Group Means
Post hoc tests: options that are available to determine where the pair(s) of statistically significant differences between the means exist(s) Duncan’s multiple range test: provides output that is mostly a “picture” of what means are significantly different The Duncan multiple range test’s output is much less statistical than most other post hoc tests and is easy to interpret.
 of statistically significant differences between the means exist(s) Duncan’s multiple range test: provides output that is mostly a picture of what means are significantly different. The Duncan multiple range test’s output is much less statistical than most other post hoc tests and is easy to interpret.")
41
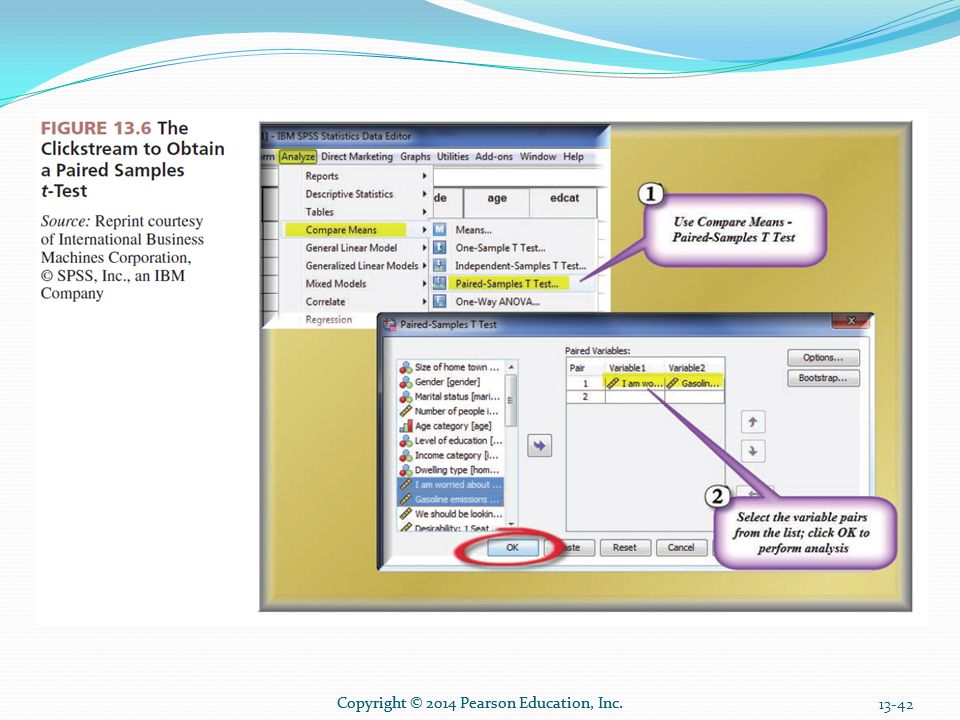
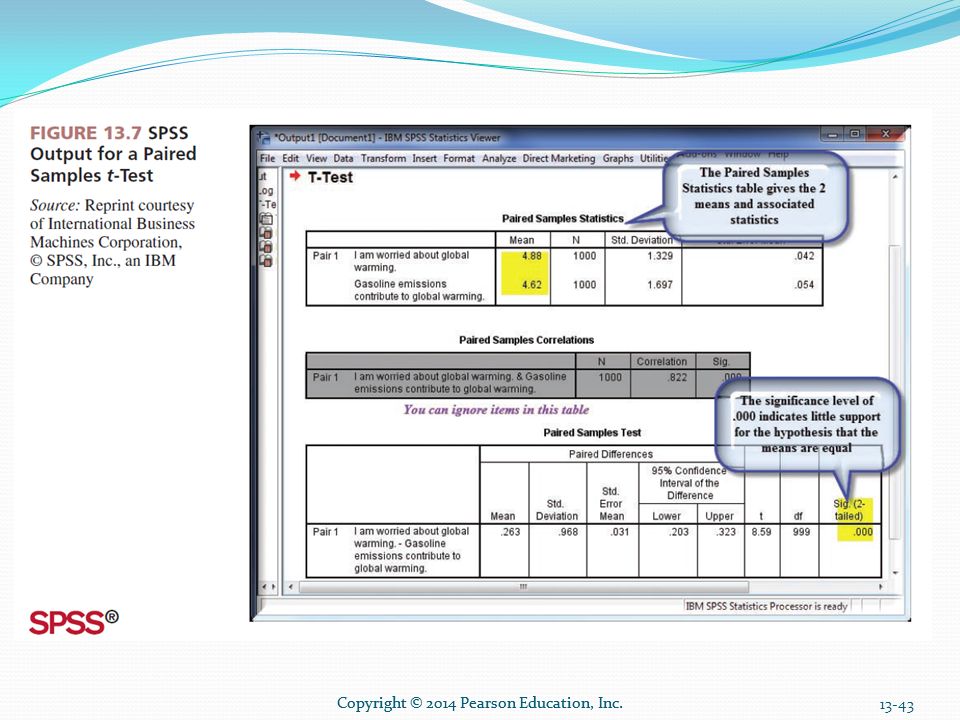
Differences Between Two Means Within the Same Sample (Paired Sample)
You can test the significance of the difference between two means for two different questions answered by the same respondents using the same scale. Paired samples test for the differences between two means: a test to determine if two means of two different questions using the same scale format and answered by the same respondents in the sample are significantly different.

44
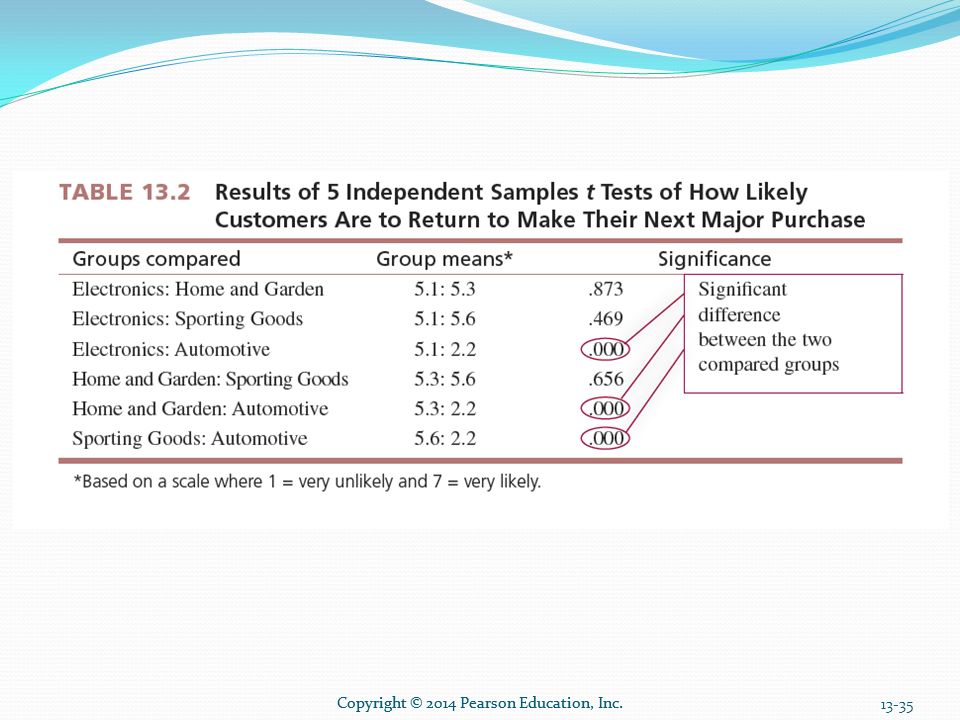
Reporting Group Differences Tests to Clients
Differences may not be obvious to the client, especially if the researcher does not take care to highlight them. Group comparison table: summarizes the significant differences in an efficient manner Reporting of findings has a significant ethical burden for marketing researchers, as they cannot choose to report only “good news” to clients.

45
All rights reserved. No part of this publication may be reproduced, stored in a retrieval system, or transmitted, in any form or by any means, electronic, mechanical, photocopying, recording, or otherwise, without the prior written permission of the publisher. Printed in the United States of America.

Similar presentations
>")


