Download presentation
Presentation is loading. Please wait.

1
SIMPLE TWO GROUP TESTS Prof Peter T Donnan Prof Peter T Donnan

2
TESTS TO BE COVERED 1. Chi-squared test (2x2) 2. t-test 3. Logrank test
 2. t-test 3. Logrank test")
3
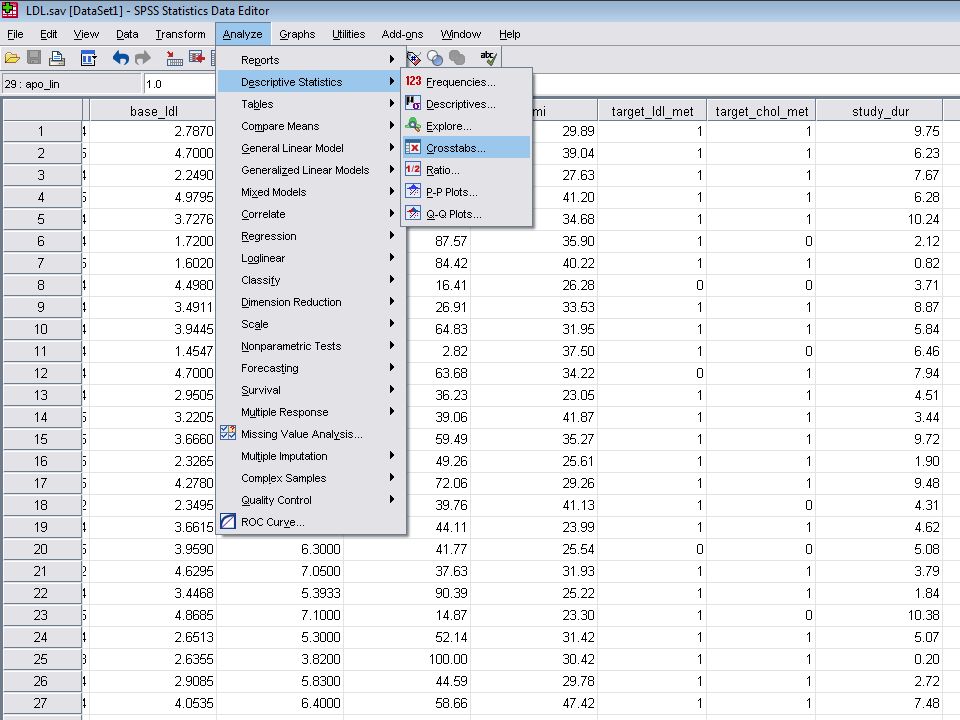
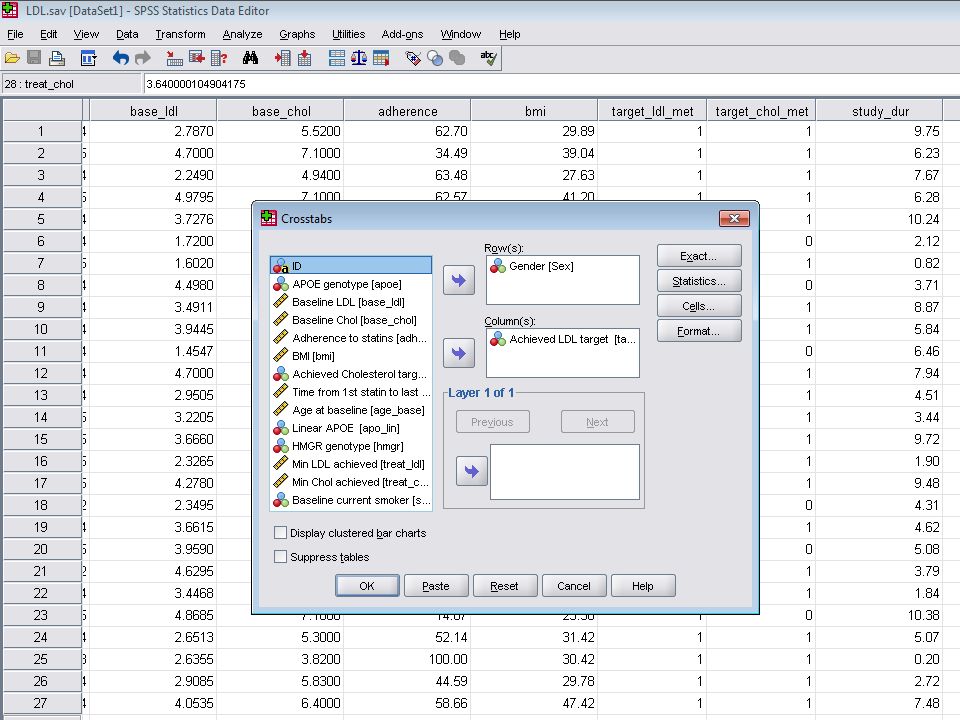
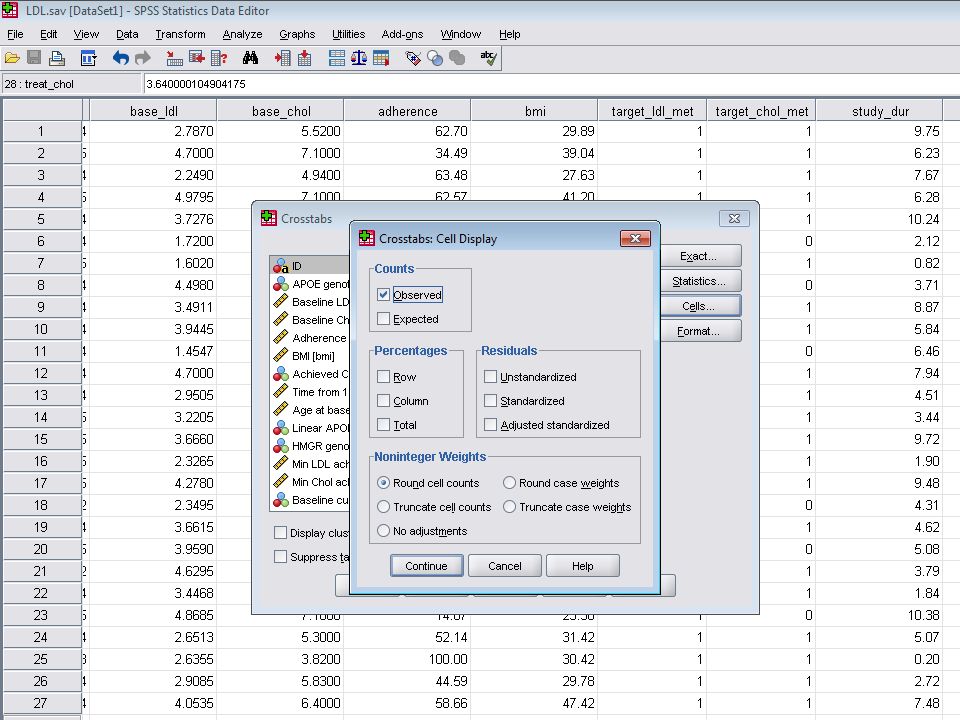
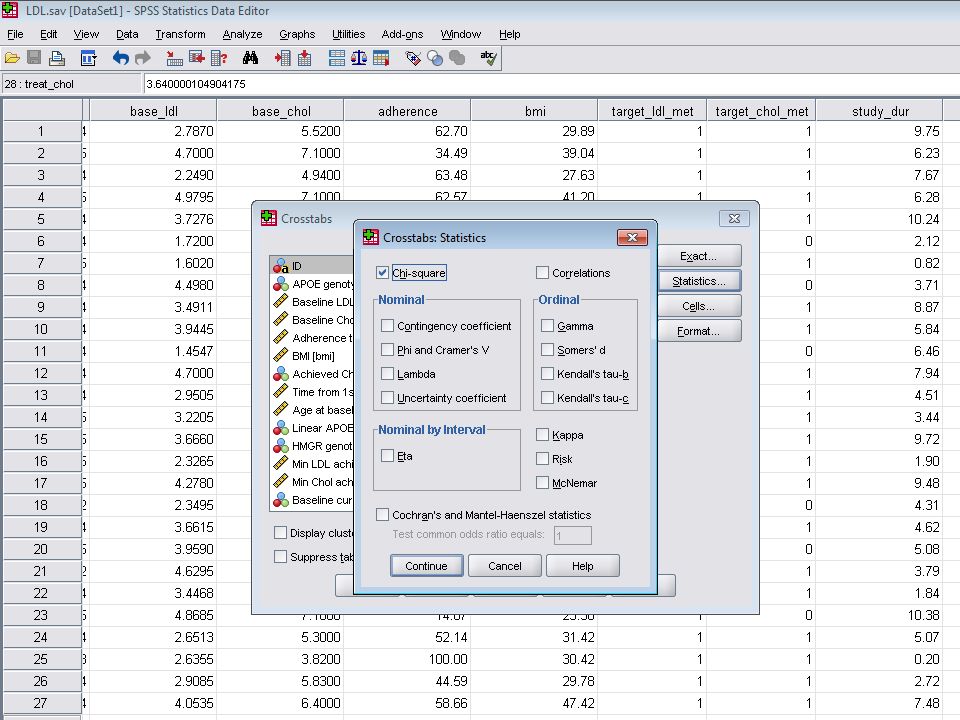
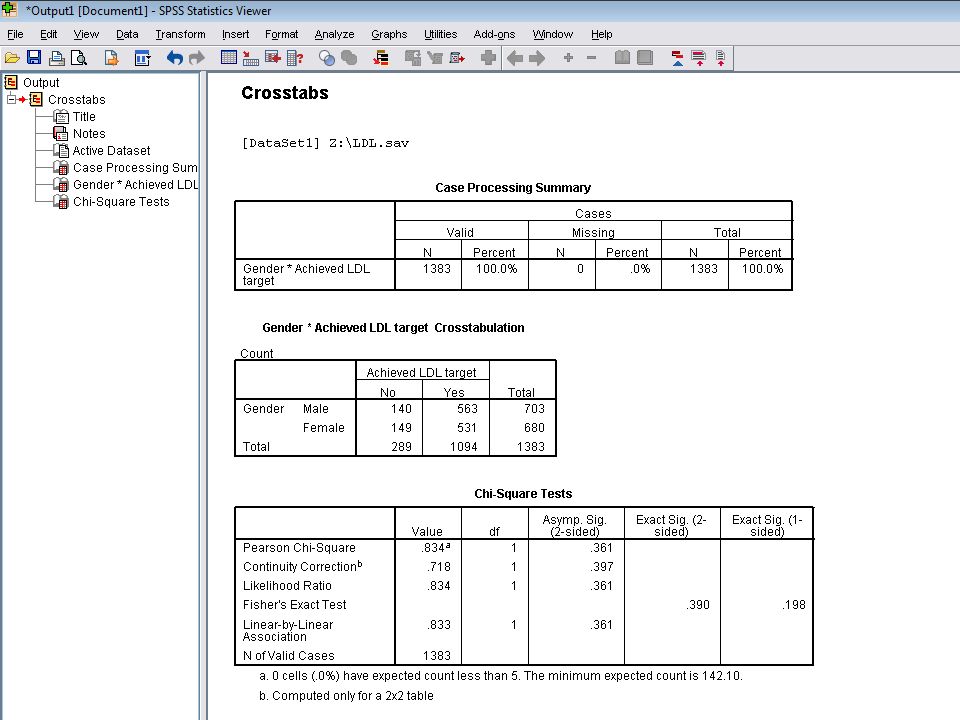
CHI SQUARED TEST Used to compare the proportions of observations in different categories. Example: Are gender and achieving LDL target related? Null hypothesis: There is no association of gender with achieving LDL target (or no difference between men and women) Achieved LDL target Total NoYes Gender Male140563703 Female149531680 Total28910941383
 Achieved LDL target Total NoYes Gender Male Female Total")
9
SIGNIFICANCE OF THE TEST STATISTICS The value 2 = 0.834 is not significant (p = 0.361) The null hypothesis can not be rejected. Gender and achieving LDL target are not related % Males meeting target: 80.1% % Females meeting target: 78.1%

10
CONDITIONS 1.Data are categorical. 2.If you tried to do Crosstabs with continuous variables you will get one column or row for each unique value!

11
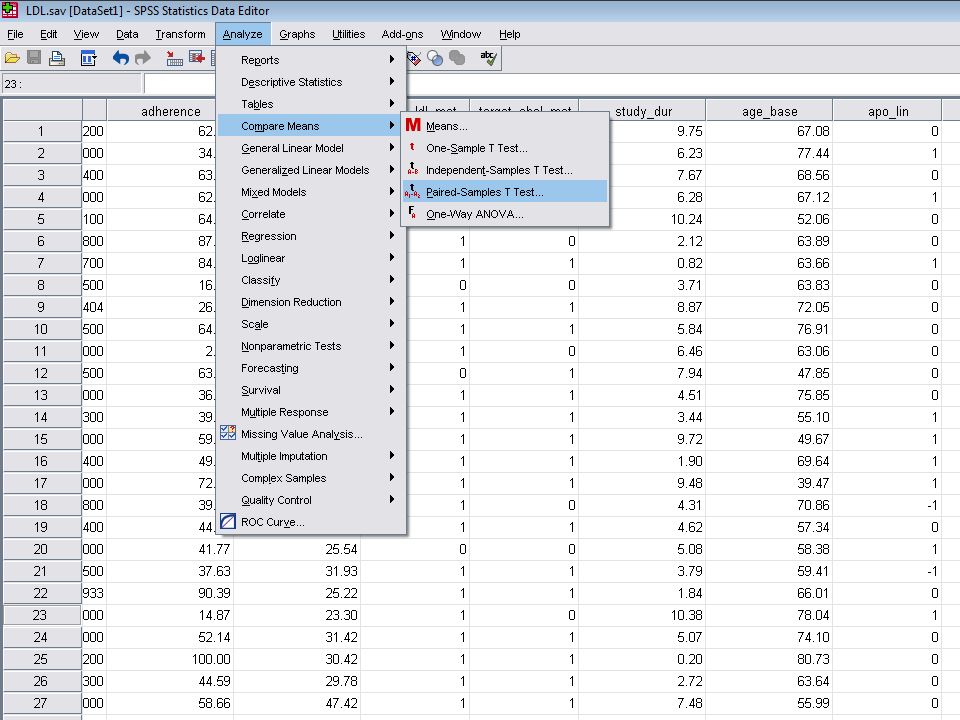
T-TEST – COMPARE TWO MEANS 1.Parametric test since comparing means 2.Paired samples t-test – the mean difference between two linked groups 3.Independent samples t-test – the mean difference between two independent groups.

12
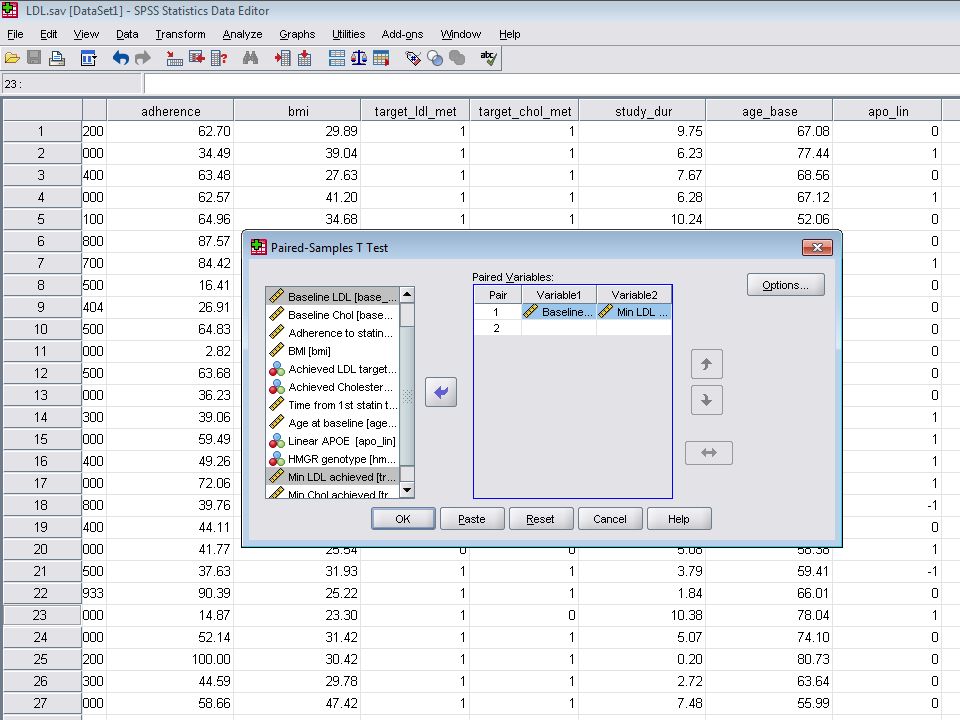
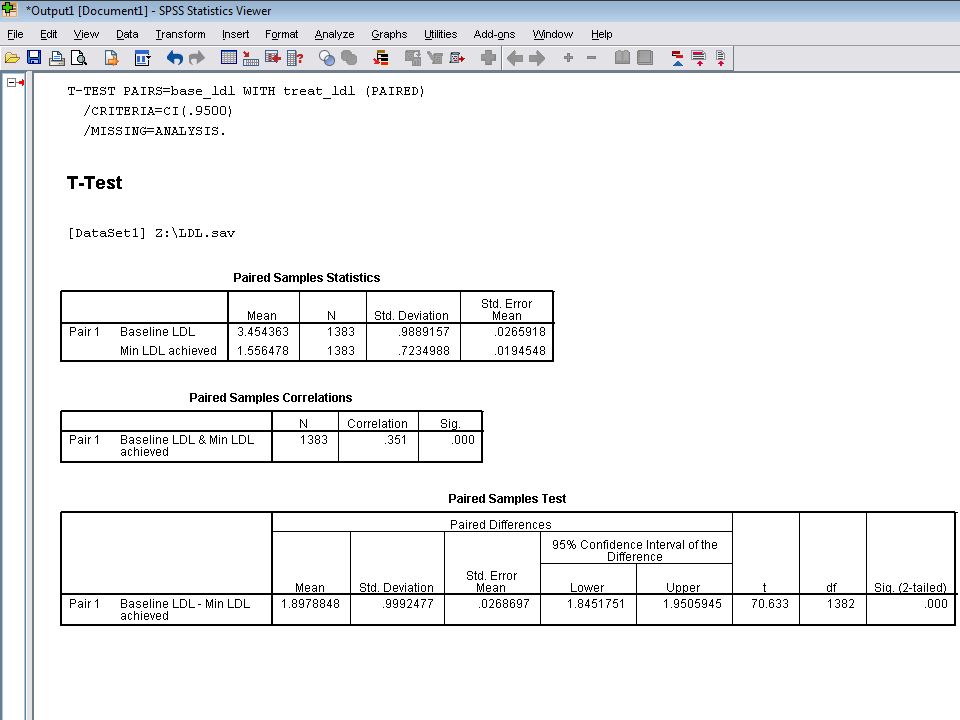
PAIRED SAMPLE T-TEST One variable measured in: 2 different groups who are matched or same group at 2 different times (e.g before / after) Example: Is there a difference in LDL level before and after treatment in the total sample? Is this paired or unpaired?

16
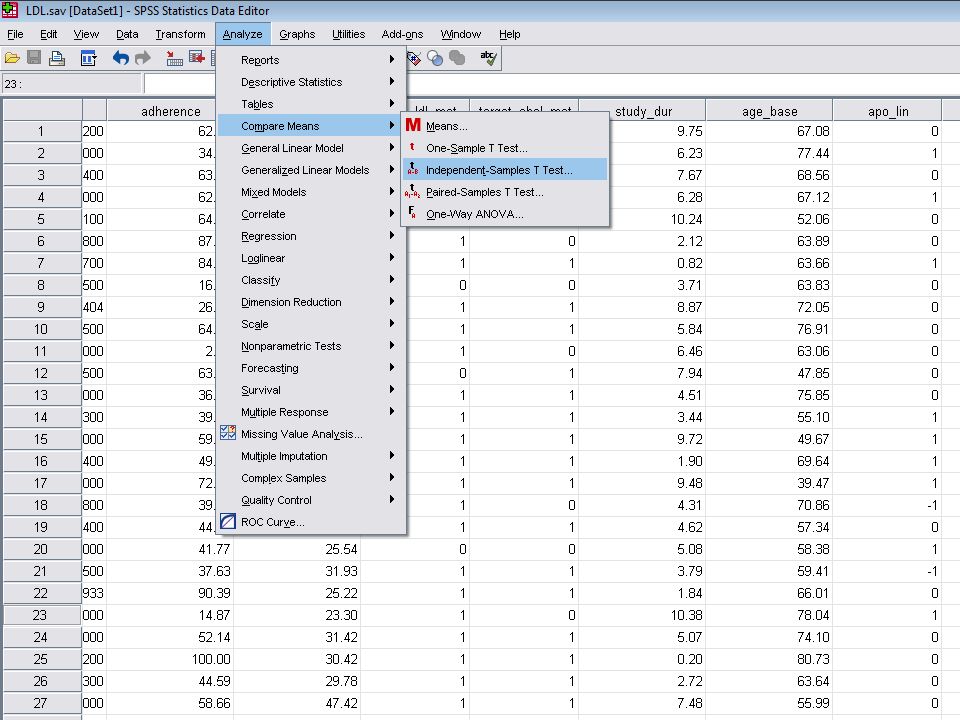
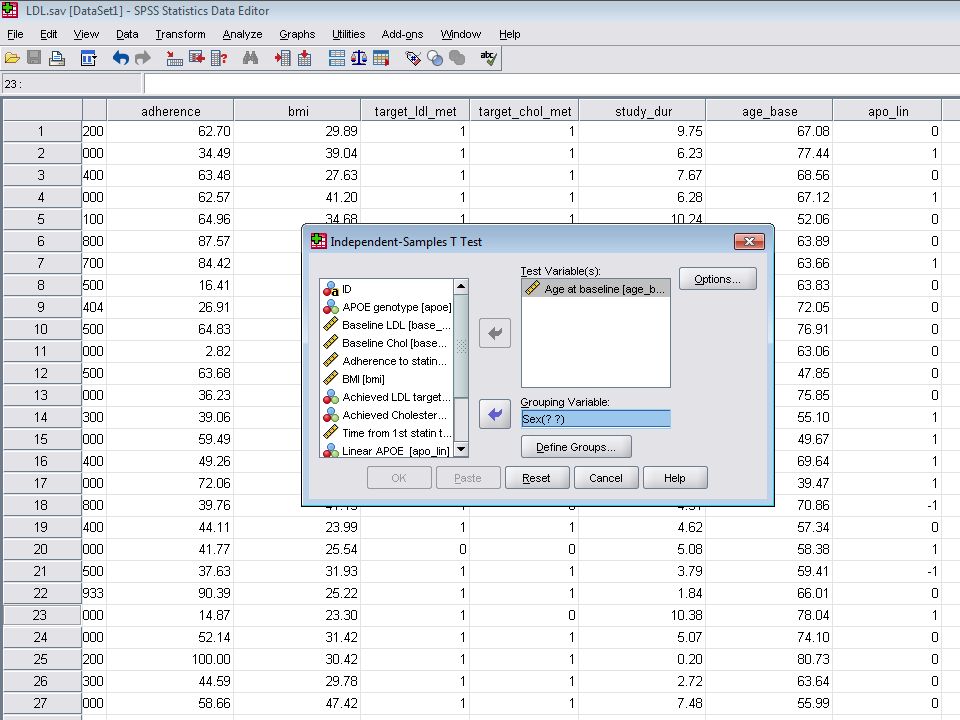
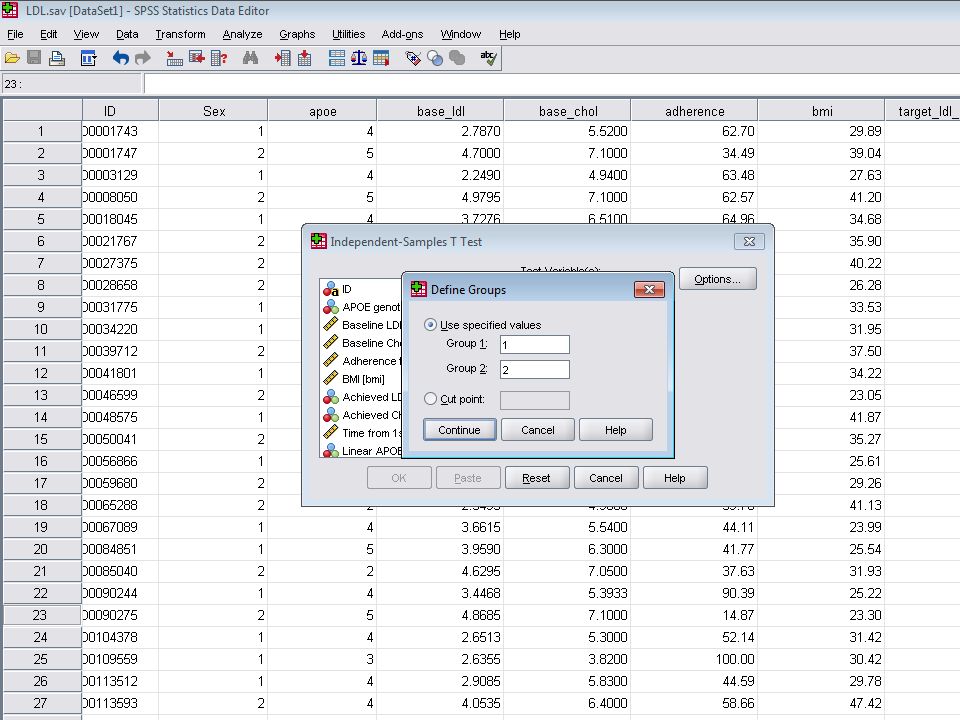
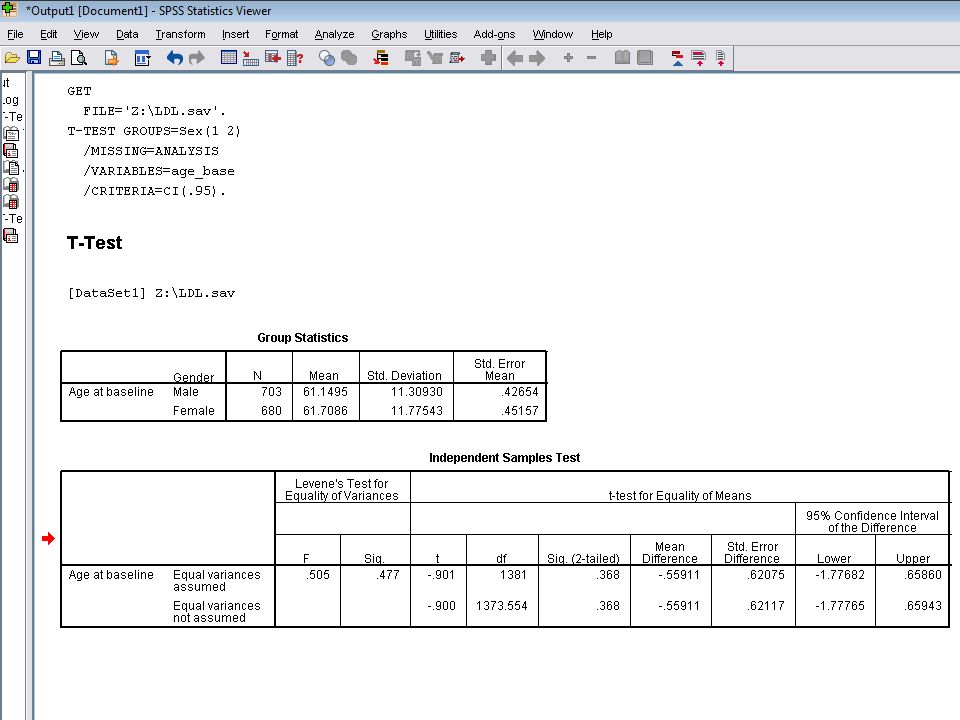
INDEPENDENT SAMPLES T-TEST Example: Is there a difference between the population mean ages of the males and females? Assumptions: - In the population of interest the variable is normally distributed. - The variances of the 2 groups are the same

21
LOGRANK TEST

22
Example: Survival curves for women with glioma by diagnosis. Bland J M, Altman D G BMJ 2004;328:1073

23
The most popular method of comparing the survival between groups, which takes the whole follow up period into account. LOGRANK TEST

24
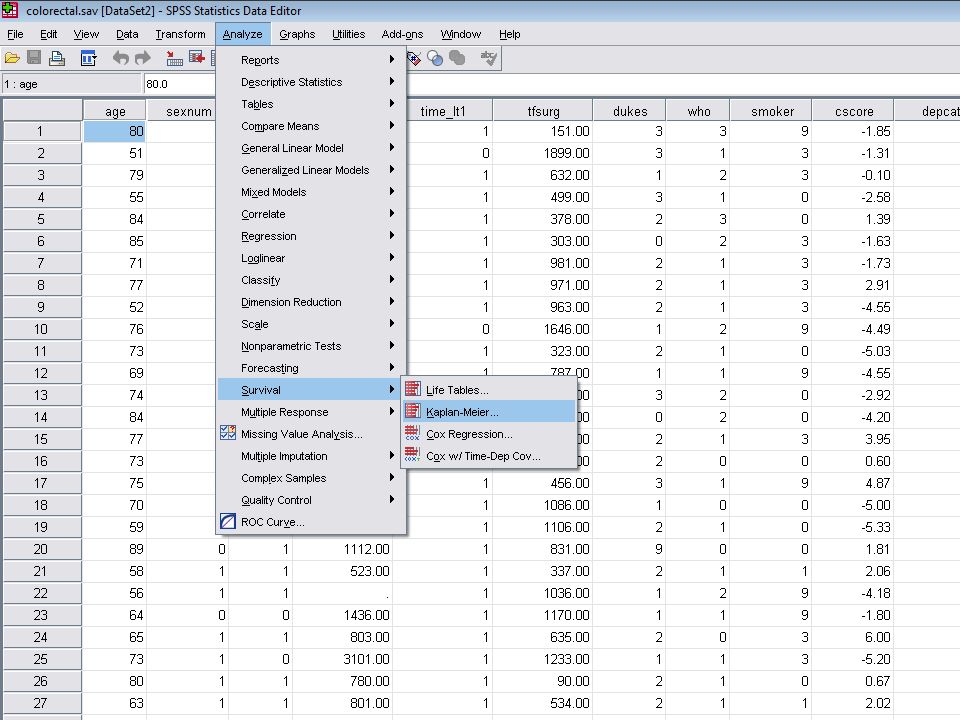
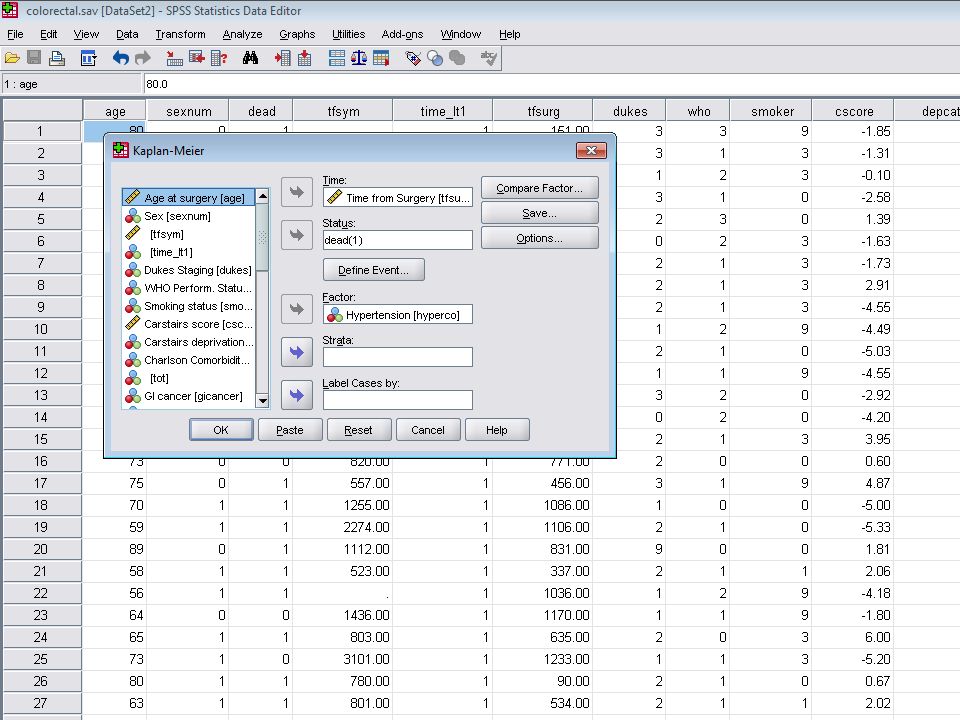
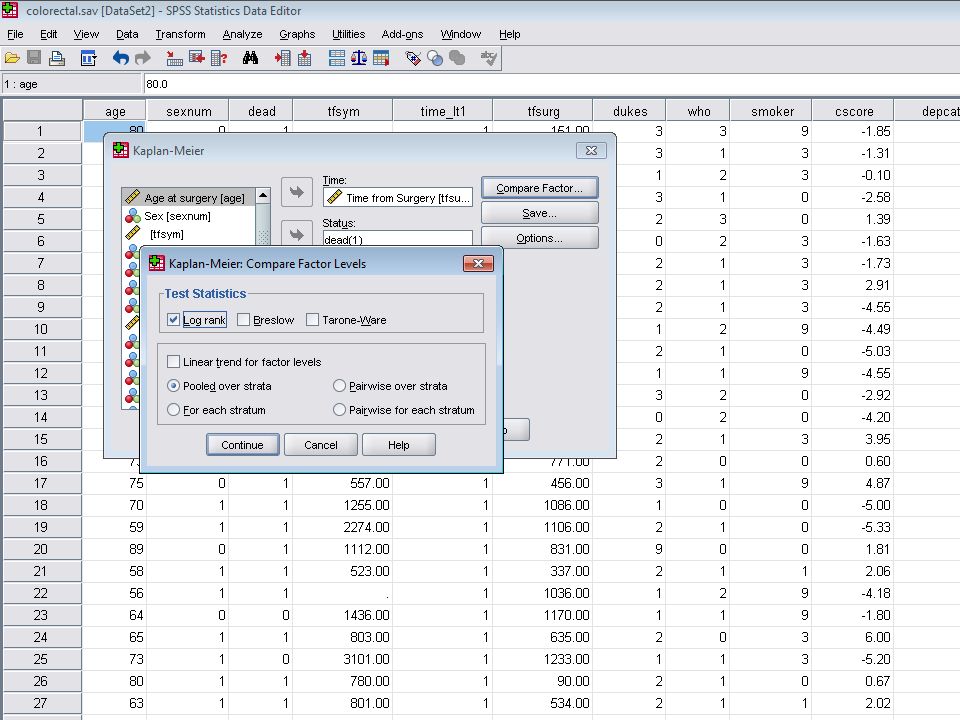
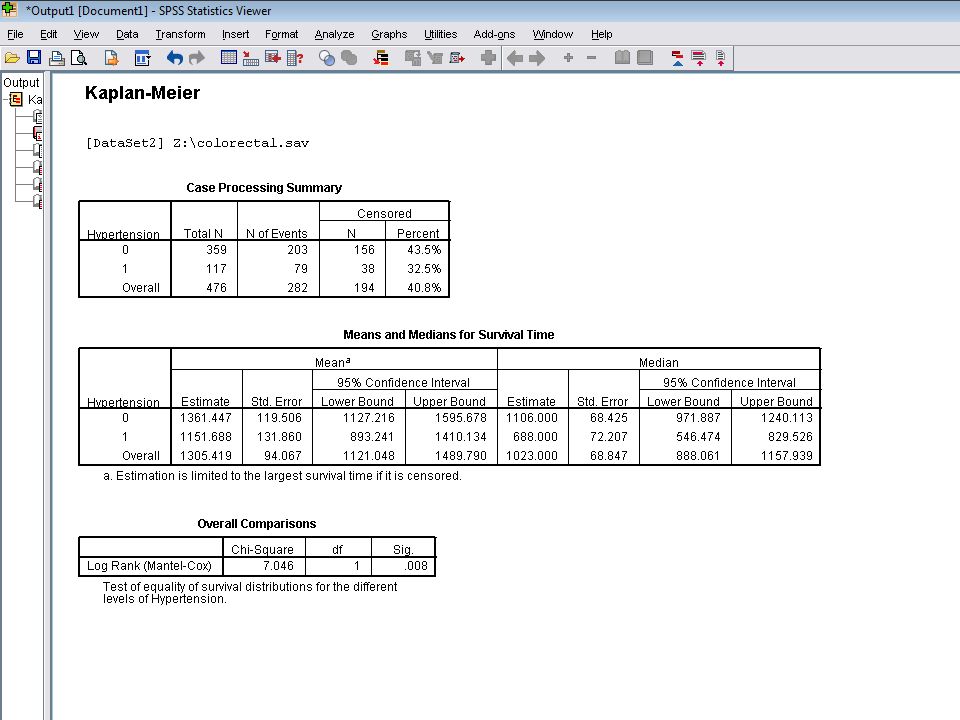
Log rank test involves calculating Chi-squared ( 2 ) statistic for difference in median survival between two groups. Example: Do colorectal cancer patients with hypertension have worse survival than patients without hypertension?

25
Logrank Test: Null Hypothesis The Null hypothesis for the logrank test: Hazard Rate group A = Hazard Rate for group B = HR = O A / E A = 1 O B / E B

30
THANK YOU FOR LISTENING Explore 2-group tests further with datasets: LDL Data.sav colorectal.sav

Similar presentations


 Lecture 9.>")


 Dr. M. H. Rahbar Professor of Biostatistics Department of Epidemiology Director,>")


 value and.>")