Download presentation
Presentation is loading. Please wait.

1
European Real Estate Society 17th Annual Conference, Milan, June 2010 Sector, Region or Function? A MAD reassessment of Sector, Region or Function? A MAD Reassessment of Real Estate Diversification in the UK Peter Byrne and Stephen Lee www.henley.reading.ac.uk/rep/fulltxt/0510.pdf

2
European Real Estate Society 17th Annual Conference, Milan, June 2010 Introduction This paper is a re-appraisal of sector versus ‘regional’ diversification within the UK. Diversification by Sector, Region or Function? A Mean Absolute Deviation Optimisation. Journal of Property Valuation & Investment, 16, 1, 1998, 38-56 Extends this previous work in several ways: The data are for a substantially longer period: Investment Property Databank (IPD) annual data over the 27 years 1981-2007 with a different real estate classification of local authorities. A new socio-economic (functional) taxonomy: data from the 2001 UK Census Given other work: re-assess the proposition that such functional groupings (may) offer superior diversification benefits compared with conventional sector/regional classifications.
 annual data over the 27 years with a different real estate classification of local authorities. A new socio-economic (functional) taxonomy: data from the 2001 UK Census Given other work: re-assess the proposition that such functional groupings (may) offer superior diversification benefits compared with conventional sector/regional classifications..")
3
European Real Estate Society 17th Annual Conference, Milan, June 2010 Byrne and Lee (2000) investigated the risk reduction that might be achieved across the sectors and regions in the UK and found that the greatest percentage reduction in total risk occurred in sector portfolios rather than in their regional equivalents. Fisher and Liang (2000) decomposed the returns of US real estate into four sectors and four regions. Their results showed that for the NCREIF environment in the period 1977-1999 sector was more effective than regional diversification. Hoesli, et al. (1997) and Hamelink, et al. (2000) cluster UK quarterly data from 1977-1995 and found a geographical dimension to the Office and Industrial sectors, but none for Retail. Confirmed Eichholtz et al. (1995) that a nine group (3x3) classification provided a useful framework for portfolio construction. Jackson and White (2005) conclude neither the standard regions nor the IPD segment classification systems accurately reflect rental growth patterns in UK RETAIL. Clustering of the rental change data for the OFFICE sector, however, supports the IPD scheme. Some related sector/regional work since about 1995/8
 decomposed the returns of US real estate into four sectors and four regions. Their results showed that for the NCREIF environment in the period sector was more effective than regional diversification. Hoesli, et al. (1997) and Hamelink, et al. (2000) cluster UK quarterly data from and found a geographical dimension to the Office and Industrial sectors, but none for Retail. Confirmed Eichholtz et al. (1995) that a nine group (3x3) classification provided a useful framework for portfolio construction. Jackson and White (2005) conclude neither the standard regions nor the IPD segment classification systems accurately reflect rental growth patterns in UK RETAIL. Clustering of the rental change data for the OFFICE sector, however, supports the IPD scheme. Some related sector/regional work since about 1995/8.")
4
European Real Estate Society 17th Annual Conference, Milan, June 2010 Some related sector/regional work since about 1995/8 Smith, et al. (2004) ‘the bulk of institutionally owned real estate lay (lies) in the largest US Metro markets’. Collapsed the the market into eight clusters based on economic characteristics, geographic proximity and absolute size. 35 metro areas and 26 non-anchor markets in seven of the clusters and all the rest in the eighth (so-called Opportunistic) group. Some subjective adjustment to ‘correct’ the placing of certain of the markets within particular clusters. Hess and Liang (2005) update - took account of major statistical changes but the overall effect was modest because of the pre-existing overwhelming concentration of investment in the largest markets. Hess and Ruggiero (2009) examined the extent to which recent ‘changes’ in market conditions affected their favoured market structure. Approach generally retained its long term utility but could be overwhelmed by ‘extraordinary events’ producing ‘atypical’ levels of systematic risk.
 ‘the bulk of institutionally owned real estate lay (lies) in the largest US Metro markets’. Collapsed the the market into eight clusters based on economic characteristics, geographic proximity and absolute size. 35 metro areas and 26 non-anchor markets in seven of the clusters and all the rest in the eighth (so-called Opportunistic) group. Some subjective adjustment to ‘correct’ the placing of certain of the markets within particular clusters. Hess and Liang (2005) update - took account of major statistical changes but the overall effect was modest because of the pre-existing overwhelming concentration of investment in the largest markets. Hess and Ruggiero (2009) examined the extent to which recent ‘changes’ in market conditions affected their favoured market structure. Approach generally retained its long term utility but could be overwhelmed by ‘extraordinary events’ producing ‘atypical’ levels of systematic risk..")
5
European Real Estate Society 17th Annual Conference, Milan, June 2010 Some related sector/regional work since about 1995/8 Their most telling and sustained conclusion is that investors use the economic behaviour of a rather small number of ‘locations’ as “a proxy for the entire real estate investment universe”. On this basis it might seem unlikely that significant changes in the structure of portfolio investment would EVER be observed, except at the margins.

6
European Real Estate Society 17th Annual Conference, Milan, June 2010 Data 1.IPD Local Markets Annual standing investment total percentage returns from 1981 to 2007. At the end of 2007 the data covered 12,234 properties with an aggregate value of £183,769m in 287 funds. Returns for Standard Retail, Office and Industrial properties in 457 locations (Local Authorities - towns and cities) in the UK. 2.UK Office of National Statistics (ONS), multivariate classification of local authorities (essentially towns) based on data from the 2001 census. 42 variables from the Key Statistics dataset, in six main dimensions: demography, household composition, housing, socio-economic, employment and industry. Used a combination of Ward’s hierarchical and k-means cluster analysis methods:- Principal clustering at a Supergroup level (seven clusters) Groups (13 clusters) – used in this study Sub-groups (24 clusters)
 in the UK. 2.UK Office of National Statistics (ONS), multivariate classification of local authorities (essentially towns) based on data from the 2001 census. 42 variables from the Key Statistics dataset, in six main dimensions: demography, household composition, housing, socio-economic, employment and industry. Used a combination of Ward’s hierarchical and k-means cluster analysis methods:- Principal clustering at a Supergroup level (seven clusters) Groups (13 clusters) – used in this study Sub-groups (24 clusters).")
7
European Real Estate Society 17th Annual Conference, Milan, June 2010 ONS Clusters

8
European Real Estate Society 17th Annual Conference, Milan, June 2010 Percentages of Local Markets By Regions, Super Regions and Functional Groups: 2007

9
European Real Estate Society 17th Annual Conference, Milan, June 2010

10
Summary Stats: Mean Returns, Risk Measures and Dependency Indices: 1981 -2007

11
European Real Estate Society 17th Annual Conference, Milan, June 2010

16
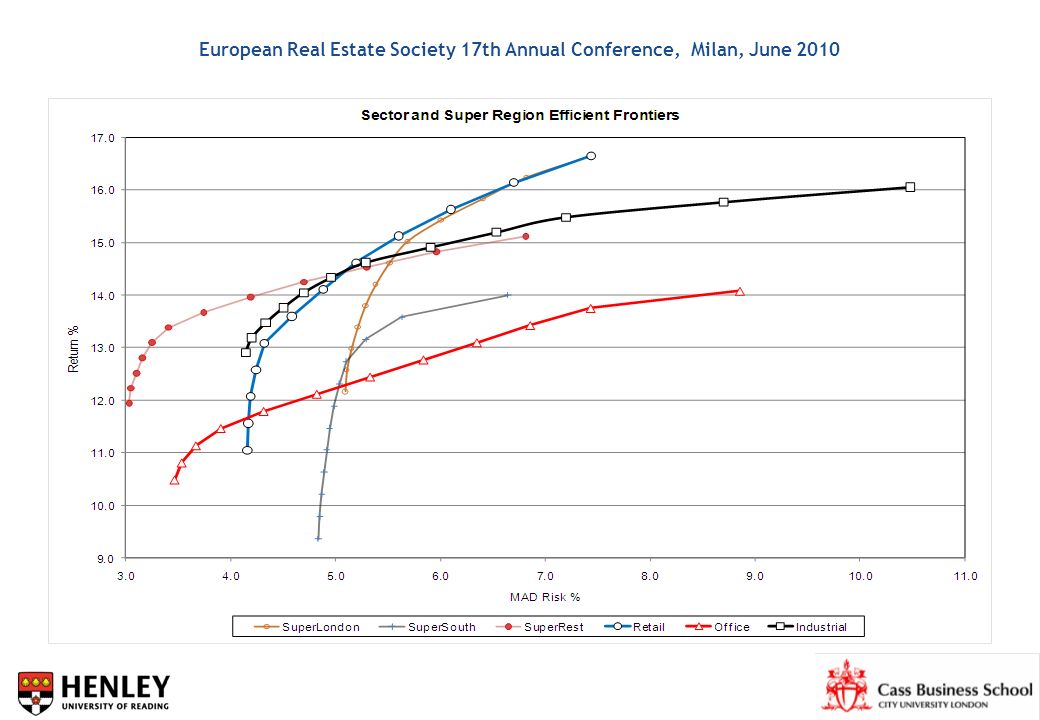
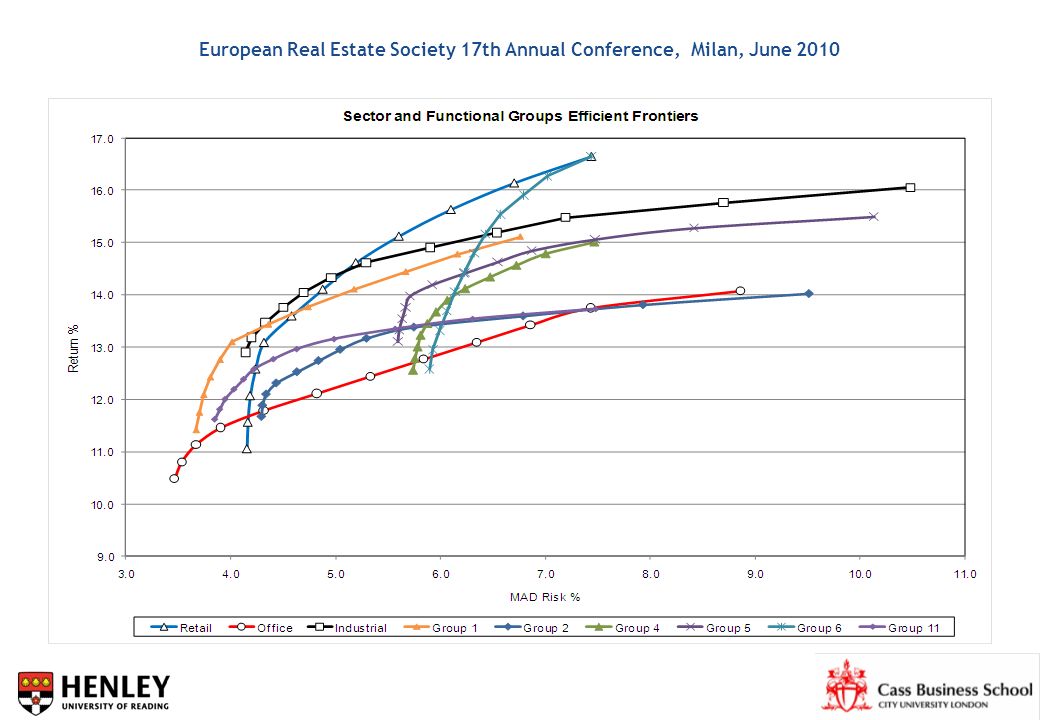
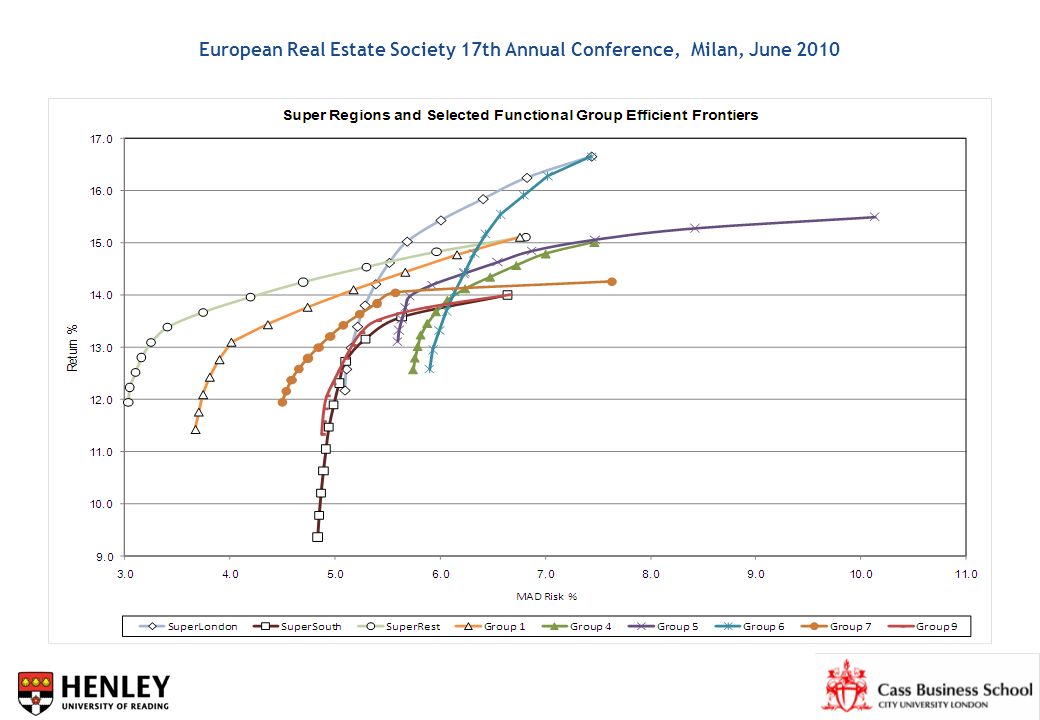
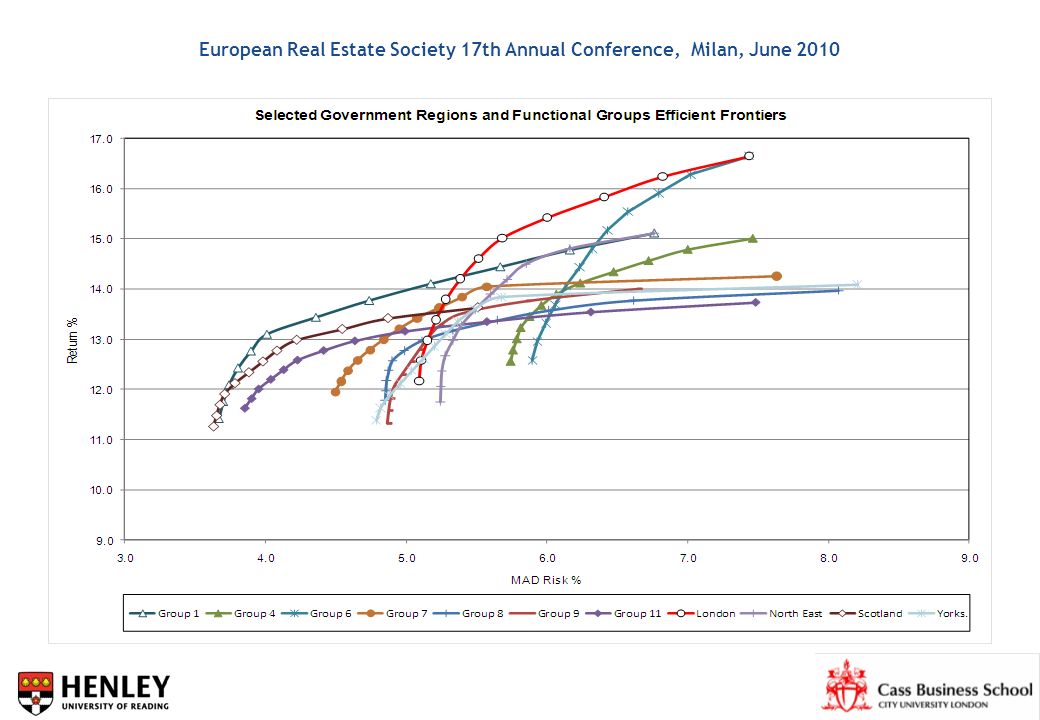
Conclusions Given this analysis, the first level of investigation is still the sector. Then the ‘what is a region?’ question. This analysis shows is that diversification across the SuperRest region would have outperformed almost all other diversification strategies. BUT… Useful risk reduction accrues from the multivariate functional structures, and Functional groups may be much more insightful. The principal issue still to be resolved is the development of a set of widely acceptable functional groupings, since the evidence indicates that such groupings do offer generally superior risk/return performance compared with the static classifications still widely used. BUT….

17
European Real Estate Society 17th Annual Conference, Milan, June 2010 Drums along the Efficient Frontier?* Is there still too much emphasis (by academics at least) on the sector / regional issue? Neither factor is sufficient to give portfolio balance or superior performance for a given level of risk or return. It’s the individual property, and its lease structure in particular**, that matters first in reducing portfolio-level volatility; then the sector then the region ‘Optimised’ portfolios only make sense if they are first constructed from the bottom up and then stress tested for stability in risk/return terms - over time. * With acknowledgments to Mike Young and Wylie Greig (Real Estate Review, 1993) and **Matthew Richardson and Chris Arnold: Fidelity International, Keynote paper at the SPR/RICS Cutting Edge, London, May 2010
 and **Matthew Richardson and Chris Arnold: Fidelity International, Keynote paper at the SPR/RICS Cutting Edge, London, May")
18
European Real Estate Society 17th Annual Conference, Milan, June 2010 Sector, Region or Function? A MAD reassessment of Sector, Region or Function? A MAD Reassessment of Real Estate Diversification in the UK Peter Byrne and Stephen Lee

Similar presentations

 Roberto Martinez.>")


