Download presentation
Presentation is loading. Please wait.

1
AOSC 200 Lesson 11

3
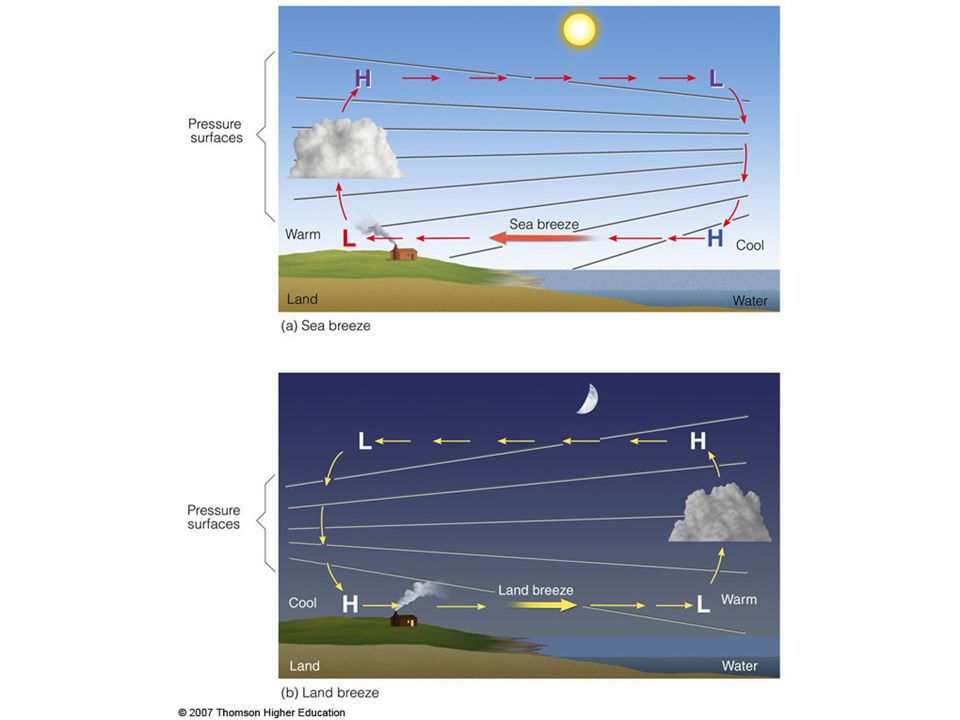
LAND AND SEA BREEZE –During the day, the land heats up quickly, while the ocean heats up slowly –The higher temperatures over land create lower pressure at the surface and the lower temperatures over the ocean create higher pressure at the surface –This produces a pressure gradient from the ocean to the land –The wind flows from the sea to the land – this is known as the sea breeze –At night, this process reverses, and the land cools more quickly than the ocean. This creates an area of lower pressure over the sea, and an area of higher pressure over the land –The wind then flows from the land to the sea – this is known as the land breeze

5
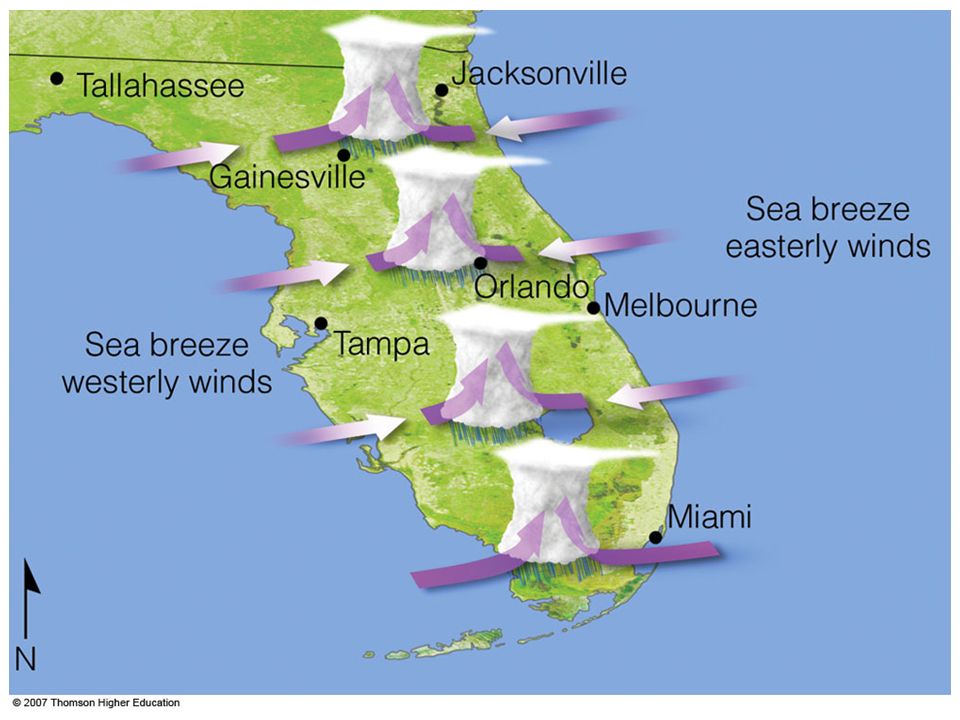
Sea breeze over Florida. In Florida we can have two sea breezes which come from the two land/sea interfaces on either side of the peninsula. These sea breezes will converge at the center of the pensinula and produce clouds and thunderstorms. The thunderstorms occur at the hottest time of the day i.e. about 4 in the afternoon.

6
LAKE BREEZE –The Great Lakes are a large enough body of water to cause the sea breeze effect to take place –This is called the lake breeze

7
Fig. 12.10 Lake breeze on Lake Michigan, July 13, 2000.

8
Mountain and Valley Breeze

9
MOUNTAIN AND VALLEY BREEZE During the day, the slopes of the mountain heat up more quickly than the valley floor Like the sea breeze, the flow goes from higher pressure and cooler temperatures (the valley/sea) to lower pressure and warmer temperatures (the mountain slope/land) Valley breeze At night, the mountain slopes cool more quickly than the valley floor, and the winds reverse – this is the mountain breeze
 to lower pressure and warmer temperatures (the mountain slope/land) Valley breeze At night, the mountain slopes cool more quickly than the valley floor, and the winds reverse – this is the mountain breeze")
10
As the valley breeze forms during the day and forces the air upwards, the moisture that rises can condense and form clouds.

12
Mountain windstorms They occur most often in the winter when the contrast in temperature between the mountain and the valley is large. The example shown previously is a Katabatic wind and occur all over the world. In the US we see them in Colorado and the Columbian river valley. In Boulder, Colorado these winds are funneled down a mountain pass and become severe at the bottom, up to 160 km per hour (100 mph). Boulder Windstorm. See next slide.
. Boulder Windstorm. See next slide..")
13
Fig. 12.14 Winds in the Boulder, CO, windstorm of February 2, 1990

14
http://www.youtube.com/watch?v= sjH0J9D92_Q http://www.youtube.com/watch?v= sjH0J9D92_Q

15
Fig. 12.4

16
MICROBURSTS Microbursts are small scale (<4km), intense downdrafts They can sometimes be caused by the evaporation of rain below a thunderstorm This creates cold, heavy air, which then plunges to the Earth’s surface, where it spreads outward and upward The intense winds last ~10 minutes, and can cause as much damage as a small tornado In the past, microbursts have been the cause of deadly airplane crashes while taking off and landing Now, airports have microburst detectors
, intense downdrafts They can sometimes be caused by the evaporation of rain below a thunderstorm This creates cold, heavy air, which then plunges to the Earth’s surface, where it spreads outward and upward The intense winds last ~10 minutes, and can cause as much damage as a small tornado In the past, microbursts have been the cause of deadly airplane crashes while taking off and landing Now, airports have microburst detectors")
18
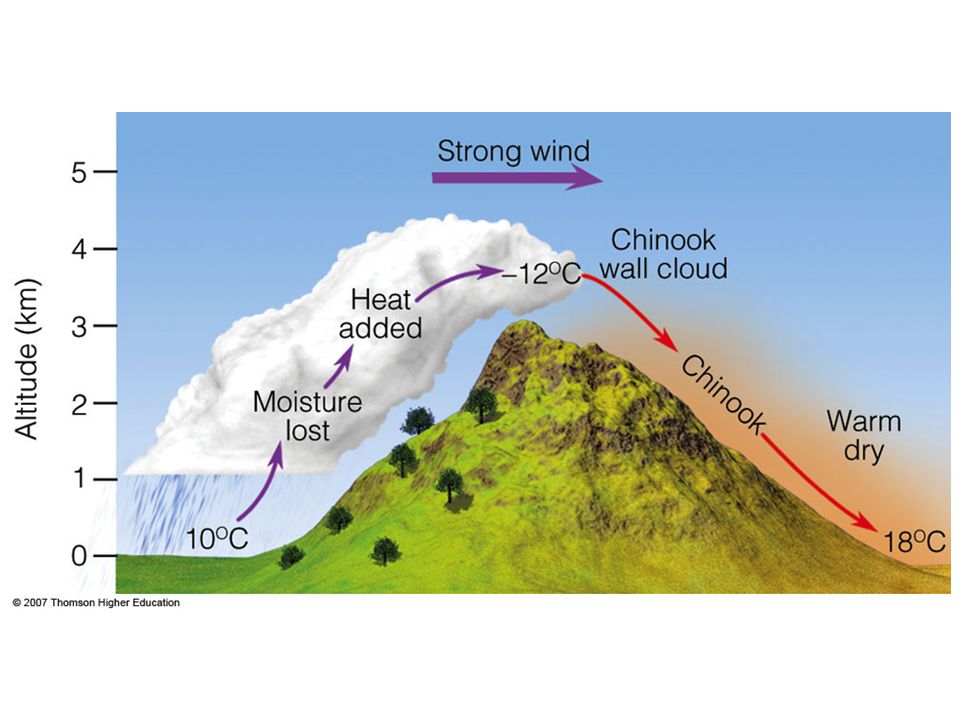
CHINOOK WINDS These occur along the eastern edge of the Rocky Mountains, where the mountains meet the flatlands When air from the west hits the mountains, it is lifted up over the Rockies As the air is lifted, it loses much of it’s water vapor When the air descends on the other side, it has little to no moisture in it, and as it sinks, it compresses and heats The dry, warm wind that results is called a Chinook ( snow eater) In 1943, near Rapid City, SD, a chinook raised the temperature from -4 o F to 45 o F in two minutes!
 In 1943, near Rapid City, SD, a chinook raised the temperature from -4 o F to 45 o F in two minutes!")
20
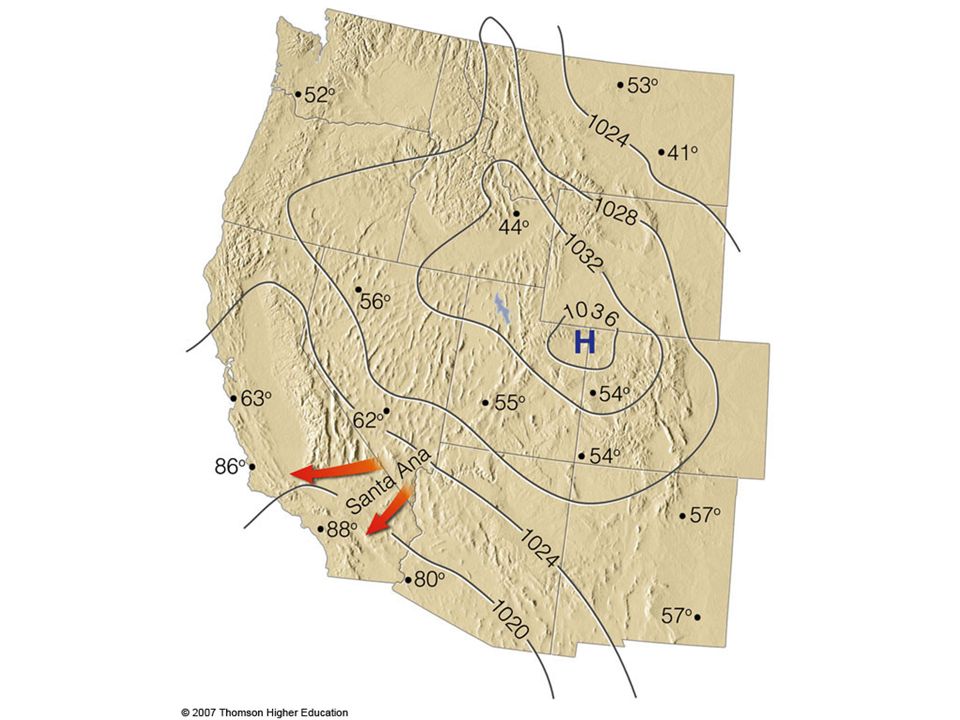
SANTA ANA WINDS Has similar characteristics to a chinook These winds form when an anticyclone is present over the Rockies – most common in the fall The high pressure system forces already dry air from the mountains, down to the western coast The Santa Ana winds create a serious fire hazard, due to the warm temperatures and low humidity

21
Fig. 12-17, p. 368

22
Santa Ana winds – cause and effect

23
DERECHOS A derecho is an hours-long windstorm that can have winds up to 150 mph Occurs in the mid-west. It comes about when a strong summertime jet stream is above a line of severe thunderstorms formed by a stationary cold front The strong, cold downdrafts of the thunderstorms can drag down the high speed air from above

24
Fig. 12.11 Radar image of a Derecho moving through lower Michigan, May 31, 1998

25
Fig. 12-9, p. 360 Number of derecho storms occurring from 1994 to 2003

26
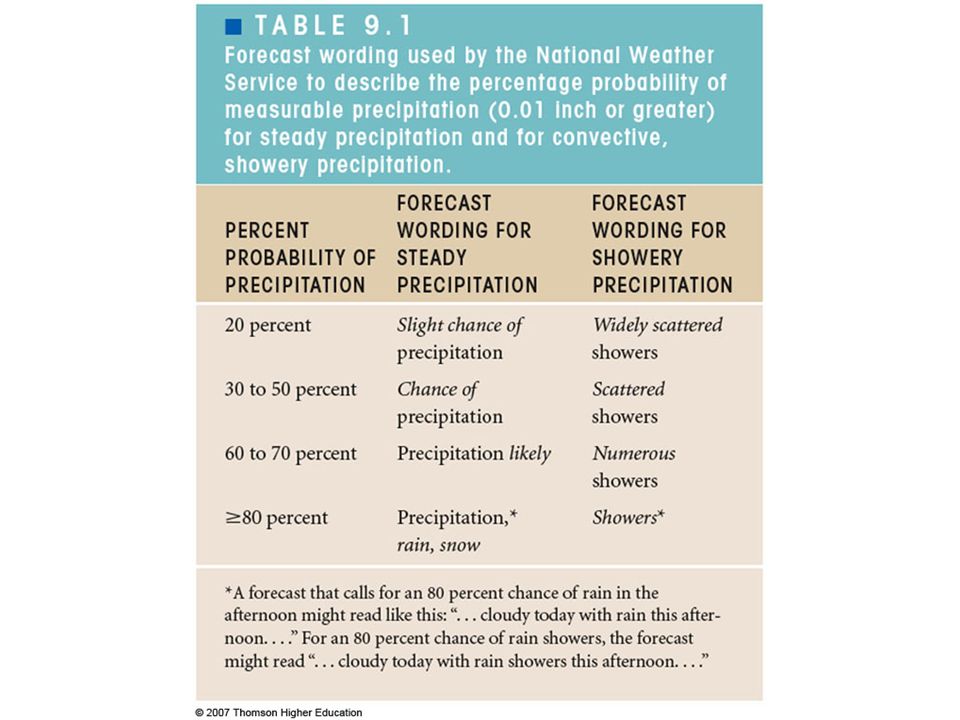
WEATHER FORECASTING FOLKLORE –Red sky at night, shepherd’s delight, –Red sky in morning, shepherd’s warning –When spiders’ webs in air do fly –The spell will soon be very dry PERSISTENCE –The weather tomorrow will be the same as the weather today (two times out of three) CLIMATOLOGY –This takes persistence one step further –The average weather say for a particular month is the same each year * ‘COLD in December – HOT in July’ –English saying: In July the Sun is hot, Is it raining? No it’s not.

29
Fig. 13-1, p. 375

30
Climatology Forecast of a White Christmas

31
TREND AND ANALOG We know that persistence forecasts will eventually be wrong because weather does change. A trend forecast assumes that the weather-causing patterns are themselves unchanging in speed, size, intensity, and direction of movement (this is called steady-state). –For instance: we know that an approaching cyclone will bring rain (weather does change) but assume that the amount of rain or its speed will not change during all the path the cyclone will travel. The analog forecast also acknowledges that weather changes, but unlike the trend method, it assumes that weather patterns can evolve with time. –The main assumption is that weather repeats itself. –Therefore, this method “searches” for past weather patterns that are similar (analog) to the current situation. –In this sense, the future weather patterns “should” be similar to those that happened in the past.
. –For instance: we know that an approaching cyclone will bring rain (weather does change) but assume that the amount of rain or its speed will not change during all the path the cyclone will travel. The analog forecast also acknowledges that weather changes, but unlike the trend method, it assumes that weather patterns can evolve with time. –The main assumption is that weather repeats itself. –Therefore, this method searches for past weather patterns that are similar (analog) to the current situation. –In this sense, the future weather patterns should be similar to those that happened in the past..")
32
Fig. 13-3, p. 378 Trend forecast based on the assumption that a mid- latitude cyclone moves up the East coast unchanged.

33
The D-Day Forecast: June 1944 –Suitable weather for the invasion: Initial invasion around sunrise Initial invasion at low tide Nearly clear skies At least 3 miles of visibility Close to full Moon Relatively light winds Non-stormy seas Good conditions persisting for at least 36 hours, preferably for 4 days –Three meteorology groups worked independently: Analog forecast Bergen Schools: air masses, cyclones and upper level patterns Waves forecast

34
Weather patterns leading up to D-day

35
The D-Day Forecast: June 1944 –First question: What are the odds, month-by-month, that the weather required for the invasion would actually occur? May: 24-to-1 June: 13-to-1 July: 33-to-1 –However, the weather changed from a placid and calm May to a very stormy June. A winter-like pattern not seen in the Atlantic in June in past forty years! –At the beginning the invasion was planned for June 5th but postponed to the 6th due to the weather forecast. This decision turned out to be correct!

36
NUMERICAL WEATHER PREDICTION Step One: Weather Observations Surface observations, Rocket and balloon observations, Satellite observations Step Two: Data Assimilation Model grid and grid points Measurements do not cover all of the globe and are not at set grid points The input data need to be interpolated, smoothed and filtered. This process is called Data Assimilation

37
Data Assimilation

38
Water vapor image

39
NUMERICAL WEATHER PREDICTION Step Three: Forecast Model Integration The measured data (initial conditions) and the “primitive equations” of the atmosphere are used to forecast what the status of the atmosphere will be in the future. In order to get a “good” (accurate and precise) forecast enormous computational resources are needed Step Four: Tweaking and Broadcasting –Current forecasts do not sample the atmosphere on a grid size that picks local events or resolve small scale phenomena Local forecasters use local knowledge and experience to tweak the final forecast for the public
 forecast enormous computational resources are needed Step Four: Tweaking and Broadcasting –Current forecasts do not sample the atmosphere on a grid size that picks local events or resolve small scale phenomena Local forecasters use local knowledge and experience to tweak the final forecast for the public.")
40
Fig. 13.9

41
Fig. 13.13 Concept of a stretched-grid model

42
Richardson’s Model Grid

43
Numerical Weather Prediction Models Short-Range Forecast Models US government uses two models for this purpose ETA model – Run four times per day Rapid Update Cycle (RUC) model– Run every three days Forecast out to 48 hours Medium-Range Forecast Models –Spectral-models –Medium range Forecast (MRF) model Forecast out to 10 days
 model– Run every three days Forecast out to 48 hours Medium-Range Forecast Models –Spectral-models –Medium range Forecast (MRF) model Forecast out to 10 days")
44
Numerical Weather Prediction Models Why Do Forecasts Still Go Wrong Today? Imperfect data Models cannot solve small scale phenomena: parameterization* Chaos: The atmosphere could react very differently to slightly different initial conditions (non-linear system) – butterfly flapping its wings. Is there any solution? Ensemble forecast Vary initial conditions* Use different models
 – butterfly flapping its wings. Is there any solution. Ensemble forecast Vary initial conditions* Use different models.")
45
Forecasting Let’s consider a car that travels at constant speed v from point B towards point C We can use the equation x = x 0 + vt (1) to determine its location (the distance x) at a given time t. x 0 is the distance from point A to point B at t=0

46
Forecasting INITIAL CONDITION This equation comes from a MODEL or idealization of reality. If for any reason x 0 is NOT well known, or there is an “error” in determining the exact location of B, then the equation will give us a different distance to point C

47
Forecasting If we now ask the driver “to go straight” but we don’t give him/her any point of reference (there is no road, trees or anything to use as a reference), the final path could be not as straight as the driver might think Numerical integration takes one small step at a time to move forward
, the final path could be not as straight as the driver might think Numerical integration takes one small step at a time to move forward")
48
Ensemble Forecast

Similar presentations