Download presentation
Presentation is loading. Please wait.

1
Infectious Disease in Africa: lessons learned and their application Michael Welsh, Ph.D.

2
Topics l Population structure and public health challenges l Infectious disease l HIV Epidemiology l Lessons learned in HIV prevention

3
Population of Sub-Saharan Africa by Age and Sex: 2000 to 2005 Source: U.S. Bureau of Census. Male Female Age group < 15 represents 44% of the total population

4
Fertility Decline in Selected World Regions, Early 1960s to 2005 Children per woman* * The average total number of children a woman will have given current birth rates. Source: US Bureau of the Census, International Data Base, September 23, 2002.

5
Use and Total Unmet Need* Women 15-49 Source: Demographic and Health Surveys. *All women 15-49, modern methods. **Currently married women 15-49, modern methods.

6
Infant Mortality by Birth Interval On average, infants born after short birth intervals are twice as likely to die as those born after intervals of two or more years. Source: Country DHS Reports. * Figures here are only for a 2 year birth interval instead of a 2-3 year interval.

7
Traditional Epidemiological Framework Agent Host Environment Disease Source: Center for Health and the Global Environment, Harvard Medical School

8
Leading causes of death in Africa, 2000 Source: The World Health Report 2001, WHO 22.6 10.1 9.1 6.7 5.5 4.3 3.6 3.1 2.9 2.3 0.0 5.0 10.0 15.0 20.0 25.0 HIV/AIDSMalariaPerinatal conditions Tuber culosis Cerebro vascular disease Diarrhoeal disease Lower respiratory infections Measles Ischaemic Heart disease Maternal conditions % of Total

9
Infectious disease deaths as proportion of all deaths by region, 2001

10
Question l Why do you think that Africa has such a serious problem with ID?

11
Factors that contribute to infectious disease in Africa l Poverty: root cause - poor most vulnerable l Demographics: children and women vulnerable l Poor nutrition/food supply: weakens immunity l Access to water ? l Urbanization/housing l Environmental factors l Public health systems l Risk behaviors

12
Per capita gross national income by region (US $) Source: Sachs J. et al., Ending Africa’s Poverty Trap, Brookings Institution, 2004

13
Health Expenditures per Capita

14
Physicians per 100,000 people: 1990-2002 Source: Human Development Report 2003 New York: Oxford University Press, 2003

15
Measles coverage at 1 year World Development Indicators, World Bank, 2002

16
Nutritional Deficits l Annual population increase 2.5 % l Population doubles in approximately 20 years l FAO estimate that 50 % already go “hungry” l Per capita food production has declined since the 70s l Little to no food surplus

17
Access to Improved Water Sources Source: USAID (2002)
")
18
AIDS Mortality Cumulative mortality in US thru Dec 2001 Mortality in sub-Saharan Africa in a single year, 2002

19
15-35% 3-7% 1-5% 0-0.1% HETEROGENEITY OF HIV IN AFRICA

20
HETEROGENEITY OF HIV IN AFRICA A TALE OF THREE EPIDEMICS Manzini, Swaziland Kampala, Uganda Dakar, Senegal 0 5 10 15 20 25 30 35 40 45 50 86889092949698000204

21
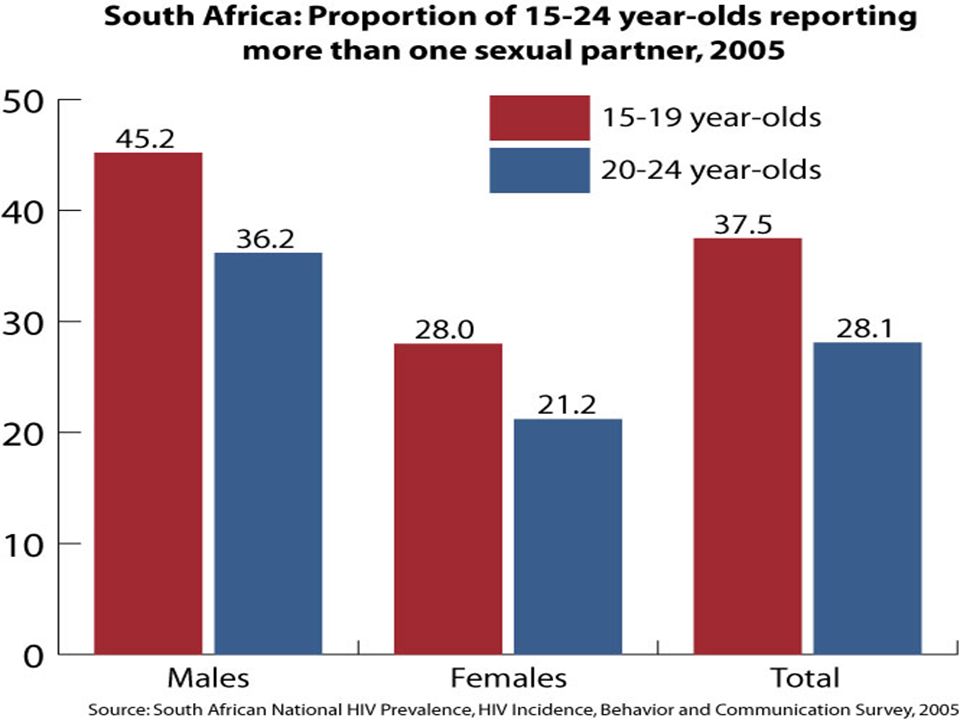
PREVENTION LESSONS FROM GENERALIZED EPIDEMICS Stigma Concurrent sexual partnerships Inter-generational sex Sexual coercion – gender norms Vulnerability of couples Funding should track with transmission Male circumcision

22
HOUSEHOLD HIV PREVALENCE IN FRANCISTOWN, BOTSWANA 0 20 40 60 80 15-1920-2425-2930-3435-3940-4445-49 MaleFemale

23
PERCENTAGE WHO KNOW RELATIVE/FRIEND WHO HAS DIED OF AIDS

26
SEXUAL NETWORKING IN LIKOMA,MALAWI Source: Kohler H and Helleringer S. The Structure of Sexual Networks and the Spread of HIV in Sub-Saharan Africa: Evidence from Likoma Island (Malawi). PARC Working Paper Series: WPS 06-02 Fifth of population in mutually exclusive relationships Two-thirds linked by single network over last three years Networks not anchored by “high frequency transmitters” Decentralized, complex, robust sexual chains
. PARC Working Paper Series: WPS Fifth of population in mutually exclusive relationships Two-thirds linked by single network over last three years Networks not anchored by high frequency transmitters Decentralized, complex, robust sexual chains.")
27
PROPORTION OF 15 - 19 YEAR OLDS IN SOUTH AFRICA WITH SEX PARTNERS 5 OR MORE YEARS OLDER 0 5 10 15 20 MaleFemale HIV PREVALENCE AMONG 15 - 19 YEAR OLDS IN SOUTH AFRICA WITH SEX PARTNERS 5 OR MORE YEARS OLDER 0 5 10 15 20 25 30 Sex partner 5 or more years olderSex partner less than 5 years older

28
SEXUAL PARTNERSHIPS IN SWAZILAND 0% 10% 20% 30% 40% 50% 60% GuardsDriversSoldiersPoliceSeasonal workers SEXUAL PARTNERSHIPS IN LESOTHO 0% 20% 40% 60% 80% SoldiersMinersDrivers Casual sex Commercial sex

29
SEXUAL COERCION IN RAKAI, UGANDA HIV INCIDENCE IN RAKAI, UGANDA

30
HIV PREVALENCE AND TRANSMISSION SOURCES IN ZAMBIA, 2005 Infections from sex work, clients, soldiers, truckers Infections from general population 93% 7% 50% 14%

31
HIV PREVALENCE AND TRANSMISSION SOURCES IN ACCRA, GHANA, 2005 Adult male infections from sex work Adult male infections from general population 2% 78% 24% 76%

32
HIV PREVALENCE, TRANSMISSION SOURCES AND FUNDING IN ACCRA, GHANA 78% 2.2% 76% 24%.08% 99.2% 0% 20% 40% 60% 80% 100% Sex workersGeneral population HIV prevalenceTransmission sourcesFunding

33
BEHAVIORAL AND HIV TRENDS IN KENYA 0 2 4 6 8 10 12 14 45 32 28 25 23 38 28 20 10 7 16 1312 10 0 20 30 40 50 15-1920-2424-2930-3940-49 199319982003 2000 2006 13 5.9 Males reporting multiple partners HIV prevalence

34
Percent reporting multiple partners BEHAVIORAL AND HIV TRENDS IN UGANDA 0 10 20 30 40 1989 1995 1989 351615 1995 1563 Men with one or more casual partners in last year Women with one or more casual partners in last year Men with three or more casual partners in last year 0 2 4 6 8 10 12 14 16 1991 15 2003 4.1 Adult HIV prevalence HIV prevalence

35
Circumcision and HIV Prevalence

36
Impact on HIV incidence: Evidence from observational studies and RCTs Effect size.15.2.3.4.5 1 1.5 Study Effect size (95% CI) Overall 0.42 ( 0.34, 0.52) High-risk groups 0.29 ( 0.20, 0.42) General Population 0.56 ( 0.44, 0.71) South Africa 0.40 ( 0.24, 0.67) Kenya 0.41 ( 0.24, 0.70) Uganda 0.49 ( 0.28, 0.86)
 Overall 0.42 ( 0.34, 0.52) High-risk groups 0.29 ( 0.20, 0.42) General Population 0.56 ( 0.44, 0.71) South Africa 0.40 ( 0.24, 0.67) Kenya 0.41 ( 0.24, 0.70) Uganda 0.49 ( 0.28, 0.86)")
37
Evidence from RCTs SitePopulationEffect Orange Farm, SA18 -2460 % Rakai, Uganda15 – 4948 % Kisumu, Kenya18 – 2453 %

38
FP Complements Other Programs to Reduce Infant Infections/Deaths Source: USAID, 2003. Benefits of integrating family planning and nevirapine programs – annual projection of infections and deaths averted

39
HIV – AIDS Prevalence 25.4 million Incidence 3.1 million Mortality 2.3 million HAS HIV INCIDENCE PEAKED IN AFRICA? HIV prevalence has fallen in several African countries – as the balance between HIV incidence, HIV prevalence and mortality shifts

40
Interventions that work l Male circumcision l ARVs! l Targeted interventions with BCC and condom promotion l ABCs l VCT l STI Rx and Dx l PMTCT and FP

41
Important New Initiatives l PEPFAR l Gates Foundation (Buffett) l Global Fund for AIDS Malaria and TB
 l Global Fund for AIDS Malaria and TB")
42
Summary l Poor health effects women and children disproportionately l FP is a key intervention l ID extracts a huge burden on Africa and frustrates development l Generalized and concentrated HIV epidemics demand customized responses l AIDS taking a toll; new knowledge and large investments fuels hope

Similar presentations


 for AIDS Prevention? Daniel Halperin, PhD, MS Senior Advisor for Behavior.>")


>")
 A Research Unit of the University of Cape Town.>")


>")