Download presentation
Presentation is loading. Please wait.

1
Supply and Demand 101

2
A Basic Supply and Demand Curve The vertical axis is PRICE The horizontal axis is QUANTITY The Demand curve slopes down and to the right The Supply curve slopes up and to the right

4
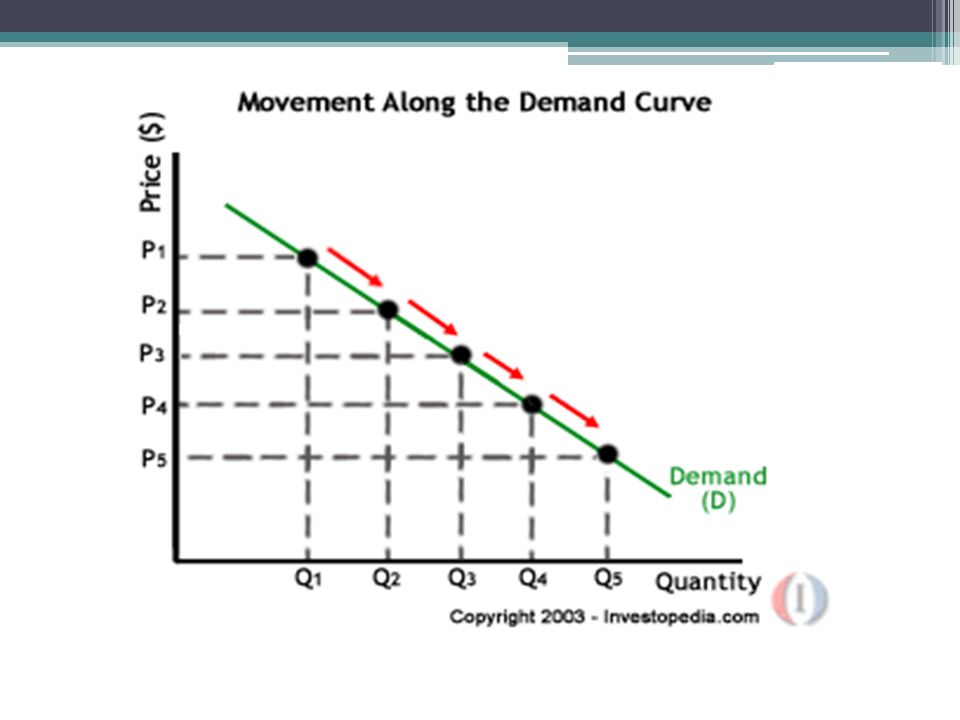
Law of Demand Price goes up, demand goes down Price goes down, demand goes up Price and demand have an inverse relationship There is a price change, and all movement is along the demand curve Movement means a new variable has been introduced

6
Factors that Influence Demand Population increase Income Tastes and Preferences Substitution Effect Complimentary goods Weather How satisfied we are

7
Law of Supply The belief that as the price of a good rises, the quantity supplied will rise Price goes up, supply goes up Price goes down, supply goes down They have a direct relationship and they move in the same directions Like demand, a change means there was a change in price and movement along the curve. A new variable has been introduced.

9
Variables in supply Raw materials used in products (inputs) Technology- lowers cost of production, produce more Taxes- regulations protect the consumer, make things more expensive Government regulations- protect the consumer, make things more expensive Work productivity- happy workers, better production Competition- increases supply, lack of shrinks supply
 Technology- lowers cost of production, produce more Taxes- regulations protect the consumer, make things more expensive Government regulations- protect the consumer, make things more expensive Work productivity- happy workers, better production Competition- increases supply, lack of shrinks supply")
10
EQ, Shortage and Surplus Equilibrium Price- The price that both buyers and sellers will accept. Where supply and demand curves meet on the graph Surplus- extra goods; difference between what the seller is willing to supply and what buyers are willing to pay Shortage- goods needed to greater than what is produced.

Similar presentations


 Petr Wawrosz. The demand side of the Market The demand curve: Relationship between price (independent variable, vertical.>")


 Zhang.>")


